
Abstract
This paper describes a novel optimization-based analysis framework to evaluate the cost benefits of retrofit programs of existing Saudi housing stocks with the main objective to reduce their electrical peak demands. The retrofit programs are developed to minimize the cost for peak demand reduction while maximizing energy use savings to select sets of energy efficiency and renewable energy technologies for various residential building prototypes prevalent in Saudi Arabia. The effectiveness of large-scale implementations of optimal retrofit packages is evaluated to assess their cost benefits as well as their effects on shaping Saudi electrical load profiles. It found that the optimal retrofits are more effective than the deployment of rooftop PV systems in reducing both peak demand and annual energy consumption for Saudi housing stock. In particular, the analysis indicates that retrofitting the housing stock with one energy efficiency measure reduces electrical peak demand at 779 USD/kW lower than that attributed to deploying rooftop PV systems.
Introduction
In order to better match demand with supply and improve the grid reliability and resiliency, several solutions are available including building new power plants, establishing interconnections with other countries, developing energy storage technologies, and implementing demand side management (DSM) programs (Strbac, 2008). In particular, DSM programs targeting the building sector encompass actions to manage and lower energy demands and to achieve various objectives such as balancing supply and demand as well as carbon emission reduction (Warren, 2014). Typically, DSM load management programs include (Eissa, 2011).
-
(i)
energy efficiency (EE) to use less energy to provide the same service,
-
(ii)
demand response (DR) to influence responses from the users through incentive payments or price changes, and
-
(iii)
on-site generation and storage to install cogeneration systems and/or renewable energy (RE) technologies such as rooftop PV panels and batteries.
Generally, EE technologies result in long-term energy use savings, while DR technologies aim at reducing energy demand at critical short time periods (i.e., on-peak demand periods). There are overlapping effects between EE and DR technologies and programs. Indeed, most EE technologies reduce peak demands and thus have DR benefits including dimming controls (lighting systems), smart thermostats (temperature settings), demand ventilation controls (fresh air intake), and optimal start strategies (for operating heating and cooling equipment) (Behboodi et al., 2016; FERC, 2019). However, several DR actions can reduce or shift peak demand but may increase energy use. For instance, pre-cooling or storage strategies to cool buildings typically lower peak demand but often result in an increased energy consumption (Bradley et al., 2013).
Currently, the vast majority of the EE and DR programs are not coordinated and offer only one set of benefits (i.e., specific to either EE or to DR but not to both). In the USA, it is estimated that only 3% of the programs combine EE and DR benefits, while 88% focus on EE and 9% on DR and/or load management (EIA, 2019; EPA, 2010). In the USA, EE programs are typically designed and administrated by state agencies or non-utility entities, while DR programs are managed by utilities. Moreover, rate structures for residential and small commercial buildings do not typically involve dynamic rate structures such as time-of-use (TOU) or real-time pricing (RTP) often imposed on large commercial buildings. While most building owners and operators value the investments in EE projects, they do not perceive directly the benefits of DR programs. Indeed, the DR programs are seen as either of uncertain benefits—the DR programs are dependent on incentives and rate structures that may easily change—or taxing for building occupants—DR programs require complex strategies to implement and may affect the indoor comfort levels for occupants (EPA, 2010). Moreover, the implementation of EE and DR programs relies often on different business models that contractors such as energy services companies (ESCOs) are unwilling to combine. In particular, EE programs need large capitals to implement (i.e., investments in new boilers and chillers) resulting in long-term contracts preferable to ESCOs. Meanwhile, DR programs can be deployed with low investments (i.e., costs to change controls) and necessitate short-term contracts, not the desirable business options for ESCOs (EPA, 2010).
Gellings (C.W. Gellings C.W., 1996), who first coined the term DSM in the 1980s, has mainly called for programs to affect the magnitude and pattern of electricity usage in order to affect the demand shape and the load factor to match the power generation profile of the supply assets (Gelazanskas & Gamage, 2014). However and especially in the last decade, DSM programs have been utilized worldwide for various objectives including modernizing the electric power grids to make them reliable, smart, and resilient as well as mitigating the impacts of climate change and increasing the adoption of distributed energy resources (Alasseri et al., 2017; Bahl et al., 2017; Bergaentzlé et al., 2014; Fattahi & Deihimi, 2017; Harish & Kumar, 2014; Ikpe & Torriti, 2018; Khan, 2019; Ming et al., 2013; Warren, 2018). Currently, several business models and policies are available to implement DSM programs depending on the stakeholders such as system operators, power generators, demand resource providers, and power users including owners/operators of buildings (Behrangrad, 2015).
In particular and even though energy efficiency does not provide dispatchable power for the system operators, it can be considered as a capacity resource by demand resource providers since reducing building loads offers effectively free generating capacity. Thus, energy efficiency can compete with other power generation options in energy capacity markets through a competitive bidding procedure based on cost of demand reduction often coined as “negawatts” (Lovins, 1990; PJM market 2020). In the USA, EE programs have saved over 28 TWh/year of electricity use and 8.3 GW of peak demand during 2018 with most of these savings achieved by the residential sector (EIA, 2019). The global market for DSM is expected to grow significantly in the next decade and is estimated to generate up to 63.6 USD billion in spending through 2028 (Navigant, 2019).
The benefits of EE programs for the building sector are widely documented in the literature including their non-energy benefits including economic, environmental, and social impacts (IEA, 2019; Krarti et al., 2019; Russell et al., 2015; WGBC, 2013). Moreover, the selection approaches for the best EE technologies to reduce cost-effectively energy consumption for buildings are well established including designing and retrofitting building to be net-zero energy (Ferrara et al., 2018; Krarti, 2018; Lu et al., 2015; Wells et al., 2018). However, limited analyses have considered designing and developing energy efficiency programs to specifically reduce electrical peak demands. Even the reported analyses that considered peak demand reductions are based on individual or specific sets of unoptimized EE measures (Dortans et al., 2020; Frick et al., 2019; McNeil et al., 2019). For instance, a replacement of existing lighting systems with LED fixtures in residential buildings in New Zealand found that electrical peak demands can be reduced by 9% even though lighting contributes only 4% of the overall national annual electricity consumption (Dortans et al., 2020). Using a bottom-up analysis approach, the impacts of deploying energy-efficient lighting systems and appliances to Indonesian housing stock have evaluated on both energy consumption and peak demand reductions (McNeil et al., 2019).
Most of the reported analyses on peak demand shifting and reduction have mainly considered only optimized controls of only individual buildings rather than building stocks. Generally, the aim of the optimized controls is to operate energy systems within buildings to accommodate variable power generation capabilities and prices associated with smart grids (Alimohammadisagvand et al., 2016; Arabzadeh et al., 2018; Dileep, 2020; Makhadmeh et al., 2019; Sarker et al., 2021; Sehar et al., 2016). For instance, the performance of model predictive controls has been investigated for ground source heat pumps, water heaters, and PV systems within residential buildings (Arabzadeh et al., 2018). Furthermore, optimized controls of energy systems in a home coupled with the use of thermal energy storage to optimize the benefits of their demand response capabilities (Alimohammadisagvand et al., 2016). Moreover, several studies have considered optimized temperature settings to reduce peak demands while maintaining desired thermal comfort levels (Makhadmeh et al., 2019; Sehar et al., 2016). Most of the optimization studies related to peak demand reduction or shifting utilize simplified building energy models and machine learning techniques (Barber & Moncef Krarti, 2022).
No analysis framework has been reported to optimize the cost of peak demand reduction to develop retrofit programs for entire housing stocks. In this paper, an optimization-based approach is described to select retrofit measures suitable for existing housing stocks that minimize the cost of electrical demand reduction while maximizing annual energy savings. This peak demand-based optimization analysis represents a novel approach to design and assess the cost benefits of large-scale energy retrofit programs for existing building stocks. Typically, energy efficiency programs are based on minimizing energy consumption (Krarti, 2018). The presented optimization approach is used to improve not only the energy efficiency performance but also the demand response capabilities including peak demand reduction of the existing housing stock of the Kingdom of Saudi Arabia (KSA) (Krarti et al., 2020). In particular, the optimization analysis identifies the best suitable EE measures that lower the cost of peak demand reduction for all the housing prototypes. The impacts of these optimized EE retrofits are determined on the hourly load shapes for Saudi residential building stock. In this study, the cost benefits of different large-scale EE retrofit scenarios are compared to those of rooftop PV deployment programs. The paper is organized into four sections after this Introduction section to highlight the novel optimization analysis approaches and the application to the Saudi existing housing stock. First, historical characteristics of electrical energy consumption and peak demand associated with building stocks in various Saudi regions are discussed. The general optimization analysis approach is introduced in the “Analysis methodology” section including the optimization objective function and the solution methodology involving the effective sequential search technique combined with detailed energy modeling of a comprehensive set of energy efficiency measures applied to prototypical buildings representing the existing housing stock. The “Results and discussion” section summarizes the results of applying the peak demand-based optimization approach to individual Saudi residential buildings and to the entire housing stock. The “Cost benefit analysis” section presents the cost benefits of various large-scale retrofit programs of Saudi existing housing stocks using the perspective of the Saudi government to account for the real cost of generating electricity.
Analysis of Saudi electricity demand
Over the last decade, the electricity consumption of Saudi Arabia has initially increased due to a significant growth of demand associated with added stocks of new buildings and industries and then stabilized after the initial phase of the energy price reform during 2016 with a slight decline during 2018 as illustrated by Fig. 1 (SAMA, 2019). As noted in Fig. 1, the residential sector consumes the most electricity in Saudi Arabia even though its contribution declined from 50.4% in 2015 to 44.9% in 2018. Indeed, Saudi housing electricity consumption has decreased significantly during 2015 through 2018 more than any other sector as illustrated in Fig. 2. Specifically, only the residential sector has seen its energy consumption reduced by 10% during the 2015 to 2018 period, while the other sectors have flat or increased electricity demand during the same period. This decrease in residential energy use can be attributed to behavioral changes after the energy price reforms of 2016 and 2018 since the housing stock has actually increased during the period between 2015 and 2018 (GAStat, 2018).

Saudi Arabia annual electricity consumption by sector from 2005 through 2018 (Data source: (SAMA, 2019))

Percent change of annual Saudi electricity consumption by sector relative to 2005 (Data source: (SAMA, 2019))
As illustrated in Fig. 3, the overall Saudi electricity peak demand has also declined after 2015 even though the number of subscribers to the grid has increased steadily. The highest peak demand during 2005–2018 period has occurred in 2015 with over 63,000 MW and has stabilized to 62,000 MW during 2017 and 2018 after being 60,800 MW during 2016. The highest electricity consumption is experienced during the summer periods for all the four Saudi regions with peak demands occurring during July 22 (Western region), July 23 (Southern region), and July 29 (Eastern and Central region). The overall Saudi electricity peak demand is experienced on July 29 at 3 pm (Alaidroos et al., 2015). Saudi hourly load duration curve in 2015 is presented in Fig. 4 indicating a peak demand of 60,118 MW. Table 1 summarizes the main characteristics of load profiles for the four Saudi regions in 2015 as well as the overall electrical system. It is clear that there are significant differences between the peak demand and the average load for all regions especially for the Central and Western regions resulting in low load factors ranging from 0.58 to 0.72. Moreover, the peak demands for each region occur only for a limited number of hours during the year as detailed in Table 1 for both 95% and 90% thresholds. The low load factors and number of hours of peak demand present opportunities for DSM programs. Specifically, well-targeted DSM measures applied during only 63 h are sufficient to reduce the peak demand by 5%. A more aggressive DSM action for a duration of 367 h can lower peak demand by 10% resulting a new peak of less than 54,000 MW. The best Saudi locations to perform DSM programs are primarily in the Central and the Western regions with the lowest load factors and the highest peak demand to baseload ratios as listed in Table 1. The southern region has a rather low electricity demand due to sparse population as well as mixed climates with locations requiring substantial heating (i.e., Abha) and others needing only air conditioning (i.e., Jazan).

Peak electricity demand and number of Saudi grid subscribers between 2005 and 2018 (Source of Data: (Alaidroos et al., 2015))

Hourly cumulative frequency distribution of 2015 electricity demand by region (Source of data: (Alaidroos et al., 2015))
Analysis methodology
The aim of the analysis presented in this study is to assess optimal EE measures that reduce both peak demand and annual energy consumption for the existing Saudi housing stock. Figure 5 provides the flowchart of the optimization analysis framework. Specifically, the analysis includes three steps:
-
(i)
Define housing prototypes to represent the residential building stock as detailed in the “Housing stock prototypes” section for the case of Saudi Arabia.
-
(ii)
Perform an optimization analysis to select a set of EE and RE measures that reduces the cost of the electricity demand while maximizing energy savings without affecting indoor thermal comfort. The set of EE and RE measures considered in this study are described in the “Description of energy efficiency measures” section, while the optimization analysis is outlined in the “Optimization analysis” section using a sequential search technique, and
-
(iii)
Assess the impacts of optimal EE and RE sets on the overall grid load profile including peak demand and load factor for various Saudi regions and entire network. In particular, the effects of the optimized retrofit measures on the grid load profile are discussed in the “Results and discussion” section. Moreover, the cost benefits of large-scale implementation of the optimal EE sets as well as various rooftop PV systems are evaluated in the “Cost benefit analysis” section.

Flowchart for the methodology to determine optimal retrofit measures for the KSA residential building stock
The following sections outline the analysis approach including the building stock model as well as the optimization technique.
Housing stock prototypes
As detailed in Krarti et al. (Krarti et al., 2020), the existing Saudi residential building stock can be modeled using 54 housing unit prototypes defined by three characteristics including type, vintage, and location as briefly outlined below:
-
(i)
Type: with three categories including villas, apartment units, and traditional houses. The main features for the Saudi housing prototypes are summarized in Table 2 including the operation schedules. Renderings for the energy models of three housing prototypes are illustrated in Fig. 6.
Table 2 Main specifications for the three Saudi housing prototypes Fig. 6 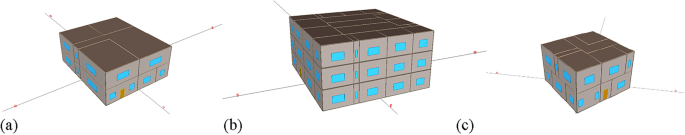
Renderings of energy models for a villa, b apartment, and c traditional house
-
(ii)
Vintage: depends on the construction year of housing units and includes old (O) buildings (i.e., constructed more than 10 years) with no thermal insulation and with single glazed windows as detailed in Table 2), recently (R) built housing (ranging from 5 to 10 years old buildings) to include RSI-1.5 polystyrene (50 mm) thermal insulation in walls and roof in addition to the specification of Table 2, and new (N) construction (typically less than 5 years) with specifications of R buildings in addition to double glazing windows instead of single-pane windows.
-
(iii)
Location: accounts for both the climatic condition and administrative regions. Six locations are considered in this study (Jeddah, Riyadh, Dhahran, Abha, Jazan, Tabuk).

Based on the calibrated KSA residential building stock model (Krarti et al., 2020), the energy use for any time t, ECS(t), associated with the housing stock for a given province or the entire country can be estimated as follows:
where.
-
fc,v,l is the fraction of housing units that belong to a set of category, vintage, and location
-
Ac,v,l is the floor area of all housing units specific to a combination of category, vintage, and location
-
EUIc,v,l (t) is the energy use per unit area during the time for the housing unit that represents a specific category, vintage, and location
The values for the fc,v,l and Ac,v,l are characteristics of the KSA housing stock that have been collected for various Saudi regions (Krarti et al., 2020), while EUIc,v,l (t) is determined through a detailed whole-building simulation analysis using the 54 energy models outlined in Table 2 (Krarti et al., 2020). These models and their predictions for both individual building types as well as the entire housing stock for KSA have been thoroughly documented and validated (Krarti et al., 2020). The EUI varies depending on the package of EE and RE measures considered for each building model as part of the optimization analysis as discussed in the “Description of energy efficiency measures” and “Optimization analysis” sections.
Description of energy efficiency measures
In addition to roof PV systems, a set of proven EE measures are considered in the optimization analysis to assess both their peak demand as well as energy use saving potentials. Table 3 lists the specific EE and RE measures evaluated in the study.
The implementation capital costs of the EE measures, listed in Table 3, have been estimated from various sources (Krarti, 2012, 2015; Krarti et al., 2017). For three housing prototypes outlined in Fig. 4, the capital costs are independent of the location and listed in Table 4 based on the geometric dimensions specific to each housing prototype and the EE measure.
Optimization analysis
As noted earlier, the main goal of this study is to determine the best set of EE and RE measures that need to be implemented for the housing units in order to minimize the cost of their electricity peak demand reduction while reducing the annual energy consumption. To achieve this target, an optimization analysis is carried out to minimize the cost function, Cd, from the application of any EE/RE measure:
where.
-
CEE is the implementation cost for a set of EE/RE measures;
-
Eb,j is the baseline electricity demand for the time step j (typically 15-min period), and
-
EEE,j is the electricity demand for the time step j after implementation of the set of EE/RE measures.
The cost function of Eq. (2) does not consider when the peak demand occurs but involves only the largest difference in demand reduction between the baseline and retrofitted housing units. Moreover, Saudi energy charges for residential buildings do not include any time-of-use rates. The optimization period for Eq. (2) is an entire year rather than a specific month since the goal of the study is to evaluate the best large-scale retrofit programs that result in lower electrical peak demand and thus lower the need for either constructing future power plants or using less efficient power plants to meet these demands.
Figure 7 illustrates the hourly demand reduction (Eb,j − EEE,j) estimated from both the baseline and the retrofitted housing unit load profiles due to a set of EE/RE measures. It should be noted that the estimation of the maximal demand reduction requires the estimation of the hourly load profiles for both baseline and the retrofitted housing units. For Saudi housing units, the peak electricity demand as well as integrated electricity consumption occurs generally during periods when air conditioning load is at the highest, that is, during daytime hours of the summer months when solar resources are also the highest. Thus, the optimization cost function of Eq. (2) implies that the main objective is to maximize the peak demand reduction since most relevant retrofit measures aim at reducing cooling thermal loads. The electricity load profiles and when the peak demands occur for both individual residential buildings and housing stocks will be discussed in the “Results and discussion” section.

Illustration of maximal demand reduction estimation between baseline and modified load profiles
The optimization method is based on the sequential search technique that has been used so far only for maximizing energy efficiency performance for buildings (Christensen et al., 2004; Deneuville & Krarti, 2015; Griego et al., 2015; Ihm & Krarti, 2012; Tuhus-Dubrow & Krarti, 2009). In this analysis, the sequential search technique is applied for the first time to identify effectively the combinations of EE and RE measures that maximize the demand cost reduction while achieving the highest energy efficiency performance for retrofitting buildings. Specifically, the optimization cost function in this analysis is to minimize the demand cost defined in Eq. (2) while maximizing the annual energy savings as indicated by Eq. (3):
with Eb,j and EEE,j are the electricity demands during the time step j for, respectively, the baseline and the retrofitted building cases. Note the summation in Eq. (3) spans for an entire year to obtain annual energy savings.
Thus, the optimization has two objectives: (i) minimize the cost of electricity demand reduction and (ii) maximize annual energy savings. The sequential search technique is suitable for this multi-objective optimization and allows the effective determination of the optimal path with reduced computational efforts as illustrated by the Pareto diagram in Fig. 8. The sequential search technique illustrated in Fig. 8 determines the optimal path through an iterative procedure. First, all the EE/RE measures are evaluated individually to assess the values of demand reduction cost (i.e., Cd) and the energy savings (i.e., ΔE). The specific EE/RE measure that provides the lowest Cd value with maximum energy savings is selected based on the lowest Cd to ΔE ratio. The new baseline becomes the modified housing unit with the selected EE/RE measure implemented in the prototype energy model. Then, the search is repeated to select the next best EE/RE measure using the same procedure by identifying the lowest slope of Cd to ΔE. This sequential search is carried out until all the EE/RE measures are exhausted resulting in combinations of EE/RE measures that provide the lowest Cd values with increased energy use saving levels, ΔE, as illustrated by the optimal path or Pareto curve in Fig. 8. Using this optimal Pareto curve, the optimal set of EE/RE measures that provides the lowest cost for demand reduction can be determined based on the desired energy efficiency target. Typically, the cost of peak demand reduction increases with higher annual energy saving levels as discussed in the following section after applying the optimization analysis framework to the Saudi housing stock.

Sequential search technique to determine the optimal Pareto path
Results and discussion
In this section, some representative analysis results are presented to provide insights on the benefits of EE/RE measures in reducing electricity peak demand as well as energy consumption for various housing types and climatic conditions.
Impact of EE and RE measures on individual housing units
Recently, Saudi Arabia has approved a regulatory framework from small-scale solar distribution systems to be grid-connected (ECRA, 2020) (ECRA, 2020a). While not yet enacted, the framework allows the introduction of the net-metering concept using a net-billing mechanism to credit PV-generated electricity exported to the grid at set rates. For instance, households are credited 0.07 SAR/kWh (0.0187 USD/kWh) for any excess electricity generated by rooftop PV systems. Therefore, the proper selection of the PV system is important in order to optimize its cost-effectiveness. Figure 9 illustrates the impact of a rooftop PV system compared to the application of wall/roof insulation on the load profiles for a winter day (Fig. 9a) and a summer day (Fig. 9b) for a traditional house in Riyadh. As noted in Fig. 9a, the electricity generated by the PV system exceeds slightly the needs of the house during the 11 am to 3 pm period during the winter day but keeping the peak demand at 7 am unchanged due to heating requirements. However, the application of thermal insulation in the walls and roof significantly reduce the heating demand and thus the peak demand that still occurs in the morning due to space heating needs. During the summer, the electricity produced by the PV system helps reduce the electricity demand during the day (9 am to 5 pm) resulting in a peak demand that occurs around 6 to 7 pm. On the other hand, the hourly electrical demand has significantly decreased throughout the day due to the thermal envelope improvements. Indeed, the reduction in space cooling needs providing not only lower peak demand but also a more uniform load profile than the house equipped with a PV system.

Load profiles due to the addition of rooftop PV system and the improvement of building envelope for a traditional house in Riyadh during a a winter day and b a summer day
Figure 10 compares the load duration curves (i.e., cumulative frequency curves) for the baseline old traditional house integrated with rooftop PV system and retrofitted with wall and roof insulation. It is clear that the addition of thermal insulation to the building envelope has the most dramatic impacts on the house load curve than those obtained by deploying the rooftop PV system. The main features of the hourly load profiles for the three design options for the old traditional house are summarized in Table 5. In addition to reductions in both energy use and peak demand, the addition of thermal insulation slightly improves the load factor and results in a more uniform electrical load while expanding the number of hours that the load exceeds 90% of the peak demand from 105 h for the baseline to 141 h. However, the integration of the rooftop PV does not only reduce the peak demand but also lower the load factor and reduce the number of hours when the load is above 90% of peak demand to just 77.

Load duration curves for baseline, PV-integrated, and insulated old traditional house in Riyadh
Optimal EE measures
Figure 11 shows the optimization results using the sequential search technique to minimize the cost for electrical demand reduction defined by Eq. (2) and maximize the annual energy use savings expressed by Eq. (3) for both old and new prototypes for the traditional house in Riyadh. A solid line in Fig. 11 indicates the path of the lowest cost of demand reduction as a function of the annual energy saving expressed in percent relative to the baseline cases. As expected, when the annual energy savings increase, the cost to reduce electrical demand increases for both prototypes. Reductions in both peak demand and energy use are more costly to achieve for the new vintage than for the old vintage using the set of EE/RE measures listed in Table 3. For instance, a 40% reduction in the annual energy consumption for the old traditional house requires 1000 USD per kW of demand reduction. The same energy use reduction needs an investment of 2000 USD/kW for the new prototype. It is interesting to note that based on rooftop PV installation cost of 3000 USD/kW, the optimal EE measures can provide at least 68% of the total energy consumption for an old traditional house located in Riyadh using the optimal Pareto curve of Fig. 11a. However, and as summarized in Table 5, the rooftop PV system with a capacity of 6 kW (based on the available roof area) can reduce the annual energy consumption only by 22.7% for the old traditional house in Riyadh without significantly affecting peak demand (only 1 kW or 7.4% reduction of the 13.47-kW baseline peak demand). At the energy efficiency level of 22.7%, the optimal set of EE measures would cost less than 1000 USD/kW as estimated in Fig. 11a.

Optimization results for a old, b recent, and c new vintages of the traditional house in Riyadh
Similar findings are obtained for other locations and housing types as illustrated in Fig. 12 for the old, recent, and new traditional house prototypes in Abha as well as in Fig. 13 for the villa and apartment prototypes and all vintages located in Riyadh.

Optimization results for a old, b recent, and c new vintages of the traditional house in Abha

Optimization results for a old, b recent, and c new vintages for both the villa and the apartment prototypes located in Riyadh
Table 6 lists the various EE measures selected sequentially during each of the first nine iterations by the optimization approach for all the Saudi housing units including type, vintage, and location. The rooftop PV system is not selected during these nine iterations for any housing type, vintage, and location. As indicated in Table 6, the least expensive EE measures with the most energy use and demand reduction potential are selected first including higher efficiency lighting and lower air infiltration. For old vintages, the most effective EE measures are higher efficiency air conditioners or added thermal insulation for walls depending on the location. Replacing the windows to be double-pane is highly expensive with little energy savings potential and thus is selected as the last measure by the sequential optimization for both old and recent vintages that have single-pane windows.
Impact of large-scale energy retrofit programs
In this section, three retrofit scenarios are considered for each housing type, vintage, and location using the specific optimization results summarized in Table 6. Specifically, these three retrofit cases depend on the number of EE measures in the optimal combinations obtained using the sequential technique including.
-
EEM-1 corresponds to the retrofit program that calls for only the implementation of just one EE measure for each housing unit. This measure is the first EE option identified by the optimization analysis as indicated in Table 6.
-
EEM-3 refers to the retrofit program that includes the first three EE measures listed in Table 6 for each housing unit type, vintage, and location.
-
EEM-5 indicates the retrofit scenario with five EE measures in the order indicated in Table 6 for all the housing types. This retrofit program requires the highest capital costs to deploy.
Table 7 lists the capital costs required for each retrofit programs of the existing KSA housing stock detailed by type and vintage. As expected, the higher the number of EE measures deployed for each housing unit, the higher are the capital costs for the retrofit programs. Specifically, the capital costs increase from 4.92 billion USD for one EE measure program to 30.39 billion USD for five EE measure program. The old vintages for all the housing types require the most capitals for any retrofit program.
Figure 14 shows the impact of the three retrofit programs on the hourly electricity load for the Saudi housing stock during a winter week(Fig. 14a) and a summer week (Fig. 14b). As clearly indicated in Fig. 14, the electrical load decreases as the number of EE measures considered to retrofit the housing stock increases during both winter and summer. Specifically, Fig. 14a indicates that the electricity profiles during the winter are irregular for all scenarios with several peaks associated with the use of electrical heating especially during nighttime periods in some regions as well as cooling during daytime hours in other regions. However, the daily load profiles during the summer illustrated by Fig. 14b are rather regular with clear daily peaks when the air conditioning demands are high during early afternoon hours throughout KSA. Figure 15 compares hourly electrical profiles for the Saudi housing stock during the entire year shown in the form of time series (Fig. 15a) and of load duration curves (Fig. 15b) associated with the three retrofit programs as well as the baseline case. As expected, the evaluated retrofit programs reduce both peak demand and annual energy consumption attributed to the Saudi housing stock. This reduction increases as the retrofit program include more EE measures.

Hourly variations for electrical load of Saudi housing stock during a a winter week (January 15–22) and b a summer week (July 15–22)

Hourly variation of the electrical loads specific to the Saudi housing stock for three retrofit cases compared to baseline a time series and b load duration curves
Table 8 summarizes the main characteristics of the electrical load profiles specific to the baseline and the three retrofit programs when deployed to the entire Saudi housing stock. As expected, the peak demand and the average annual consumption become lower as the retrofit level is more aggressive. For instance, the reduction in peak demand increases from 17.2% for one EE measure retrofit program (i.e., EEM-1) to 56.3% for five measure retrofit program (i.e., EEM-5). Similar orders of magnitude reductions are achieved for the annual electricity consumption for all the retrofit programs as indicated by the unchanged load factors. The gaps between the peak and base demands become narrow due to the implementation of more aggressive retrofit programs resulting in a flattening of the load curve, a desired outcome for the electrical grid system. Moreover, Table 8 indicates that the number of hours when the load is above 95% of the peak demand becomes lower as a more aggressive retrofit program is considered for the housing stock shortening the period for using peak demand generation plants.
Impact of rooftop PV installations on overall housing stock
Based on the available roof areas for various building types and vintages specific to the existing Saudi housing stock, rooftop PV capacities that could be installed are summarized in Table 9 for various KSA regions. In particular, the total PV capacity potentially available for deployment on Saudi housing rooftop is estimated to be 20.9 GW with almost 50% located on top of villas. Based on the installation cost of 3000 USD/kW, the total capital costs for the PV systems are estimated to be 62.75 billion USD, more than double the cost of retrofitting all the Saudi housing stock using five EE measure packages (i.e., EEM-5 program).
The recently approved net-metering program for deploying small PV systems has limited national capacity of 1.8 GW, or roughly 10% of the potential rooftop PV capacity available from the existing housing stock (SEC, 2020). The plan is to increase the cap of small PV installations after the initial rollout of the initiative. Figure 16 illustrates the hourly electricity load for Saudi housing stock during a winter week (Fig. 16a) and a summer week (Fig. 16b) for the baseline and three rooftop PV adoption levels including 100%, 50%, and 10% of the total available roof area. As expected, the impact of the rooftop PV on the electrical load profile is more evident as the adoption level increases. For both winter and summer days, the rooftop PV systems generate electricity and ultimately reduce the housing stock load only during the mid-day periods (i.e., 10 am through 3 pm). These periods coincide mostly with low energy demand hours during winter days as illustrated in Fig. 16a. For the summer seasons, the power generated by the rooftop PV systems while reducing the energy use during the mid-day period, it does not significantly lower the peak demand levels occurring mostly during late afternoon hours as clearly shown in Fig. 16b. Figure 17 outlines the impact of the rooftop PV systems on the entire housing stock hourly electrical load profiles for three PV adoption levels. Based on the load duration curves of Fig. 17, it is clear that even with 100% penetration, the PV systems do not reduce the peak demand significantly when compared to the retrofit programs as discussed in the “Impact of large-scale energy retrofit programs” section. Table 10 summarizes the main characteristics of Saudi housing electrical profiles specific to the baseline and the three PV adoption levels. Table 10 confirms that the rooftop PV systems not only do not reduce peak demand substantially but also decrease the load factor by increasing the difference between the baseload and the peak demand and limit the hours for DSM interventions to reduce the peak demand by 5% or 10%. Indeed, even with 100% rooftop penetration, the peak demand is reduced by 7.7%, while the annual electricity consumption is decreased by 27.2%. Both reductions are lower than the levels obtained by the EEM-3 retrofit program (refer to Table 8) that requires 25% less capital costs to implement.

Hourly variation for electrical load of Saudi housing stock specific to the three PV adoption levels during a a winter week (January 15–22) and b a summer week (July 15–22)

Electrical load duration curves specific to the Saudi housing stock for the baseline case and three rooftop PV adoption scenarios
Cost benefit analysis
As indicated by the analysis results of the “Results and discussion” section, the impacts of the retrofit programs are generally more significant on both energy use and peak demand reductions than any rooftop PV adoption level. In this section, a cost-effectiveness analysis for both EE and PV programs is conducted to determine their economic benefits considering the capital costs required for their deployment. The production cost for the electricity of 0.10 USD/kWh reported for Saudi Arabia is considered in this analysis to estimate the simple payback periods for various EE retrofitting and rooftop PV deployment programs (Krarti et al., 2017, 2020). The capital costs listed in Table 7 are used for the retrofit programs, while the deployment costs for the rooftop PV systems are estimated based on the capacities listed in Table 9 and 3000 USD/kW of installation cost. Figure 18 summarizes both energy and economic indicators for the six programs considered in this study including:
-
Percent savings of peak demand vs. savings of annual energy use (Fig. 18a): the peak demand as well as annual energy use savings from the retrofit programs vary from 17.2 (EEM-1) to 56.3% (EEM-5). The peak demand savings associated with rooftop PV systems are only 0.6% (PV-10%) and 7.7% (PV-100%).
-
Simple payback period vs. annual energy use savings (Fig. 18b): the retrofit programs have payback periods ranging from 2.3 (EEM-1) to 4.2 years (EEM-5), while the rooftop PV systems need significantly longer periods to recover the installation costs varying from 16.3 (PV-10%) to 17.7 years (PV-100%).
-
Cost of saved peak demand vs. cost of saved annual energy use (Fig. 18c): the cost of saved unit of annual energy use is estimated to vary from 0.23 (EEM-1) to 0.43 USD/kWh/year (EEM-3) for the retrofit programs but jumps to 16.3 USD/kWh/year (PV-10%) and 17.7 USD/kWh/year (PV-100%).
-
Cost of saved peak demand vs. annual energy use savings (Fig. 18d): the cost of saved peak demand ranges from 780 (EEM-1) to 1473 USD/kW (EEM-5) for retrofit programs, significantly lower than that those obtained for the rooftop PV systems estimated to be 29,186 USD/kW (PV-10%) and 22,711 USD/kW (PV-100%).

Comparative analysis for the impacts of retrofit programs and PV adoption levels on energy consumption, peak demand, and cost benefits for the Saudi housing stock
When the actual electricity price paid by the households is considered in the analysis (lower than the production cost), the simple payback periods for both EE and PV programs become longer albeit slightly after the recent energy price reforms (APICORP, 2018; ; Gonand et al., 2019; SEC, 2020). However, additional cost benefits can be achieved for all evaluated programs from the Saudi government perspective if other benefits are included such reduction construction costs associated with elimination of some future power plants as well as lower carbon emissions (Krarti et al., 2017).
The results of Fig. 18 confirm that large-scale retrofit programs are highly effective when compared to rooftop PV installations to reduce both peak demand and annual energy consumption of the existing Saudi housing stock. In addition to their lower capital costs, the main advantage of the retrofit programs compared to rooftop PV systems consists of their ability to provide reduction in electricity demand when is needed, that is, during periods when the consumption is highest as illustrated in Fig. 19 for a typical summer day. Specifically, Fig. 19 shows the hourly electricity saved by the three retrofit programs as well as the hourly electricity generated by three PV systems for July 15. The retrofit programs have reduced peak energy demands during late afternoon hours (i.e., 4 pm to 6 pm) when the air conditioning load of the housing stock is at the highest. Effectively, the retrofit programs act as generators that provide power throughout the day with peak output coinciding with the housing stock peak demand, while the PV systems produce power only during daytime with their highest output occurring too early in the day (i.e., around 1 pm) to offer any significant assistance to reduce peak demand. Figure 20 compares the annual hourly profiles for energy saved/generated by the retrofit programs and PV systems. It is clear that the rooftop PV systems do not generate any electricity for almost half of the year unlike the case of the retrofit programs that are able to provide (i.e., save) electricity during all hours of the year including and most importantly during peak demand hours.

Comparative hourly profiles of energy saved by retrofit programs and electricity generated by the PV systems during July 15 deployed for the Saudi housing stock

Comparative hourly profiles of energy saved by retrofit programs and electricity generated by the PV systems during 1 year deployed for the Saudi housing stock
Summary and conclusions
A new analysis framework using the sequential search optimization technique is introduced in this study to identify targeted energy efficiency programs that provide the most cost-effective path to reduce electrical peak demand while decreasing annual energy consumption for entire building stocks. The method has been applied to develop cost-effective retrofit programs suitable for large-scale deployment to improve the ability of residential building stocks to reduce peak demand on the electrical grid. In particular, the optimized retrofit programs provide specific energy efficiency (EE) measures and rooftop PV capacities recommended for each housing prototype of existing building stock representing various types, vintages, and locations within Saudi Arabia.
The analysis results indicate that for Saudi Arabia, EE measures instead of rooftop PV deployments present the most effective retrofit programs to reduce peak demand as well as annual energy consumption for the existing housing stocks. When applied to individual buildings, the optimization approach shows that the cost of reducing peak demand for any level of energy use savings is lower for old vintages compared to new vintages of any housing type. For instance, a 40% reduction in the annual energy consumption for an old traditional house requires 1000 USD per kW of peak demand reduction. The same EE level needs an investment of 2000 USD/kW for the new traditional house prototype.
A comparative analysis of the benefits of both large-scale EE programs and rooftop PV deployments, the optimization indicates that retrofit policies and programs are highly cost-effective and significantly more adequate than PV systems to reduce peak demands specific to Saudi housing stock. Specifically, the analysis shows that retrofitting the housing stock with just implementing one EE measure reduces the peak demand by 6.3 GW, that is, more than double the effect of installing PV systems on all available residential roof areas at a significantly lower costs (i.e., 4.9 USD billion vs. 62.75 USD billion). Therefore, the peak demand reduction associated with one EE measure retrofit program costs 779 USD/kW substantially lower than 22,710 USD/kW effectively estimated for the 100% rooftop PV systems.
The optimization analysis framework presented in this paper provides an effective approach to identify and design targeted large-scale energy programs that utilities and policy makers can deploy to reduce not only energy consumption of existing building stocks but also lower their electrical peak demand cost-effectively.
Change history
01 March 2023
A Correction to this paper has been published: https://doi.org/10.1007/s12053-023-10098-5
Abbreviations
- COA:
-
Central Operating Area for the Saudi electricity grid
- DR:
-
Demand response
- DSM:
-
Demand Side Management
- EE:
-
Energy efficiency
- EER:
-
Energy efficiency ratio
- EEM:
-
Energy efficiency measure
- EOA:
-
Eastern Operating Area for the Saudi electricity grid
- ESCO:
-
Energy Service Company
- GSTAT:
-
General Authority for Statistics
- HVAC:
-
Heating, ventilating, and air conditioning
- KSA:
-
Kingdom of Saudi Arabia
- LED:
-
Light-emitting diode
- LCC:
-
Life cycle cost
- PV:
-
Photovoltaic
- RE:
-
Renewable energy
- RTP:
-
Real-time pricing
- SAMA:
-
Saudi Arabian Monetary Authority
- SAR:
-
Saudi Arabian riyal
- SEC:
-
Saudi Electricity Company
- SR:
-
Solar reflectance
- SOA:
-
Southern Operating Area for the Saudi electricity grid
- TOU:
-
Time-of-use
- USD:
-
US dollar
- WOA:
-
Western Operating Area for the Saudi electricity grid
- \({A}_{c,v,l}\) :
-
Floor area of all housing units specific to a combination of category, vintage, and location (m2)
- \({C}_{d}\) :
-
Cost of demand reduction (USD/kW)
- \({C}_{EE}\) :
-
Cost for a set of EE/RE measures (USD)
- \({f}_{c,v,l}\) :
-
Fraction of housing units that belong to a set of category, vintage, and location
- \({E}_{b,i}\) :
-
Baseline electricity demand for at time step i (kW)
- \({\mathrm{E}}_{\mathrm{EE},\mathrm{i}}\) :
-
Electricity demand for the time step i after implementation of a set of EE/RE measures (kW)
- \({\mathrm{EC}}_{\mathrm{s}}\left(t\right)\) :
-
Electricity demand for the building stock at the time t (kW)
- \({EUI}_{c,v,l}\left(t\right)\) :
-
The energy use per unit area during the time for the housing unit that represents a specific category, vintage, and location
- ΔE :
-
Annual savings of electricity consumption (kWh/year)
References
Alaidroos, A., Krarti, M., & M.,. (2015). Optimal design of residential building envelope systems in the Kingdom of Saudi Arabia. Energy and Buildings, 86, 104–117.
Alasseri, R., Tripathi, A., Joji Rao, T., & Sreekanth, K. J. (2017). A review on implementation strategies for demand side management (DSM) in Kuwait through incentive-based demand response programs. Renewable Sustainable Energy Reviews, 77, 617–635.
Alimohammadisagvand, B., Jokisalo, J., Kilpeläinen, S., Ali, M., & Siren, K. (2016). Cost-optimal thermal energy storage system for a residential building with heat pump heating and demand response control. Applied Energy, 174, 275–287. https://doi.org/10.1016/j.apenergy.2016.04.013
APICORP (2018). Saudi Power Sector: Reforms underway, APICORP Energy Resources, 3, 1–4. http://www.apicorparabia.com/Research/EnergyReseach/2018/APICORP_Energy_Research_V03_N13_2018.pdf. Accessed 10 Feb 2021.
Arabzadeh, V., Alimohammadisagvand, B., Jokisalo, J., & Siren, K. (2018). A novel cost-optimizing demand response control for a heat pump heated residential building. Building Simulation, 11, 533–547.
Bahl, B., Lampe, M., Voll, P., & Bardow, A. (2017). Optimization-based identification and quantification of demand-side management potential for distributed energy supply systems. Energy, 135, 889–899.
Barber, K. A., & Moncef Krarti, M. (2022). A review of optimization based tools for design and control of building energy systems. Renewable and Sustainable Energy Reviews, 160, 112359.
Behboodi, S., Chassin, D. P., Crawford, C., & Djilali, N. (2016). Renewable resources portfolio optimization in the presence of demand response. Applied Energy, 162, 139–148.
Behrangrad, M. (2015). A review of demand side management business models in the electricity market. Renewable and Sustainable Energy Reviews, 47, 270–283.
Bergaentzlé, C., Clastres, C., & Khalfallay, H. (2014). Demand-side management and European environmental and energy goals: An optimal complementary approach. Energy Policy, 67, 858–869.
Bradley, P., Leach, M., & Torriti, J. (2013). A review of the costs and benefits of demand response for electricity in the UK. Energy Policy, 52, 312–327.
Christensen, C., Barker,G., and Horowitz, S., (2004). A sequential search technique for identifying optimal building designs on the path to zero net energy. Proceedings of the Solar 2004, Portland, OR: American Solar Energy Society.
Deneuville, J., & Krarti, M. (2015). Comparative evaluation of optimal energy efficiency designs for French and US office buildings. Energy and Buildings, 93, 332–344.
Dileep, G. (2020). A survey on smart grid technologies and applications. Renewable Energy, 146, 2589–2625.
Dortans, C., Jack, M. W., Anderson, B., & Stephenson, J. (2020). Lightening the load: Quantifying the potential for energy-efficient lighting to reduce peaks in electricity demand. Energy Efficiency, 13, 1105–1118.
ECRA (2020a). Small-scale solar PV systems regulations, ERD - TA – 012 (V02/19), Electricity and Cogeneration Regulatory Authority, Riyadh, Saudi Arabia.
ECRA (2020b). Data and statistics, Electricity and Cogeneration Regulatory Authority, Riyadh, Saudi Arabia https://ecra.gov.sa/en-us/dataandstatistics/pages/DataAndStatistics.aspx. Accessed 27 Jan 2021.
EIA (2019). Electric Power Annual 2018, report by US Energy Information Agency, Washington, DC. https://www.eia.gov/electricity/annual/pdf/epa.pdf. Accessed 5 Feb 2021.
Eissa, M. M. (2011). Demand side management program evaluation based on industrial and commercial field data. Energy Policy, 39, 5961–5969.
EPA (2010). Coordination of energy efficiency and demand response, a Resource for the National Action Plan for Energy Efficiency, Report for US Environmental Protection Agency, Washington DC. https://www.epa.gov/sites/production/files/2015-08/documents/ee_and_dr.pdf. Accessed 15 Feb 2021.
Fattahi, M. A., & Deihimi, M. H. (2017). A review of demand-side management: Reconsidering theoretical framework. Renewable and Sustainable Energy Reviews, 80, 367–379.
FERC (2019). 2019 Assessment of demand response and advanced metering, Federal Energy Regulatory Commission, Washington, DC. https://www.ferc.gov/legal/staff-reports/2019/DR-AM-Report2019.pdf. Accessed 12 Feb 2021.
Ferrara, M., Monetti, V., & Fabrizio, E. (2018). Cost-optimal analysis for nearly zero energy buildings design and optimization: A critical review. Energies, 11(6), 1478.
Frick N.M, Hoffman I.M., Goldman C.A., Leventis G., Murphy S., and Schwartz L.C., (2019). Peak demand impacts from electricity efficiency programs, Lawrence Berkeley National Laboratory, Berkeley, CA. https://eta-publications.lbl.gov/sites/default/files/cost_of_saving_peak_demand_20191106_final.pdf. Accessed 25 Jan 2021.
GAStat (2018). Housing Survey Data, General Authority for Statistics, Riyadh, Kingdom of Saudi Arabia. Accessed December 25, 2018. http://www.stats.gov.sa.
Gelazanskas, L., & Gamage, K. A. A. (2014). Demand side management in smart grid: A review and proposals for future direction. Sustainable Cities and Society, 11, 22–30.
Gellings C.W. (1996). Then and now: The perspective of the man who coined the term ‘DSM’, Energy Policy, 24 (4), 285-288
Gonand, F., Hasanov, F. J., & Hunt, L. C. (2019). Estimating the impact of energy price reform on Saudi Arabian Intergenerational Welfare using the MEGIR-SA model. Energy Journal, 4(3), 101–123.
Griego, D., Krarti, M., & Hernandez-Guerrero, A. (2015). Energy efficiency optimization of new and existing office buildings in Guanajuato. Mexico, Sustainable Cities and Society, 17, 132–140.
Harish, V. S. K. V., & Kumar, A. (2014). Demand side management in India: Action plan, policies and regulations. Renewable and Sustainable Energy Reviews, 33, 613–624.
IEA (2019). Multiple benefits of energy efficiency, Report by the International Energy Agency, Paris, France.
Ihm, P., & Krarti, M. (2012). Design optimization of energy efficient residential buildings in Tunisia. Building and Environment, 58(12), 81–90.
Ikpe, E., & Torriti, J. (2018). A means to an industrialisation end? Demand Side Management in Nigeria, Energy Policy., 115, 207–215.
Khan, I. (2019). Energy-saving behaviour as a demand-side management strategy in the developing world: The case of Bangladesh. International Journal for Energy and Environmental Engineering, 10, 493–510.
Krarti, M. (2012). Weatherization of residential buildings, textbook. Taylor and Francis Publishing.
Krarti, M. (2015). Evaluation of large scale building energy efficiency retrofit program in Kuwait. Renewable and Sustainable Energy Reviews, 50, 1069–1080.
Krarti, M. (2018). Optimal design and retrofit of energy efficient buildings, communities, and urban centers. Butterworth-Heinemann.
Krarti, M., Dubey, K., & Howarth, N. (2017). Evaluation of building energy efficiency investment options for the Kingdom of Saudi Arabia. Energy, 134, 595–610.
Krarti, M., Dubey, K., & Howarth, N. (2019). Energy productivity analysis framework for buildings: A case study of GCC region. Energy, 167, 1251–1265.
Krarti, M., Aldubyan, M., & Willams, E. (2020). Residential building stock model for evaluating energy retrofit programs in Saudi Arabia. Energy, 195, 116980.
Lovins, A. (1990). The negawatt revolution. Across the Board, 27(9), 21–22.
Lu, Y., Wang, S., & Shan, K. (2015). Design optimization and optimal control of grid-connected and standalone nearly/net zero energy buildings. Applied Energy, 155, 463–477.
Makhadmeh, S. N., Khader, A. T., Al-Betar, M. A., Naim, S., Abasi, A. K., & Alyasseri, Z. A. A. (2019). Optimization methods for power scheduling problems in smart home: Survey. Renewable and Sustainable Energy Reviews, 115, 109362.
McNeil, M. A., Karali, N., & Letschert, V. (2019). Forecasting Indonesia’s electricity load through 2030 and peak demand reductions from appliance and lighting efficiency. Energy for Sustainable Development, 49, 65–77.
Ming, Z., Song, X., Mingjuan, M., Lingyun, L., Min, C., & Yuejin, W. (2013). Historical review of demand side management in China: Management content, operation mode, results assessment and relative incentives. Renewable and Sustainable Energy Reviews, 25, 470–482.
Navigant (2019). Demand side management overview: Energy efficiency and demand response market analysis and forecasts: 2019–2028, Navigant Research (now Guidehouse Insights), Boulder, CO.
PJM market (2020). Reliability pricing model demand response and energy efficiency, http://www.pjm.com/~/media/markets-ops/rpm/20090406-dr-ee-in-rpm-collateral.ashx. Accessed 20 Jan 2021.
Russell, C., Baatz, B., Cluett, R., & Amann, J. (2015). Recognizing the value of energy efficiency’s multiple benefits. American Council for an Energy-Efficient Economy.
SAMA (2019). Economic Reports and Statistics, Saudi Arabian Monetary Authority, Yearly Statistics. http://www.sama.gov.sa/en-US/EconomicReports/Pages/YearlyStatistics.aspx. Accessed 12 Jan 2021.
Sarker, E., Halder, P., Seyedmahmoudian, M., Jamei, E., Horan, B., Mekhilef, S., & Stojcevski, A. (2021). Progress on the demand side management in smart grid and optimization approaches. International Journal of Energy Research, 45, 36–64.
SEC (2020). New electricity consumption tariffs, Saudi Electricity Company, Riyadh, Saudi Arabia, https://www.se.com.sa/en-us/customers/Pages/TariffRates.aspx. Accessed 27 Jan 2021.
Sehar, F., Pipattanasomporn, M., & Rahman, S. (2016). A peak-load reduction computing tool sensitive to commercial building environmental preferences. Applied Energy, 146, 279–289.
Strbac, G. (2008). Demand side management: Benefits and challenges. Energy Policy, 36(12), 4419–4426.
Tuhus-Dubrow, D., & Krarti, M. (2009). Comparative analysis of optimization approaches to design building envelope for residential buildings. ASHRAE Transactions, 115(2), 205–219.
Warren, P. (2014). A review of demand-side management policy in the UK. Renewable and Sustainable Energy Reviews, 29, 941–951.
Warren, P. (2018). Demand-side policy: Global evidence base and implementation patterns. Energy and Environment, 29(5), 706–731.
Wells, L., Rismanchi, B., & Aye, L. (2018). A review of Net Zero Energy Buildings with reflections on the Australian context. Energy and Buildings, 158, 616–628.
WGBC (2013). The business case for green buildings: A review of the costs and benefits for developers, investors and occupants, a report by World Green Building Council, http://www.worldgbc.org. Accessed 5 Feb 2021.
Author information
Authors and Affiliations
Corresponding author
Ethics declarations
Conflict of interest
The authors declare no competing interests.
Additional information
Publisher's note
Springer Nature remains neutral with regard to jurisdictional claims in published maps and institutional affiliations.
The original online version of this article was revised due to a retrospective Open Access order.
Rights and permissions
Open Access This article is licensed under a Creative Commons Attribution 4.0 International License, which permits use, sharing, adaptation, distribution and reproduction in any medium or format, as long as you give appropriate credit to the original author(s) and the source, provide a link to the Creative Commons licence, and indicate if changes were made. The images or other third party material in this article are included in the article's Creative Commons licence, unless indicated otherwise in a credit line to the material. If material is not included in the article's Creative Commons licence and your intended use is not permitted by statutory regulation or exceeds the permitted use, you will need to obtain permission directly from the copyright holder. To view a copy of this licence, visit http://creativecommons.org/licenses/by/4.0/.
About this article

Cite this article
Krarti, M., Aldubyan, M. Peak demand-based optimization approach for building retrofits: case study of Saudi residential buildings. Energy Efficiency 15, 69 (2022). https://doi.org/10.1007/s12053-022-10077-2
Received:
Accepted:
Published:
DOI: https://doi.org/10.1007/s12053-022-10077-2