
Abstract
Assessing the sustainability efficiency of a supply chain network (SCN) is a complex issue due to the inherent conflict of interest among components. In these systems, there are two levels of conflict of interest: on the one hand, network players, including suppliers, manufacturers, retailers, etc., have conflicting interests. On the other hand, the three sustainability goals, namely economic, social and environmental, are not in line with each other. Improvement in one of these goals is not possible while keeping the others constant. Using hybrid models of game network data envelopment analysis (GNDEA), this study presented a new framework to measure an Iranian pharmaceutical company’s supply chain network sustainability efficiency (SCNSE). This was done considering two levels of conflict of interest simultaneously, which is the main contribution of this study. The proposed model also measures the performance of components and the entire network in all three dimensions of sustainability. It enables managers to gain a better insight into the sustainability efficiency of an SCN and its individual components. Acquiring this knowledge allows managers to identify system weaknesses and design more effective improvement plans. Future studies can develop models for appraising the sustainability efficiency of an SCN under uncertain conditions considering different players.


References
Sarkis J 2020 Supply chain sustainability: learning from the COVID-19 pandemic. Int. J. Oper. Prod. Manag. 41: 63–73
Wang X C, Jiang P, Yang L, Van Fan Y, Klemeš J J and Wang Y 2021 Extended water-energy nexus contribution to environmentally-related sustainable development goals. Renew. Sustain. Energy Rev. 150: 111485
Balfaqih H, Nopiah Z M, Saibani N and Al-Nory M T 2016 Review of supply chain performance measurement systems: 1998–2015. Comput. Ind. 82: 135–150
Matos S V, Schleper M C, Gold S and Hall J K 2020 The hidden side of sustainable operations and supply chain management: unanticipated outcomes, trade-offs and tensions. Int. J. Oper. Prod. Manag. 40: 1749–1770
Tajbakhsh A and Hassini E 2015 Performance measurement of sustainable supply chains: a review and research questions. Int. J. Product. Perform. 64: 744–783
Chen C and Yan H 2011 Network DEA model for supply chain performance evaluation. Eur. J. Oper. 213: 147–155
Chen Y, Liang L and Yang F 2006 A DEA game model approach to supply chain efficiency. Ann. Oper. Res. 145: 5–13
Varsei M and Polyakovskiy S 2017 Sustainable supply chain network design: a case of the wine industry in Australia. Omega 66: 236–247
Noveiri M J S, Kordrostami S and Amirteimoori A 2022 Performance analysis of sustainable supply networks with bounded, discrete, and joint factors. Environ. Dev. Sustain. 24: 238–270
Boz I 2020 Measuring environmental, economic, and social sustainability index of tea farms in Rize Province, Turkey. Environ. Dev. Sustain. 22: 2545–2567
Lee K H and Saen R F 2012 Measuring corporate sustainability management: a data envelopment analysis approach. Int. J. Prod. Econ. 140: 219–226
Tajbakhsh A and Hassini E 2015 A data envelopment analysis approach to evaluate sustainability in supply chain networks. J. Clean. Prod. 105: 74–85
Ka J M R, Ab N R and Lb K 2019 A review on supply chain performance measurement systems. Procedia Manuf. 30: 40–47
Kao C 2014 Network data envelopment analysis: a review. Eur. J. Oper. 239: 1–16
Acquaye A, Ibn-Mohammed T, Genovese A, Afrifa G A, Yamoah F A and Oppon E 2018 A quantitative model for environmentally sustainable supply chain performance measurement. Eur. J. Oper. 269: 188–205
Govindan K, Rajeev A, Padhi S S and Pati R K 2020 Supply chain sustainability and performance of firms: a meta-analysis of the literature. Transport Res. E-Log. 137: 101923
Zhang Q, Shah N, Wassick J, Helling R and Van Egerschot P 2014 Sustainable supply chain optimisation: an industrial case study. Comput. Ind. Eng. 74: 68–83
Sittisak P and Ekasingh B 2015 Trade-offs between the economic, social and environmental objectives in optimal resource management in the fang watershed, Chiang Mai Province, Thailand. Agric. Agric. Sci. Procedia 5: 38–45
Huo B, Gu M and Wang Z 2019 Green or lean? A supply chain approach to sustainable performance. J. Clean. Prod. 216: 152–166
Haffar M and Searcy C 2019 How organizational logics shape trade-off decision-making in sustainability. Long Range Plann. 52: 101912
Liang L, Yang F, Cook W D and Zhu J 2006 DEA models for supply chain efficiency evaluation. Ann. Oper. Res. 145: 35–49
Li H, Chen C, Cook W D, Zhang J and Zhu J 2018 Two-stage network DEA: Who is the leader? Omega 74: 15–19
Esfandiari M, Hafezalkotob A, Khalili-Damghani K and Amirkhan M 2017 Robust two-stage DEA models under discrete uncertain data. Int. J. Manag. Sci. 12: 216–224
Khodakarami M, Shabani A, Saen R F and Azadi M 2015 Developing distinctive two-stage data envelopment analysis models: an application in evaluating the sustainability of supply chain management. Measurement 70: 62–74
Jauhar S K, Pant M and Nagar A K 2017 Sustainable educational supply chain performance measurement through DEA and differential evolution: a case on Indian HEI. J. Comput. Sci. 19: 138–152
Haghighi S M, Torabi S and Ghasemi R 2016 An integrated approach for performance evaluation in sustainable supply chain networks (with a case study). J. Clean. Prod. 137: 579–597
Badiezadeh T, Saen R F and Samavati T 2018 Assessing sustainability of supply chains by double frontier network DEA: a big data approach. Comput. Oper. Res. 98: 284–290
Ramezankhani M J, Torabi S A and Vahidi F 2018 Supply chain performance measurement and evaluation: a mixed sustainability and resilience approach. Comput. Ind. Eng. 126: 531–548
Tajbakhsh A and Hassini E 2018 Evaluating sustainability performance in fossil-fuel power plants using a two-stage data envelopment analysis. Energy Econ. 74: 154–178
Gong Y, Liu J and Zhu J 2019 When to increase firms’ sustainable operations for efficiency? A data envelopment analysis in the retailing industry. Eur. J. Oper. 277: 1010–1026
De D, Chowdhury S, Dey P K and Ghosh S K 2020 Impact of lean and sustainability oriented innovation on sustainability performance of small and medium sized enterprises: a data envelopment analysis-based framework. Int. J. Prod. Econ. 219: 416–430
Wang H, Pan C, Wang Q and Zhou P 2020 Assessing sustainability performance of global supply chains: an input–output modeling approach. Eur. J. Oper. 285: 393–404
Jomthanachai S, Wong W P and Lim C P 2021 A coherent data envelopment analysis to evaluate the efficiency of sustainable supply chains. IEEE Trans. Eng. Manag. https://doi.org/10.1109/TEM.2020.3046485
Amirkhan M, Didehkhani H, Khalili-Damghani K and Hafezalkotob A 2018 Measuring performance of a three-stage network structure using data envelopment analysis and Nash bargaining game: a supply chain application. Int. J. Inf. Technol. Decis. Mak. 17: 1429–1467
Khalili-Damghani K and Taghavifard M 2012 A three-stage fuzzy DEA approach to measure the performance of a serial process including JIT practices, agility indices, and goals in supply chains. Int. J. Serv. Ind. Manag. 13: 147–188
Zhou Z, Sun L, Yang W, Liu W and Ma C 2013 A bargaining game model for efficiency decomposition in the centralized model of two-stage systems. Comput. Ind. Eng. 64: 103–108
Linton J D, Klassen R and Jayaraman V 2007 Sustainable supply chains: an introduction. J. Oper. Manag. 25: 1075–1082
Jørgensen T H 2008 Towards more sustainable management systems: through life cycle management and integration. J. Clean. Prod. 16: 1071–1080
Veleva V and Ellenbecker M 2001 Indicators of sustainable production: framework and methodology. J. Clean. Prod. 9: 519–549
Morhardt J E, Baird S and Freeman K 2002 Scoring corporate environmental and sustainability reports using GRI 2000, ISO 14031 and other criteria. Corp. Soc. Responsib. 9: 215–233
Author information
Authors and Affiliations
Corresponding author
Appendices
Appendix A
Lemma 1
The feasible set S is compact and convex.
Proof 1
Since feasible set S is defined in a Euclidean space, the compactness condition has been met. To prove that the solution space is convex, assume:
According to this assumption and for each \(\lambda \in \left[ {0,1} \right]\) there is:
Therefore, based on the above assumptions, the feasible set is compact. Thus, in model (2) for the first constraint, there is:
Similarly, for the second and third constraints, there is:
For the fourth, fifth, and sixth constraints, there are:
And for the last constraint, there is:
Therefore, for every \((d2 = 1,\ldots ,D2 )\), \((d3 = 1,\ldots ,D3 )\), \((d4 = 1,\ldots ,D4 )\),\((i = 1,\ldots ,m)\), there is:
which is equal to:
Hence, the feasible set S is convex.
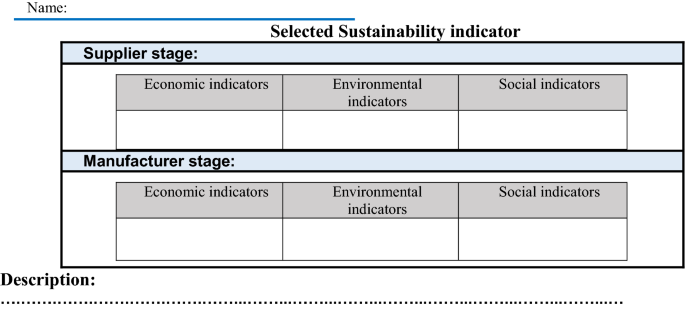
Appendix B Indicator selection survey questionnaire
2.1 Introduction
Thank you for agreeing to help us use your experience to select proper measures for the supply chain sustainability of the company. As you know, we are evaluating the sustainability efficiency of your company’s supply chain with a focus on supplier and manufacturer stages to determine the current status and see if we can Identify improvement initiatives. For this purpose, we have provided an attachment, which is the list of measures that have been collected through the literature review.
Please answer the following questions by writing your answer in your own words in the box provided. If you have any questions about this questionnaire, don’t hesitate to contact us.
Name: | |
|---|---|
Department: | Job position: |
Date of employment: | Total work experience: |
Highest education certification: | Field of Study: |
2.2 Directions
-
1.
Please indicate four questions as below:
-
Q1: Is the indicator aligned with goals and strategies?
-
Q2: Does the indicator have computational complexity?
-
Q3: Is the indicator actionable?
-
Q4: Is there reliable data to calculate the indicator?
-
-
2.
Please select at least ten measures in each stage of the supply chain
-
3.
Please sort them by priority and Note in the table below:

Appendix C Table of the results
3.1 Results of SCN sustainability efficiency
DMU | The first scenario (cooperative model) | The second scenario (non-cooperative model) | ||||||||||||||||
|---|---|---|---|---|---|---|---|---|---|---|---|---|---|---|---|---|---|---|
\(\theta_{o}^{OC}\) | \(\theta_{o}^{{Sup* }}\) | \(\theta_{o}^{{Man* }}\) | \(\theta_{o}^{{Ec1 }}\) | \(\theta_{o}^{{En1 }}\) | \(\theta_{o}^{{So1 }}\) | \(\theta_{o}^{{Ec2 }}\) | \(\theta_{o}^{{En2 }}\) | \(\theta_{o}^{{So2 }}\) | \(\theta_{o}^{ON}\) | \(\theta_{o}^{{Sup* }}\) | \(\theta_{o}^{{Man* }}\) | \(\theta_{o}^{{En1 }}\) | \(\theta_{o}^{{So1 }}\) | \(\theta_{o}^{{Ec2 }}\) | \(\theta_{o}^{{En2 }}\) | \(\theta_{o}^{{So2 }}\) | \(\theta_{o}^{{En1 }}\) | |
1 | 0.89 | 0.42 | 1.00 | 0.46 | 0.40 | 0.40 | 0.60 | 0.51 | 1.00 | 1.0 | 1.0 | 1.0 | 1.00 | 1.00 | 0.64 | 0.24 | 0.47 | 0.99 |
2 | 1.00 | 0.53 | 1.00 | 0.56 | 0.52 | 0.52 | 0.79 | 0.54 | 0.99 | 0.9 | 0.8 | 1.0 | 0.72 | 0.71 | 0.82 | 0.87 | 0.50 | 0.98 |
3 | 0.83 | 0.70 | 0.86 | 0.71 | 0.69 | 0.69 | 0.45 | 0.50 | 0.84 | 0.9 | 0.8 | 1.0 | 0.65 | 0.65 | 0.75 | 0.57 | 0.46 | 1.00 |
4 | 0.79 | 0.87 | 0.71 | 0.86 | 0.87 | 0.87 | 0.00 | 0.68 | 0.58 | 1.0 | 1.0 | 1.0 | 0.84 | 0.86 | 0.99 | 0.77 | 0.68 | 0.89 |
5 | 0.82 | 0.81 | 0.78 | 0.80 | 0.81 | 0.81 | 0.19 | 0.79 | 0.55 | 1.0 | 0.9 | 1.0 | 0.77 | 0.79 | 0.91 | 0.00 | 0.91 | 0.61 |
6 | 0.85 | 0.74 | 0.88 | 0.74 | 0.74 | 0.74 | 0.00 | 0.84 | 0.71 | 0.9 | 0.8 | 1.0 | 0.64 | 0.65 | 0.75 | 0.00 | 0.81 | 0.82 |
7 | 0.85 | 0.52 | 0.96 | 0.54 | 0.51 | 0.52 | 0.00 | 0.92 | 0.78 | 0.9 | 0.8 | 1.0 | 0.69 | 0.69 | 0.80 | 0.00 | 0.81 | 0.82 |
8 | 0.86 | 0.83 | 0.73 | 0.83 | 0.83 | 0.83 | 0.01 | 0.70 | 0.59 | 0.9 | 0.9 | 1.0 | 0.72 | 0.73 | 0.85 | 0.37 | 0.67 | 0.82 |
9 | 0.91 | 0.86 | 0.85 | 0.85 | 0.86 | 0.86 | 0.00 | 0.82 | 0.69 | 1.0 | 1.0 | 1.0 | 0.83 | 0.86 | 0.99 | 0.98 | 0.78 | 0.82 |
10 | 0.88 | 0.86 | 0.85 | 0.86 | 0.85 | 0.85 | 0.41 | 0.91 | 0.53 | 1.0 | 1.0 | 1.0 | 0.84 | 0.86 | 0.99 | 0.55 | 0.93 | 0.58 |
11 | 0.86 | 0.62 | 0.97 | 0.63 | 0.61 | 0.62 | 0.00 | 1.00 | 0.66 | 0.9 | 0.8 | 1.0 | 0.71 | 0.72 | 0.83 | 0.00 | 0.86 | 0.72 |
12 | 1.00 | 0.75 | 1.00 | 0.75 | 0.75 | 0.75 | 0.00 | 0.96 | 0.81 | 1.0 | 1.0 | 1.0 | 0.82 | 0.84 | 0.97 | 0.29 | 0.81 | 0.82 |
13 | 1.00 | 0.89 | 0.83 | 0.87 | 0.89 | 0.89 | 0.00 | 0.72 | 0.54 | 1.0 | 1.0 | 1.0 | 0.83 | 0.87 | 1.00 | 0.37 | 0.66 | 0.59 |
14 | 1.00 | 0.74 | 0.95 | 0.73 | 0.74 | 0.74 | 0.00 | 0.60 | 0.83 | 1.0 | 0.9 | 1.0 | 0.79 | 0.82 | 0.94 | 0.00 | 0.55 | 0.91 |
15 | 0.94 | 0.98 | 0.81 | 0.97 | 0.98 | 0.98 | 0.50 | 0.78 | 0.66 | 1.0 | 1.0 | 1.0 | 0.84 | 0.86 | 0.99 | 0.81 | 0.85 | 0.74 |
16 | 1.00 | 1.00 | 0.82 | 0.99 | 1.00 | 1.00 | 0.00 | 0.78 | 0.66 | 1.0 | 1.0 | 1.0 | 0.84 | 0.86 | 0.99 | 0.47 | 0.81 | 0.82 |
17 | 0.95 | 0.72 | 0.97 | 0.73 | 0.72 | 0.72 | 1.00 | 0.49 | 0.72 | 1.0 | 1.0 | 1.0 | 0.84 | 0.86 | 0.99 | 1.00 | 0.45 | 0.79 |
18 | 0.94 | 0.71 | 0.92 | 0.71 | 0.70 | 0.71 | 0.70 | 0.65 | 0.68 | 1.0 | 1.0 | 1.0 | 0.84 | 0.86 | 0.99 | 0.71 | 0.60 | 0.75 |
19 | 0.78 | 0.56 | 0.78 | 0.57 | 0.56 | 0.56 | 0.07 | 0.73 | 0.64 | 0.9 | 0.9 | 1.0 | 0.72 | 0.74 | 0.85 | 0.88 | 0.67 | 0.77 |
20 | 0.94 | 0.77 | 0.82 | 0.76 | 0.77 | 0.77 | 0.21 | 0.84 | 0.57 | 1.0 | 1.0 | 1.0 | 0.83 | 0.86 | 1.00 | 0.02 | 0.87 | 0.62 |
21 | 1.00 | 0.68 | 1.00 | 0.69 | 0.67 | 0.67 | 0.72 | 0.96 | 0.81 | 1.0 | 1.0 | 1.0 | 0.84 | 0.86 | 0.99 | 0.00 | 0.81 | 0.82 |
22 | 0.96 | 0.81 | 0.94 | 0.81 | 0.80 | 0.80 | 0.00 | 0.71 | 0.84 | 1.0 | 1.0 | 1.0 | 0.85 | 0.86 | 0.99 | 0.27 | 0.66 | 0.90 |
23 | 1.00 | 0.70 | 1.00 | 0.71 | 0.70 | 0.70 | 0.00 | 0.67 | 0.87 | 0.9 | 0.8 | 1.0 | 0.71 | 0.72 | 0.83 | 0.00 | 0.61 | 0.92 |
24 | 0.96 | 0.71 | 0.96 | 0.72 | 0.70 | 0.70 | 0.00 | 0.92 | 0.77 | 1.0 | 0.9 | 1.0 | 0.78 | 0.79 | 0.91 | 0.00 | 0.81 | 0.82 |
25 | 0.99 | 0.71 | 0.99 | 0.72 | 0.70 | 0.70 | 0.67 | 0.98 | 0.75 | 1.0 | 0.9 | 1.0 | 0.80 | 0.81 | 0.93 | 0.29 | 0.81 | 0.82 |
26 | 0.96 | 0.61 | 1.00 | 0.61 | 0.60 | 0.61 | 0.10 | 0.96 | 0.81 | 1.0 | 1.0 | 1.0 | 0.81 | 0.84 | 0.97 | 0.55 | 0.81 | 0.82 |
27 | 0.90 | 0.51 | 1.00 | 0.51 | 0.50 | 0.50 | 0.00 | 0.95 | 0.81 | 1.0 | 1.0 | 1.0 | 0.84 | 0.86 | 0.99 | 0.00 | 0.81 | 0.82 |
28 | 0.96 | 0.85 | 0.80 | 0.85 | 0.84 | 0.84 | 0.00 | 0.77 | 0.65 | 1.0 | 1.0 | 1.0 | 0.85 | 0.86 | 0.99 | 0.00 | 0.81 | 0.82 |
29 | 1.00 | 0.70 | 0.91 | 0.72 | 0.69 | 0.69 | 0.00 | 0.94 | 0.63 | 1.0 | 1.0 | 1.0 | 0.85 | 0.85 | 0.98 | 0.24 | 0.87 | 0.68 |
30 | 1.00 | 0.71 | 0.87 | 0.73 | 0.70 | 0.70 | 0.07 | 0.85 | 0.69 | 1.0 | 1.0 | 1.0 | 0.85 | 0.86 | 0.99 | 0.06 | 0.84 | 0.76 |
31 | 1.00 | 0.29 | 0.95 | 0.32 | 0.27 | 0.28 | 0.57 | 0.91 | 0.77 | 1.0 | 1.0 | 1.0 | 0.85 | 0.86 | 0.99 | 0.59 | 0.81 | 0.82 |
32 | 1.00 | 0.70 | 0.86 | 0.70 | 0.69 | 0.69 | 0.14 | 0.86 | 0.63 | 1.0 | 0.9 | 1.0 | 0.79 | 0.80 | 0.93 | 0.72 | 0.87 | 0.69 |
33 | 1.00 | 0.65 | 0.93 | 0.65 | 0.64 | 0.64 | 0.01 | 0.89 | 0.75 | 1.0 | 0.9 | 1.0 | 0.79 | 0.81 | 0.93 | 0.00 | 0.81 | 0.82 |
34 | 0.99 | 0.62 | 0.90 | 0.64 | 0.61 | 0.61 | 0.13 | 0.79 | 0.76 | 1.0 | 1.0 | 1.0 | 0.85 | 0.86 | 0.99 | 0.37 | 0.72 | 0.86 |
35 | 1.00 | 1.00 | 0.64 | 1.00 | 0.99 | 1.00 | 0.02 | 0.68 | 0.40 | 1.0 | 1.0 | 1.0 | 0.85 | 0.85 | 0.99 | 0.21 | 1.00 | 0.44 |
Rights and permissions
About this article

Cite this article
Yaghoubizadeh Vanini, M., Yousefi Zenouz, R., Abtahi, AR. et al. A study into the sustainability efficiency of supply chain network based on economic, social, and environmental trade-offs. Sādhanā 47, 156 (2022). https://doi.org/10.1007/s12046-022-01927-x
Received:
Revised:
Accepted:
Published:
DOI: https://doi.org/10.1007/s12046-022-01927-x