
Abstract
Alzheimer’s disease (AD), a dreadful neurodegenerative disorder that affects cognitive and behavioral function in geriatric populations, is characterized by the presence of amyloid deposits and neurofibrillary tangles in brain regions. The International D World Alzheimer Report 2018 noted a global prevalence of 50 million AD cases and forecasted a threefold rise to 139 million by 2050. Although there exist numerous genetic association studies pertinent to AD in different ethnicities, critical genetic factors and signaling pathways underlying its pathogenesis remain ambiguous. This study was aimed to analyze the genetic data retrieved from 32 Gene Expression Omnibus datasets belonging to diverse ethnic cohorts in order to identify overlapping differentially expressed genes (DEGs). Stringent selection criteria were framed to shortlist appropriate datasets based on false discovery rate (FDR) p-value and log FC, and relevant details of upregulated and downregulated DEGs were retrieved. Among the 32 datasets, only six satisfied the selection criteria. The GEO2R tool was employed to retrieve significant DEGs. Nine common DEGs, i.e., SLC5A3, BDNF, SST, SERPINA3, RTN3, RGS4, NPTX, ENC1 and CRYM were found in more than 60% of the selected datasets. These DEGs were later subjected to protein–protein interaction analysis with 18 AD-specific literature-derived genes. Among the nine common DEGs, BDNF, SST, SERPINA3, RTN3 and RGS4 exhibited significant interactions with crucial proteins including BACE1, GRIN2B, APP, APOE, COMT, PSEN1, INS, NEP and MAPT. Functional enrichment analysis revealed involvement of these genes in trans-synaptic signaling, chemical transmission, PI3K pathway signaling, receptor–ligand activity and G protein signaling. These processes are interlinked with AD pathways.
Introduction
Alzheimer’s disease (AD), a progressive irreversible neurodegenerative disorder affecting the elderly, is characterized by dementia and disruption of cognitive functioning. It represents one of the highest unmet medical needs worldwide. The International D World Alzheimer Report 2018 noted a global prevalence of 50 million in 2018 and forecasted a threefold rise in AD cases to 139 million globally by 2050 (International D World Alzheimer Report 2018). In the United States, around 121,000 deaths due to Alzheimer’s dementia were reported in 2019. During the coronavirus disease 2019 (COVID-19) pandemic, fatality rates amongst AD patients increased by 145% (Alzheimer’s disease facts and figures 2021). The Alzheimer’s and Related Disorders Society of India (ARDSI) forecasts a huge burden of 6.35 million AD cases across India by 2025 (Kumar et al. 2020).
To date, the US Food and Drug Administration (US-FDA) has approved only four anti-AD drugs, belonging to the following categories: (i) cholinesterase inhibitors: donepezil, rivastigmine and galantamine; and (ii) N-methyl-d-aspartate receptor antagonist: memantine (Alzheimer’s Association 2017). The AD treatments are oriented towards nominal symptomatic relief and offer modest clinical effect.
Looking into the pathophysiology, neuropathological evidence shows that AD is characterized by the presence of amyloid beta (Aβ) plaques and neurofibrillary tangles (NFT) in the hippocampal and cortical regions. Although there are various complex pathophysiological theories explaining the role of numerous genes and proteins in AD progression, a major role is attributed to presenilin 1 (PSEN1), beta-secretase 1 (BACE1), amyloid precursor protein (APP) and microtubule-associated protein tau (MAPT) proteins (Chouraki and Seshadri 2014). Disruption in regulatory activities such as phosphorylation and dephosphorylation of these proteins result in AD progression. Notwithstanding the existence of countless genetic evaluations, inconsistencies among various ethnicities contribute to a lacuna in unraveling crucial disease-specific targets. This study was aimed at exploring the major genetic alterations among various microarray datasets to retrieve common differentially expressed genes (DEGs) among various ethnicities, with the hypothesis that overlapping DEGs across different ethnicities might play a definitive role in AD pathogenesis.
Methodology
Selection of Datasets
Microarray datasets pertaining to Alzheimer’s disease were retrieved from the Gene Expression Omnibus (GEO) database (Barrett et al. 2013) using the keywords “Alzheimer’s disease”, “Familial Alzheimer’s disease”, “Sporadic Alzheimer’s disease,” “Early onset Alzheimer’s disease” and “Late onset Alzheimer’s disease”. The datasets retrieved through the above search terms were screened through a set of inclusion and exclusion criteria.
Inclusion Criteria
Datasets satisfying all the following criteria were selected:
-
Datasets with controls and AD
-
Datasets with expressional arrays
-
Datasets describing the diagnostic criteria of AD
-
Datasets studied in Homo sapiens
-
Datasets with a minimum of two samples in each category, i.e., control and AD
-
Datasets with blood/brain samples
Exclusion Criteria
Datasets with the following criteria were excluded.
-
Drug-treated datasets
-
Methylation studies
-
Datasets with no diagnostic criteria
-
Cell line studies
-
Datasets from other organisms
-
Datasets with no details about controls
-
Mutation studies
Gene Expression Analysis
The selected datasets were preprocessed, curated and analyzed individually for retrieval of differentially expressed genes (DEGs) (both upregulated and downregulated) through the Bioconductor package. The datasets which revealed DEGs with a false discovery rate (FDR) p-value (adjusted p-value according to Benjamini–Hochberg method) < 0.05 were selected. These datasets were then subjected to four sets of filtering criteria based on FDR and log fold change (FC): (i) FDR p-value < 0.05 and log FC > 2, (ii) FDR p-value < 0.05 and log FC > 1.5, (iii) FDR p-value < 0.05 and log FC > 1 and (iv) FDR p-value < 0.01 and log FC > 1. Based on the above stringent filtering criteria, the datasets possessing the following characteristics were included: (a) datasets satisfying one of the above four criteria, (b) datasets that encompassed both upregulated and downregulated DEGs and (c) 60% of the datasets showing the aforementioned characteristics (a) and (b) that display a higher degree of common DEGs.
Protein–Protein Interaction (PPI) Analysis
The common DEGs retrieved from the above step were subjected to PPI analysis with literature-derived genes (LDGs) gathered from the National Center for Biotechnology Information (NCBI) (Brown et al. 2015) pertinent to AD progression through the Search Tool for the Retrieval of Interacting Genes/Proteins (STRING) database (von Mering et al. 2003). The PPI network was visualized through Cytoscape with proteins as nodes and interactions as edges. The proteins exhibiting significant interactions (70% confidence score) with LDGs were shortlisted, and the nodes exhibiting node degree > 2 were selected as AD targets.
Functional Enrichment Analysis
The common DEGs retrieved were subjected to functional enrichment analysis to explore their involvement in signaling pathways and physiological functions associated with AD pathogenesis through ClueGO (Bindea et al. 2009) in Cytoscape.
Results
Selection of Datasets
A total of 134 GEO datasets derived from studies performed on Homo sapiens were retrieved from NCBI, of which 32 datasets were found to satisfy the initial inclusion criteria. Details pertaining to the 32 datasets are presented in Table 1.
Gene Expression Analysis
The datasets were analyzed individually through Bioconductor package in R using GEO2R tool (Barrett et al. 2013). Among the 32 datasets, 16 were rejected because they did not exhibit significant FDR p-values. The remaining 16 datasets were analyzed based on the four filtering criteria and three characteristics mentioned in the methodology section (Fig. 1).

CONSORT diagram explaining the selection and screening of datasets
-
(i)
FDR p-value < 0.05 and log FC > 2:
Out of the 16 qualified datasets, five possessing upregulated DEGs and four with downregulated DEGs (Fig. 2) satisfied this criterion (Tables 2 and 3). Nevertheless, the upregulated DEGs of two datasets of the five displayed overlapping genes, while the downregulated DEGs of the shortlisted datasets did not show common genes. Therefore, this criterion was rejected.
Fig. 2 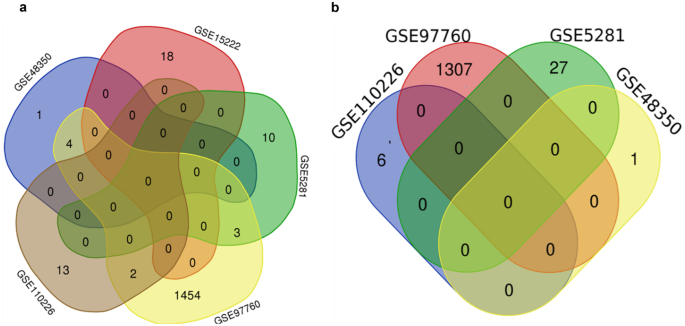
Venn diagram exhibiting the common upregulated (a) and downregulated (b) DEGs
Table 2 Number of DEGs obtained through filtering criteria Table 3 List of common DEGs obtained through filtering criteria -
(ii)
FDR p-value < 0.05 and log FC > 1.5:
Among the 16 datasets, only six were found to meet this criterion (Tables 2 and 3). Common DEGs were found in datasets which accounted for 50% and thus did not meet characteristic (c) mentioned in the methodology section (Fig. 3). Thus, this criterion was also rejected.
Fig. 3 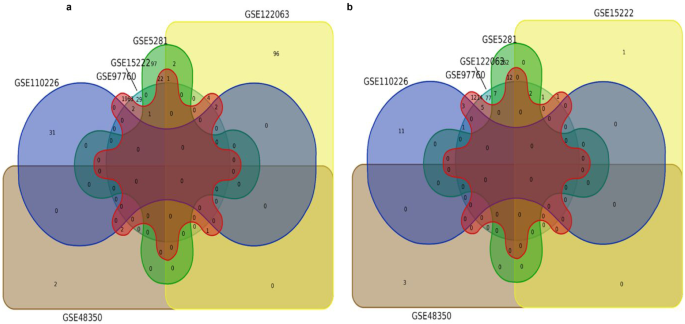
Venn diagram exhibiting the common upregulated (a) and downregulated (b) DEGs
-
(iii)
FDR p-value < 0.05 and log FC > 1
Among the 16 datasets, this criterion was met by nine datasets with upregulated DEGs and eight datasets with downregulated DEGs (Tables 2 and 3). Also, the number of datasets was not equal, and the common DEGs were not seen in 60% of the datasets. Therefore, this criterion was rejected.
-
(iv)
FDR p-value < 0.01 and log FC > 1
Among the 16 datasets, this criterion was met by six datasets containing both upregulated and downregulated DEGs (Tables 2 and 3). Common upregulated and downregulated DEGs were found in four datasets which accounted for more than 60%. Hence, this criterion was selected to retrieve the DEGs for PPI and functional enrichment analysis. Among upregulated DEGs, solute carrier family 5 member 3 (SLC5A3) and serpin family A member 3 (SERPINA3) were found to be common in four datasets. Among downregulated DEGs, somatostatin (SST), regulator of G protein signaling 4 (RGS4), crystallin mu (CRYM), neuronal pentraxin 2 (NPTX2), reticulon 3 (RTN3), brain-derived neurotrophic factor (BDNF) and ectodermal-neural cortex 1 (ENC1) genes were found to be common in four datasets (Fig. 4). These genes were selected for further PPI analysis with LDGs.
Fig. 4 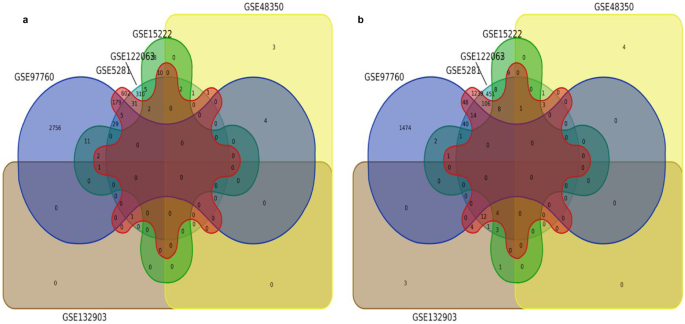
Venn diagram exhibiting the common upregulated (a) and downregulated (b) DEGs


PPI Analysis
Eighteen LDGs were selected from the NCBI portal (Table 4) and were subjected to PPI analysis with the shortlisted DEGs from the above step. PPI analysis (Fig. 5) revealed that BDNF exhibited the highest node degree (16), followed by SST (7), AACT (SERPINA3) (4), RTN3 (2), RGS4 (3), NPTX (1) and CRYM (1). BDNF exhibited high connectivity with AD-specific proteins including glutamate ionotropic receptor NMDA type subunit 2B (GRIN2B), BACE1, MAPT, PSEN1, TP53, BCHE, SNCA, COMT, INS, APP, APOE and ACHE. SST exhibited PPI with IDE, MME, IGF, APP, INS and ACHE. SERPINA3/AACT exhibited interactions with APOA1, APOE and APP proteins. RTN3 interacted with BACE1 and APP. RGS4 interacted with COMT alone. NPTX and CRYM did not exhibit interactions with any of the LDGs (Fig. 5, Tables 5 and 6).

PPI network of DEGs exhibiting significant interactions with LDGs. Yellow nodes represent common genes retrieved from GEO datasets. Pink nodes represent LDGs
Functional Enrichment Analysis
The common DEGs retrieved were subjected to functional enrichment analysis to explore their involvement in Gene Ontology (GO) and Kyoto Encyclopedia of Genes and Genomes (KEGG) pathways.
GO analysis revealed that SLC5A3 was involved in the transport of potassium ions across plasma membranes (GO:0098739) and peripheral nervous system development (GO:0007422), whereas BDNF, RGS4, NPTX2 and SST were involved in cognitive ability (GO:0050890), trans-synaptic signaling (GO:0099157), striated muscle cell differentiation (GO:0051154), anterograde trans-synaptic transmission (GO:0098916) and regulation of nervous system processes (GO:0031644). BDNF, SST and ENC1 were involved in receptor ligand activity (GO:0048018), cytokine receptor binding (GO:0005126), positive regulation of cell projection organization (GO:0031346) and receptor regulator activity (GO:0030545). ENC1 and RTN3 were found to be involved in negative regulation of cellular amide metabolic process (GO:0034249). SERPINA3 in combination with SST was known to be involved in digestion (GO:0007586) (Fig. 6).

Gene Ontology categories of common DEGs describing their physiological roles
KEGG analysis revealed that BDNF was involved in triggering the phosphoinositide 3-kinase (PI3K) pathway (hsa04213), rat sarcoma (RAS) signaling (hsa05212), RAC1 signaling (hsa04510), FYN signaling (hsa04380), cyclin-dependent kinase 5 (CDK5) phosphorylation, FYN-mediated GRIN2B activation and transcriptional signaling. BDNF and SST were involved in transcription regulation by methyl-CpG-binding protein 2 (MECP2), gastric acid secretion (hsa04971) and somatostatin gene expression. RGS4 was known to mediate G alpha (i) auto-inactivation and G alpha (q) inactivation by hydrolysis of guanosine triphosphate (GTP) to guanosine diphosphate (GDP). CRYM was involved in lysine catabolism and autosomal-dominant deafness, whereas RTN3 was involved in PPI at synapses, binding of synaptic adhesion-like molecule 1–4 (SALM1–4) to reticulons and synaptic adhesion-like molecules. SERPINA3 was involved in exocytosis of platelet alpha granules and azurophil granule lumen proteins (Fig. 7).

Significant KEGG pathways of common DEGs
Discussion
This study was aimed to retrieve significant DEGs associated with AD by analyzing the gene expression data available in the GEO database. Initially, the GEO datasets were selected based on the inclusion and exclusion criteria, which resulted in 32 datasets. The raw data for each dataset were analyzed individually using the Bioconductor package in R, and DEGs with FDR p-value < 0.05 were retrieved and segregated into upregulated and downregulated DEGs. Although 32 datasets were found to be eligible, only 16 satisfied the initial criteria FDR p-value < 0.05. These DEGs were subjected to screening based on different filtering norms, and this yielded six datasets with both upregulated and downregulated DEGs. Herein, the overlapping DEGs were found in more than 60% of the above mentioned six datasets. SLC5A3 and SERPINA3 were found to be common in upregulated DEGs, whereas SST, BDNF, RGS4, CRYM, NPTX2, RTN3 and ENC1 were found to be common in downregulated DEGs. These DEGs were further subjected to PPI analysis with 18 LDGs which were known to play a strong role in AD pathogenesis. Among the above nine DEGs, BDNF, SST, SERPINA3 (AACT), RTN3 and RGS4 exhibited significant interactions.
BDNF exhibited interaction with crucial targets including GRIN2B, BACE1, APP, MAPT, SNCA, ACHE, APOE, PSEN1 and COMT. Functional enrichment analysis revealed a normal physiological role of BDNF in cytokine signaling, receptor ligand activity and regulation, trans-synaptic signaling, cognitive function, chemical synaptic transmission, cell differentiation, cell growth and regulation. This suggests its crucial involvement in neuronal growth, development and transmission, which is found to be abnormal in AD. KEGG pathway analysis revealed detailed mechanistic action of BDNF. BDNF initiates its response by binding to the tyrosine kinase beta (TRKβ) receptor; post-binding, the receptor dimerizes and undergoes autophosphorylation. The phosphorylated TRKβ triggers various signaling mechanisms such as PI3K, RAS, CDK5, RAC1 GTPase, Src homology 2 domain-containing 1 (SHC1), FYN kinase, fibroblast growth factor receptor substrate 2 (FRS2), T-lymphoma invasion and metastasis-inducing protein 1 (TIAM1) and phospholipase C gamma 1 (PLCG1). These were in turn found to be involved in triggering secondary signaling pathways through GRIN2B, which is associated with cocaine addiction, cognitive central hypoventilation syndrome and eating disorders. A number of research studies have reported downregulation of BDNF expression, which is in line with our findings (Kang et al. 2020; Akhtar et al. 2020).
The PPI analysis of SST revealed its interaction with primary AD targets including IDE, MME, IGF, APP, INS and ACHE. Like BDNF, SST also exhibited a physiological role in trans-synaptic signaling, cognitive function, anterograde trans-synaptic signaling, receptor ligand activity, cytokine receptor binding and receptor regulator activity. KEGG pathway analysis revealed the association of SST with MECP2 and c-AMP responsive element-binding protein 1 (CREB1). It is reported that MECP2 together with CREB1 enhances the expression of SST by binding to the promoter region (Chahrour et al. 2008). There are five subtypes of SST receptors, of which three receptors, i.e., SSTR2, SSTR4 and SSTR5, were observed to display marked downregulation and reduced sensitivity in AD. This interferes with their inhibitory control over the adenylyl cyclase (AC) pathway. Decreased SSTR2 results in decreased activity of neprilysin, an enzyme involved in the degradation of Aβ peptides (Burgos-Ramos et al. 2008; Aguado-Llera et al. 2018; Sandoval et al. 2019). In addition, postmortem AD brains with decreased levels of SST receptors were correlated with a higher degree of amnesia and cognitive dysfunction (Saiz-Sanchez et al. 2010; Beal et al. 1985). In concordance with the above studies, our analysis found downregulation of SST receptors.
SERPINA3 or AACT is a 55–68 kDa serine protease inhibitor secreted by ependymal cells of the choroid plexus (Zhang and Janciauskiene 2002). Our PPI analysis identified its interaction with APP, APOE and APOA1. Functional enrichment analysis revealed its role in digestion and exocytosis. In AD, it was reported to be colocalized with amyloid plaques. The hydrophobic domain at the C-terminal of this enzyme interacts and forms a complex with amyloid fibrils. These complexes are known to upregulate SERPINA3, resulting in disruption of cognitive function (Abraham and Potter 1989; Eriksson et al. 1995). Apart from interacting with Aβ fibrils, it is also known to promote tau phosphorylation at Ser202, Thr231, Ser396 and Thr404 by augmenting extracellular signal-related kinase (ERK), glycogen synthase kinase-3β (GSK-3ß) and c-Jun N-terminal kinase (JNK), leading to inflammatory responses promoting neuronal death and degeneration (Tyagi et al. 2013; Padmanabhan et al. 2006).
RTN3, a transmembrane endoplasmic reticulum (ER) protein, belongs to a family of reticulons. Reticulons consist of four mammalian paralogs, i.e., RTN1, RTN2, RTN3 and RTN4, of which RTN3 and RTN4 are neuronal-specific. The members of this reticulon family possess a conserved QID triplet region, known as a reticulon homology domain (RHD) in their C-terminal region. This RHD domain was found to interact with the C-terminal domain of BACE1, which is involved in the formation of Aβ peptides (Kume et al. 2009; He et al. 2006, 2007). The BACE1-RTN3 complex is reported to halt the axonal transport and enzymatic activity of BACE1 on APP, thereby terminating the amyloidogenic pathway. It was also reported that BACE1 was found to specifically interact with monomeric RTN3 rather than dimeric forms (Sharoar and Yan 2017; He et al. 2006). The formation of RTN3 aggregates was found to be regulated by B-cell receptor-associated protein 31 (BAP31), an integral ER membrane protein. Silencing of this gene leads to formation of RTN3 aggregates, thereby reducing the interaction with BACE1 which promotes Aβ formation (He et al. 2004; Wang et al. 2019). Our functional enrichment analysis revealed the interactions of RTN3 with synaptic proteins and gene expression analysis demonstrated downregulation of this gene.
RGS4, a member of the RGS family, modulates G protein signaling activity by inhibiting AC and phospholipase C (PLC) activity. RGS4 inhibits G protein-coupled receptor (GPCR)-mediated APP cleavage, while downregulation of RGS4 enhances APP cleavage (Emilsson 2005). Functional enrichment analysis revealed that RGS4 was involved in various regulatory functions including modulation of chemical synaptic transmission, regulation of trans-synaptic signaling, nervous processes, striated muscle cell differentiation and regulation of cell growth. KEGG analysis revealed that active G alpha (i), (q) and (z) are binding partners of RGS4. Our gene expression analysis revealed downregulation of RGS4 in AD cases.
In summary, from the analysis, BDNF, SST, SERPINA3, RTN3 and RGS4 were found to be crucially involved in AD pathogenesis. BDNF and SST trigger various signaling mechanisms including PKA, PI3K and AKT, which in turn inhibit GSK3β and BAD activity. This process results in the inhibition of apoptosis and promotion of neuronal growth. On the other hand, downregulation of BDNF and SST enables Aβ fibrils to inhibit the aforementioned signaling mechanisms, thereby resulting in enhanced apoptosis and neuronal cell death. RTN3 interacts with BACE1 directly and impedes its access to APP cleavage, thereby promoting the non-amyloidogenic pathway. RGS4 acts in similar fashion as SST by hindering GTP hydrolysis (Fig. 8). The presence of Aβ fibrils leads to AD progression; however, the aforesaid targets are believed to have substantial potential to counteract Aβ toxicity.

Signaling mechanisms and cross-talk pathways underlying AD progression
Blue arrows represent signaling mechanisms in the absence of Aβ fibrils, and red arrows represent signaling responses in the presence of Aβ fibrils. BDNF: brain-derived neurotrophic factor, TRKβ: tyrosine kinase β, SST: somatostatin, SSTR: somatostatin receptor, APP: amyloid precursor protein, AC: adenylyl cyclase, BACE1: beta-secretase 1, ER: endoplasmic reticulum, RTN3: reticulon 3, GTP: guanosine triphosphate, GDP: guanosine diphosphate, RGS4: regulator of G protein signaling 4, cAMP: cyclic adenosine monophosphate, CDK5: cyclin-dependent kinase 5, TIAM1: T-lymphoma invasion and metastasis-inducing protein 1, FYN: Fyn kinase, IRS: insulin receptor substrate, AQ11SHC: src homology and collagen, DOCK3: dedicator of cytokinesis 3, GRIN2B: glutamate ionotropic receptor NMDA type subunit 2B, RAC1: Rac family small GTPase 1, PI3K: phosphatidylinositol-4,5-bisphosphate 3-kinase, AKT: AKT serine/threonine kinase, GSK3β: glycogen synthase kinase 3β, BAD:BCL2-associated agonist of cell death, GRB2: growth factor receptor bound-protein 2, RAS: KRAS proto-oncogene, GTPase, MEK: mitogen-activated protein kinase, ERK: extracellular signal-regulated kinase, CREB: cAMP responsive element binding protein 1, PHF: paired helical filaments, EPAC: Rap guanosine nucleotide exchange factor 3, RAP1: member of Ras oncogene family, PKA: protein kinase A, BCL2: BCL2 apoptosis regulator.
Conclusion
Systematic analysis of the metadata by considering all AD-related genetic datasets with a developed set of filtering criteria improved the precision of results. Through this analysis, SLC5A3, BDNF, SST, SERPINA3, RTN3, RGS4, NPTX, ENC1 and CRYM were identified as potential genes involved in AD pathogenesis. Among the identified genes, BDNF, SST, SERPINA3, RTN3 and RGS4 exhibited significant interactions with LDGs, and thus they were considered to play a major role in AD progression.
Abbreviations
- Aβ:
-
Amyloid beta plaques
- AC:
-
Adenylyl-cycle
- AD:
-
Alzheimer’s disease
- APP:
-
Amyloid precursor protein
- ARDSI:
-
Alzheimer’s and related disorders society of India
- BACE_1:
-
Beta-secretase 1
- BAP31:
-
B-cell receptor-associated protein 3l
- BDNF:
-
Brain-derived neurotrophic factor
- CDK5:
-
Cyclin-dependent kinase 5
- COVID-19:
-
Coronavirus disease 2019
- CREB1:
-
c-AMP-responsive element-binding protein 1
- CRYM:
-
Crystallin Mu
- DEGs:
-
Differentially expressed genes
- ENC1:
-
Ectodermal-neural cortex 1
- ERK:
-
Extracellular signal-regulated kinase
- FC:
-
Fold change
- FDR:
-
False discovery rate
- FRS2:
-
Fibroblast growth factor receptor substrate 2
- GEO:
-
Gene Expression Omnibus
- GDP:
-
Guanosine diphosphate
- GTP:
-
Guanosine triphosphate
- GRIN2B:
-
Glutamate ionotropic receptor NMDA type subunit 2B
- GSK-3β:
-
Glycogen synthase kinase-3β
- HGCN:
-
HUGO Gene Nomenclature Committee
- JNK:
-
c-Jun N-terminal kinase
- LDGs:
-
Literature-derived genes
- MAPT:
-
Microtubule-associated protein tau
- MECP2:
-
Methyl-CpG binding protein 2
- NCBI:
-
National Center for Biotechnology Information
- NFT:
-
Neurofibrillary tangles
- NPTX2:
-
Neuronal pentraxin 2
- PI3K:
-
Phosphoinositide 3-kinase
- PLC:
-
Phospholipase C
- PLCG1:
-
Phospholipase C-gamma 1
- PPI:
-
Protein–protein interaction
- PSEN1:
-
Presenilin 1
- RAS:
-
Rat sarcoma
- RGS4:
-
Regulator of G-protein signaling 4
- RHD:
-
Reticulon homology domain
- SALM1-4:
-
Synaptic adhesion-like molecule 1-4
- SERPINA3:
-
Serpin family A member 3
- SHC1:
-
Src homology 2 domain-containing 1
- SLC5A3:
-
Solute carrier family 5 member 3
- SST:
-
Somatostatin
- STRING:
-
Search tool for the retrieval of interacting genes/proteins
- TIAM1:
-
T-Lymphoma invasion and metastasis-inducing protein 1
- TRKβ:
-
Tyrosine kinase beta
- US-FDA:
-
US Food and Drug Administration
References
Abraham CR, Potter H (1989) The protease inhibitor, α1-antichymotrypsin, is a component of the brain amyloid deposits in normal aging and Alzheimer’s disease. Ann Med 21:77–81. https://doi.org/10.3109/07853898909149188
Aguado-Llera D, Canelles S, Frago LM et al (2018) The Protective Effects of IGF-I against β-Amyloid-related Downregulation of Hippocampal Somatostatinergic System Involve Activation of Akt and Protein Kinase A. Neuroscience 374:104–118. https://doi.org/10.1016/j.neuroscience.2018.01.041
Akhtar A, Dhaliwal J, Saroj P et al (2020) Chromium picolinate attenuates cognitive deficit in ICV-STZ rat paradigm of sporadic Alzheimer’s-like dementia via targeting neuroinflammatory and IRS-1/PI3K/AKT/GSK-3β pathway. Inflammopharmacology 28:385–400. https://doi.org/10.1007/s10787-019-00681-7
Alzheimer’s Association (2017) FDA-approved treatments for Alzheimer’s. 1–5
Alzheimer’s disease facts and figures (2021). 2021 Alzheimer’s disease facts and figures. Alzheimer’s Dement 17:327–406. https://doi.org/10.1002/alz.12328
Andreoli V, De Marco EV, Trecroci F et al (2013) Potential involvement of GRIN2B encoding the NMDA receptor subunit NR2B in the spectrum of Alzheimer’s disease. J Neural Transm 121:533–542. https://doi.org/10.1007/s00702-013-1125-7
Astarita G, Jung KM, Berchtold NC et al (2010) Deficient liver biosynthesis of docosahexaenoic acid correlates with cognitive impairment in Alzheimer’s disease. PLoS One 5:1–8. https://doi.org/10.1371/journal.pone.0012538
Barrett T, Wilhite SE, Ledoux P et al (2013) NCBI GEO: archive for functional genomics data sets–update. Nucleic Acids Res 41:D991–D995. https://doi.org/10.1093/nar/gks1193
Beal MF, Mazurek MF, Tran VT et al (1985) Reduced numbers of somatostatin receptors in the cerebral cortex in Alzheimer’s disease. Science 229:289–291. https://doi.org/10.1126/science.2861661
Berchtold NC, Coleman PD, Cribbs DH et al (2013) Synaptic genes are extensively downregulated across multiple brain regions in normal human aging and Alzheimer’s disease. Neurobiol Aging 34:1653–1661. https://doi.org/10.1016/j.neurobiolaging.2012.11.024
Bergen AA, Kaing S, Brinkten JB et al (2015) Gene expression and functional annotation of human choroid plexus epithelium failure in Alzheimer’s disease. BMC Genomics 16. https://doi.org/10.1186/s12864-015-2159-z
Berson A, Barbash S, Shaltiel G et al (2012) Cholinergic-associated loss of hnRNP-A/B in Alzheimer’s disease impairs cortical splicing and cognitive function in mice. EMBO Mol Med 4:730–742. https://doi.org/10.1002/emmm.201100995
Bindea G, Mlecnik B, Hackl H et al (2009) ClueGO: a Cytoscape plug-in to decipher functionally grouped gene ontology and pathway annotation networks. Bioinformatics 25:1091–1093. https://doi.org/10.1093/bioinformatics/btp101
Blair LJ, Nordhues BA, Hill SE et al (2013) Accelerated neurodegeneration through chaperone-mediated oligomerization of tau. J Clin Invest 123:4158–4169. https://doi.org/10.1172/JCI69003
Blalock EM, Buechel HM, Popovic J et al (2011) Microarray analyses of laser-captured hippocampus reveal distinct gray and white matter signatures associated with incipient Alzheimer’s disease. J Chem Neuroanat 42:118–126. https://doi.org/10.1016/j.jchemneu.2011.06.007
Blalock EM, Geddes JW, Chen KC et al (2004) Incipient Alzheimer’s disease: Microarray correlation analyses reveal major transcriptional and tumor suppressor responses. Proc Natl Acad Sci U S A 101:2173–2178. https://doi.org/10.1073/pnas.0308512100
Brown GR, Hem V, Katz KS et al (2015) Gene: a gene-centered information resource at NCBI. Nucleic Acids Res 43:D36–D42. https://doi.org/10.1093/nar/gku1055
Burgos-Ramos E, Hervás-Aguilar A, Aguado-Llera D et al (2008) Somatostatin and Alzheimer’s disease. Mol Cell Endocrinol 286:104–111. https://doi.org/10.1016/j.mce.2008.01.014
Chahrour M, Sung YJ, Shaw C et al (2008) MeCP2, a key contributor to neurological disease, activates and represses transcription. Science 320:1224–1229. https://doi.org/10.1126/science.1153252
Den CK, Chang PT, Ping YH et al (2011) Gene expression profiling of peripheral blood leukocytes identifies and validates ABCB1 as a novel biomarker for Alzheimer’s disease. Neurobiol Dis 43:698–705. https://doi.org/10.1016/j.nbd.2011.05.023
Chouraki V, Seshadri S (2014) Genetics of Alzheimer’s disease. Elsevier
Cribbs DH, Berchtold NC, Perreau V et al (2012) Extensive innate immune gene activation accompanies brain aging, increasing vulnerability to cognitive decline and neurodegeneration: A microarray study. J Neuroinflammation 9. https://doi.org/10.1186/1742-2094-9-179
Deane R, Du YS, Submamaryan RK et al (2003) RAGE mediates amyloid-β peptide transport across the blood-brain barrier and accumulation in brain. Nat Med 9:907–913. https://doi.org/10.1038/nm890
Dunckley T, Beach TG, Ramsey KE et al (2006) Gene expression correlates of neurofibrillary tangles in Alzheimer’s disease. Neurobiol Aging 27:1359–1371. https://doi.org/10.1016/j.neurobiolaging.2005.08.013
Durrenberger PF, Fernando FS, Kashefi SN et al (2015) Common mechanisms in neurodegeneration and neuroinflammation: a BrainNet Europe gene expression microarray study. J Neural Transm 122:1055–1068. https://doi.org/10.1007/s00702-014-1293-0
Durrenberger PF, Fernando FS, Magliozzi R et al (2012) Selection of novel reference genes for use in the human central nervous system: A BrainNet Europe Study. Acta Neuropathol 124:893–903. https://doi.org/10.1007/s00401-012-1027-z
Emilsson L (2005) Detection of differentially expressed genes in Alzheimer’s disease. Uppsala University
Eriksson S, Janciauskiene S, Lannfelt L (1995) α1-Antichymotrypsin regulates Alzheimer β-amyloid peptide fibril formation. Proc Natl Acad Sci U S A 92:2313–2317. https://doi.org/10.1073/pnas.92.6.2313
Fischer MT, Wimmer I, Höftberger R et al (2013) Disease-specific molecular events in cortical multiple sclerosis lesions. Brain 136:1799–1815. https://doi.org/10.1093/brain/awt110
Fitz NF, Tapias V, Cronican AA et al (2015) Opposing effects of Apoe / Apoa1 double deletion on amyloid-β pathology and cognitive performance in APP mice. Brain 138:3699–3715. https://doi.org/10.1093/brain/awv293
He W, Hu X, Shi Q et al (2006) Mapping of Interaction Domains Mediating Binding between BACE1 and RTN/Nogo Proteins. J Mol Biol 363:625–634. https://doi.org/10.1016/j.jmb.2006.07.094
He W, Lu Y, Qahwash I et al (2004) Reticulon family members modulate BACE1 activity and amyloid-β peptide generation. Nat Med 10:959–965. https://doi.org/10.1038/nm1088
He W, Shi Q, Hu X, Yan R (2007) The membrane topology of RTN3 and its effect on binding of RTN3 to BACE1. J Biol Chem 282:29144–29151. https://doi.org/10.1074/jbc.M704181200
Heinzen EL, Yoon W, Weale ME et al (2007) Alternative ion channel splicing in mesial temporal lobe epilepsy and Alzheimer’s disease. Genome Biol 8. https://doi.org/10.1186/gb-2007-8-3-r32
Hokama M, Oka S, Leon J et al (2014) Altered expression of diabetes-related genes in Alzheimer’s disease brains: The Hisayama study. Cereb Cortex 24:2476–2488. https://doi.org/10.1093/cercor/bht101
International D World Alzheimer Report (2018) The state of the art of dementia research: New frontiers. World Alzheimer Report 2018
Jha NK, Jha SK, Kumar D et al (2015) Impact of insulin degrading enzyme and neprilysin in Alzheimer’s disease biology: Characterization of putative cognates for therapeutic applications. J Alzheimer’s Dis 48:891–917. https://doi.org/10.3233/JAD-150379
Kang T, Qu Q, Xie Z, Cao B (2020) NDRG4 Alleviates Aβ1–40 Induction of SH-SY5Y Cell Injury via Activation of BDNF-Inducing Signalling Pathways. Neurochem Res 45:1492–1499. https://doi.org/10.1007/s11064-020-03011-4
Kant S, Stopa EG, Johanson CE et al (2018) Choroid plexus genes for CSF production and brain homeostasis are altered in Alzheimer’s disease. Fluids Barriers CNS 15. https://doi.org/10.1186/s12987-018-0120-7
Kimura A, Hata S, Suzuki T (2016) Alternative Selection of β-Site APP-Cleaving Enzyme 1 (BACE1) Cleavage Sites in Amyloid β-Protein Precursor (APP) Harboring Protective and Pathogenic Mutations within the Aβ Sequence. J Biol Chem 291:24041–24053. https://doi.org/10.1074/jbc.M116.744722
Kumar CTS, Shaji KS, Varghese M NM (Eds) (2020) Dementiain India 2020 2. Alzheimer’s and Related Disorders Society of India (ARDSI), Cochin
Kume H, Konishi Y, Murayama KS et al (2009) Expression of reticulon 3 in Alzheimer’s disease brain. Neuropathol Appl Neurobiol 35:178–188. https://doi.org/10.1111/j.1365-2990.2008.00974.x
Lachen-Montes M, Zelaya MV, Segura V et al (2017) Progressive modulation of the human olfactory bulb transcriptome during Alzheimer’s disease evolution: Novel insights into the olfactory signaling across proteinopathies. Oncotarget 8:69663–69679. https://doi.org/10.18632/oncotarget.18193
Lai MKP, Esiri MM, Tan MGK (2014) Genome-wide profiling of alternative splicing in Alzheimer’s disease. Genomics Data 2:290–292. https://doi.org/10.1016/j.gdata.2014.09.002
Liang WS, Dunckley T, Beach TG et al (2007) Gene expression profiles in anatomically and functionally distinct regions of the normal aged human brain. Physiol Genomics 28:311–322. https://doi.org/10.1152/physiolgenomics.00208.2006
Liang WS, Dunckley T, Beach TG et al (2008a) Altered neuronal gene expression in brain regions differentially affected by Alzheimer’s disease: A reference data set. Physiol Genomics 33:240–256. https://doi.org/10.1152/physiolgenomics.00242.2007
Liang WS, Reiman EM, Valla J et al (2008b) Alzheimer’s disease is associated with reduced expression of energy metabolism genes in posterior cingulate neurons. Proc Natl Acad Sci USA 105:4441–4446. https://doi.org/10.1073/pnas.0709259105
Mackin RS, Insel P, Zhang J et al (2015) Cerebrospinal fluid α-synuclein and Lewy body-like symptoms in normal controls, mild cognitive impairment, and Alzheimer’s disease. J Alzheimer’s Dis 43:1007–1016. https://doi.org/10.3233/JAD-141287
Maes OC, Schipper HM, Chertkow HM, Wang E (2009) Methodology for discovery of Alzheimer’s disease blood-based biomarkers. Journals Gerontol - Ser A Biol Sci Med Sci 64:636–645. https://doi.org/10.1093/gerona/glp045
Maes OC, Schipper HM, Chong G et al (2010) A GSTM3 polymorphism associated with an etiopathogenetic mechanism in Alzheimer disease. Neurobiol Aging 31:34–45. https://doi.org/10.1016/j.neurobiolaging.2008.03.007
Maes OC, Xu S, Yu B et al (2007) Transcriptional profiling of Alzheimer blood mononuclear cells by microarray. Neurobiol Aging 28:1795–1809. https://doi.org/10.1016/j.neurobiolaging.2006.08.004
Majores M, Kölsch H, Bagli M et al (2002) The insulin gene VNTR polymorphism in Alzheimer’s disease: results of a pilot study. J Neural Transm 109:1029–1034. https://doi.org/10.1007/s007020200086
McKay EC, Beck JS, Khoo SK et al (2019) Peri-infarct upregulation of the oxytocin receptor in vascular dementia. J Neuropathol Exp Neurol 78:436–452. https://doi.org/10.1093/jnen/nlz023
Miller JA, Woltjer RL, Goodenbour JM et al (2013) Genes and pathways underlying regional and cell type changes in Alzheimer’s disease. Genome Med 5. https://doi.org/10.1186/gm452
Miyashita A, Hatsuta H, Kikuchi M et al (2014) Genes associated with the progression of neurofibrillary tangles in Alzheimer’s disease. Transl Psychiatry 4. https://doi.org/10.1038/tp.2014.35
Narayanan M, Huynh JL, Wang K, et al (2014) Common dysregulation network in the human prefrontal cortex underlies two neurodegenerative diseases. Mol Syst Biol 10:743. https://doi.org/10.15252/msb.20145304
Naughton BJ, Duncan FJ, Murrey DA et al (2014) Blood genome-wide transcriptional profiles reflect broad molecular impairments and strong blood-brain links in Alzheimer’s disease. J Alzheimer’s Dis 43:93–108. https://doi.org/10.3233/JAD-140606
Nho K, Kim S, Horgusluoglu E et al (2017) Association analysis of rare variants near the APOE region with CSF and neuroimaging biomarkers of Alzheimer’s disease. BMC Med Genomics 10:29. https://doi.org/10.1186/s12920-017-0267-0
Nunez-Iglesias J, Liu CC, Morgan TE et al (2010) Joint genome-wide profiling of miRNA and mRNA expression in Alzheimer’s disease cortex reveals altered miRNA regulation PLoS One 5.https://doi.org/10.1371/journal.pone.0008898
Padmanabhan J, Levy M, Dickson DW, Potter H (2006) Alpha1-antichymotrypsin, an inflammatory protein overexpressed in Alzheimer’s disease brain, induces tau phosphorylation in neurons. Brain 129:3020–3034. https://doi.org/10.1093/brain/awl255
Patel H, Hodges AK, Curtis C et al (2019) Transcriptomic analysis of probable asymptomatic and symptomatic alzheimer brains. Brain Behav Immun 80:644–656. https://doi.org/10.1016/j.bbi.2019.05.009
Piras IS, Krate J, Delvaux E et al (2019) Transcriptome Changes in the Alzheimer’s Disease Middle Temporal Gyrus: Importance of RNA Metabolism and Mitochondria-Associated Membrane Genes. J Alzheimer’s Dis 70:691–713. https://doi.org/10.3233/JAD-181113
Readhead B, Haure-Mirande JV, Funk CC et al (2018) Multiscale Analysis of Independent Alzheimer’s Cohorts Finds Disruption of Molecular, Genetic, and Clinical Networks by Human Herpesvirus. Neuron 99:64-82.e7. https://doi.org/10.1016/j.neuron.2018.05.023
Saiz-Sanchez D, Ubeda-Bañon I, de la Rosa-Prieto C et al (2010) Somatostatin, tau, and β-amyloid within the anterior olfactory nucleus in Alzheimer disease. Exp Neurol 223:347–350. https://doi.org/10.1016/j.expneurol.2009.06.010
Sandoval K, Umbaugh D, House A et al (2019) Somatostatin Receptor Subtype-4 Regulates mRNA Expression of Amyloid-Beta Degrading Enzymes and Microglia Mediators of Phagocytosis in Brains of 3xTg-AD Mice. Neurochem Res 44:2670–2680. https://doi.org/10.1007/s11064-019-02890-6
Sassi C, Guerreiro R, Gibbs R et al (2014) Investigating the role of rare coding variability in Mendelian dementia genes (APP, PSEN1, PSEN2, GRN, MAPT, and PRNP) in late-onset Alzheimer’s disease. Neurobiol Aging 35:2881.e1-2881.e6. https://doi.org/10.1016/j.neurobiolaging.2014.06.002
Scacchi R, Gambina G, Moretto G, Corbo RM (2009) Variability of AChE, BChE, and ChAT genes in the late-onset form of Alzheimer’s disease and relationships with response to treatment with Donepezil and Rivastigmine. Am J Med Genet Part B Neuropsychiatr Genet 150B:502–507. https://doi.org/10.1002/ajmg.b.30846
Schrötter A, Pfeiffer K, El Magraoui F et al (2012) The amyloid precursor protein (APP) family members are key players in S-adenosylmethionine formation by MAT2A and modify BACE1 and PSEN1 gene expression-relevance for Alzheimer’s disease. Mol Cell Proteomics 11:1274–1288. https://doi.org/10.1074/mcp.M112.019364
Sharoar MG, Yan R (2017) Effects of altered RTN3 expression on BACE1 activity and Alzheimer’s neuritic plaques. Rev Neurosci 28:145–154. https://doi.org/10.1515/revneuro-2016-0054
Shinohara M, Tachibana M, Kanekiyo T, Bu G (2017) Role of LRP1 in the pathogenesis of Alzheimer’s disease: evidence from clinical and preclinical studies. J Lipid Res 58:1267–1281. https://doi.org/10.1194/jlr.R075796
Silva ART, Grinberg LT, Farfel JM et al (2012) Transcriptional alterations related to neuropathology and clinical manifestation of Alzheimer’s disease. PLoS One 7. https://doi.org/10.1371/journal.pone.0048751
Sood S, Gallagher IJ, Lunnon K et al (2015) A novel multi-tissue RNA diagnostic of healthy ageing relates to cognitive health status. Genome Biol 16. https://doi.org/10.1186/s13059-015-0750-x
Stopa EG, Tanis KQ, Miller MC et al (2018) Comparative transcriptomics of choroid plexus in Alzheimer’s disease, frontotemporal dementia and Huntington’s disease: Implications for CSF homeostasis. Fluids Barriers CNS 15.https://doi.org/10.1186/s12987-018-0102-9
Tan MG, Chua WT, Esiri MM et al (2010) Genome wide profiling of altered gene expression in the neocortex of Alzheimer’s disease. J Neurosci Res 88:1157–1169. https://doi.org/10.1002/jnr.22290
Tyagi E, Fiorelli T, Norden M, Padmanabhan J (2013) Alpha 1-antichymotrypsin, an inflammatory protein overexpressed in the brains of patients with Alzheimer’s disease, induces Tau hyperphosphorylation through c-Jun N-terminal kinase activation. Int J Alzheimers Dis 2013:1–12. https://doi.org/10.1155/2013/606083
von Mering C, Huynen M, Jaeggi D et al (2003) STRING: a database of predicted functional associations between proteins. Nucleic Acids Res 31:258–261
Wang T, Chen J, Hou Y et al (2019) BAP31 deficiency contributes to the formation of amyloid-b plaques in Alzheimer’s disease by reducing the stability of RTN3. FASEB J 33:4936–4946. https://doi.org/10.1096/fj.201801702R
Webster JA, Gibbs JR, Clarke J et al (2009) Genetic Control of Human Brain Transcript Expression in Alzheimer Disease. Am J Hum Genet 84:445–458. https://doi.org/10.1016/j.ajhg.2009.03.011
Williams C, Shai RM, Wu Y et al (2009) Transcriptome analysis of synaptoneurosomes identifies neuroplasticity genes overexpressed in incipient Alzheimer’s disease. PLoS One 4.https://doi.org/10.1371/journal.pone.0004936
Wojsiat J, Laskowska-Kaszub K, Alquézar C et al (2017) Familial Alzheimer’s Disease Lymphocytes Respond Differently Than Sporadic Cells to Oxidative Stress: Upregulated p53–p21 Signaling Linked with Presenilin 1 Mutants. Mol Neurobiol 54:5683–5698. https://doi.org/10.1007/s12035-016-0105-y
Zhang S, Janciauskiene S (2002) Multi-functional capability of proteins: α1-antichymotrypsin and the correlation with Alzheimer’s disease. J Alzheimer’s Dis 4:115–122. https://doi.org/10.3233/JAD-2002-4206
Zhou J, Li X-M, Jiang T et al (2013) Lack of association between COMT Val158Met polymorphism and late-onset Alzheimer’s disease in Han Chinese. Neurosci Lett 554:162–166. https://doi.org/10.1016/J.NEULET.2013.09.006
Acknowledgements
We thank the Pharmacological Modelling and Simulation Centre (PMSC) and members of M.S. Ramaiah University of Applied Sciences, Bangalore, for their support throughout the work.
Author information
Authors and Affiliations
Contributions
GNS analyzed the data and drafted the manuscript. GRS and R Burri supervised the work and finalized the manuscript.
Corresponding author
Ethics declarations
Ethics Approval and Consent to Participate
NA
Consent for Publication
NA
Competing Interests
The authors declare that they have no competing interests.
Additional information
Publisher's Note
Springer Nature remains neutral with regard to jurisdictional claims in published maps and institutional affiliations.
Highlights
•Thirty-two AD-specific GEO datasets were screened based on FDR p-value and log FC
•Nine DEGs were commonly found in more than 60% of the selected AD datasets
•Five DEGs interacted with BACE1, GRIN2B, APP, APOE, COMT, PSEN1, INS, NEP and MAPT proteins
•BDNF, SST, RTN3 and RSG4 were downregulated, and SERPINA3 was upregulated
•KEGG analysis of DEGs revealed a link with PI3K, G protein and trans-synaptic pathways
Rights and permissions
About this article

Cite this article
GNS, H.S., Rajalekshmi, S.G. & Burri, R.R. Revelation of Pivotal Genes Pertinent to Alzheimer’s Pathogenesis: A Methodical Evaluation of 32 GEO Datasets. J Mol Neurosci 72, 303–322 (2022). https://doi.org/10.1007/s12031-021-01919-2
Received:
Accepted:
Published:
Issue Date:
DOI: https://doi.org/10.1007/s12031-021-01919-2