
Abstract
Sustainable forest management heavily relies on the accurate estimation of tree parameters. Among others, the diameter at breast height (DBH) is important for extracting the volume and mass of an individual tree. For systematically estimating the volume of entire plots, airborne laser scanning (ALS) data are used. The estimation model is frequently calibrated using manual DBH measurements or static terrestrial laser scans (STLS) of sample plots. Although reliable, this method is time-consuming, which greatly hampers its use. Here, a handheld mobile terrestrial laser scanning (HMTLS) was demonstrated to be a useful alternative technique to precisely and efficiently calculate DBH. Different data acquisition techniques were applied at a sample plot, then the resulting parameters were comparatively analysed. The calculated DBH values were comparable to the manual measurements for HMTLS, STLS, and ALS data sets. Given the comparability of the extracted parameters, with a reduced point density of HTMLS compared to STLS data, and the reasonable increase of performance, with a reduction of acquisition time with a factor of 5 compared to conventional STLS techniques and a factor of 3 compared to manual measurements, HMTLS is considered a useful alternative technique.
Introduction
Forest inventories are necessary to provide comprehensive information about the state, functioning and dynamics of forests for the management and planning of ecosystems, operational forest management, estimation of deforestation in tropical forests (Coomes et al. 2017) and decision-making. Large-scale forest inventories are primarily supported by the acquisition of airborne laser scanning point clouds (Jayathunga et al. 2018). Forest parameters such as tree species, diameter at breast height (DBH), tree height and biomass are frequently estimated using various techniques such as non-parametric models (Shang et al. 2016), area-based or tree-centered techniques (Coomes et al. 2017), or the projection of a probability density function (Wilkes et al. 2016). In many cases, the estimation of these parameters is based on the definition of a plot sample or calibration data set (Wallace et al. 2016). A sample plot is a small forest area where data and forest information are systematically collected for further assessment and analysis of larger spatial scales (Melville et al. 2015). The conventional technique to acquire these data sets is to manually perform stem size measurements. The use of static terrestrial laser scanning (STLS) has also been demonstrated to be a precise tool for collecting terrestrial point cloud data in a forest environment (Liang et al. 2016).
Static terrestrial laser scanning
Static terrestrial laser scanning (STLS) can be described as a highly automated, active remote sensing technique in which the entire environment is measured from a fixed position using a laser scanner. Laser scanning or light detection and ranging (LiDAR) uses laser technology to measure an object and its surroundings to obtain a point cloud in which the position of each point is unambiguously defined in an absolute or relative three-dimensional space.
Laser scanning for forestry applications is divided into two technology classes based on the used technique to measure the range: (1) pulse-based or Time-of-Flight (ToF), (2) continuous wave (CW) or phase shift (PS) (Petrie et al. 2018). With ToF laser scanners, precise timing is used. This type of scanners uses a very accurate clock mechanism to determine the time difference between the transmission of an electromagnetic signal and the registration of the laser pulse echo after reflection. The distance from the center of the laser scanner to the reflection surface is then calculated by multiplying the time difference of the single journey with the assumed propagation speed of light (Boehler and Marbs 2003). The PS (or CW) scanners continuously emit a periodical signal of moderate intensity. Distances are calculated based on the difference in phase between the emitted and reflected waves. To solve the ambiguity in the range estimation, multiple frequencies are used simultaneously. For both the ToF and PS scanners, the vertical and horizontal angles are registered with the broadcast of the laser signal. Through the known direction of the emitted laser beam and the distance between two objects, laser scanning allows the measurement of 3D cartesian coordinates of an object’s surface in a given space (Fassi et al. 2013; Faltýnová et al. 2016). Laser scanners provide very high density and very high-quality point clouds, typically with a speed of 100 kHz to 1 MHz and even more, with subcentimeter accuracy (González-Jorge et al. 2017; Petrie et al. 2018). The accuracy of the measured points is directly dependent on the accuracy of the platform, but it is also related to other factors such as range, angular increment and additional parameters (Telling et al. 2017).
The use of STLS to determine individual parameters in plot samples of forest inventories has been extensively researched in the past decade, e.g., for measuring wood volume (Dassot et al. 2012), estimation of biomass (Hauglin et al. 2013; Stovall and Shugart 2018), leaf normal distributions (Jin et al. 2016) or tree stem diameter and tree height (Lovell et al. 2011; Olofsson et al. 2014). Furthermore, key structural characteristics of the fauna beneath the canopy are determined, making these measurements valuable to use as reference data to calibrate ALS data (Hancock et al. 2017).
Notwithstanding the usefulness of STLS data, Liang et al. (2016) concluded that this technique has not been accepted as a standardized operational tool in forest inventories since the modeling of tree parameters is time-consuming. Furthermore, the logistical complexity and relatively high cost of TLS remain major obstacles for the full implementation of this technique. The practical difficulties of transporting and setting-up the scanner make its use challenging and time-consuming, even more so in challenging environments (e.g., steep slopes, rough terrain).
Mobile terrestrial laser scanning
One of the main limitations of STLS is the need for a multi-station approach to avoid occlusion, which occurs when the target area is scanned only from one set-up station. However, the multi-station approach requires pre-scan preparations (e.g., target placement, scan-station selection) and post-scan processing (e.g., aligning and merging the point clouds). These processing steps influence the effectiveness of STLS, mainly its time-efficiency. Over the years, research has focused on placing the STLS on a moving platform by combining it with inertial measurement units (IMU) and global navigation satellite system (GNSS) receivers (Guan et al. 2016; Zhao et al. 2017). To enable acquisition in rough terrain, the operator functions as a platform, utilising a handheld MTLS. The main advantages of a handheld MTLS are the reduction in acquisition time compared to STLS and a resolution advantage over ALS (Bauwens et al. 2016).
The data points captured by the handheld laser scanner are accurately located by a combination of an inertial navigation system (INS) and 3D simultaneous localization and mapping (SLAM). The INS consists of a series of IMUs (gyroscope and accelerometers) to determine the followed trajectory. Since this system involves distortions, the system has to combine these measurements with the SLAM algorithm. The six degrees of freedom (translation and rotation) movement of the sensor can be estimated accurately using this algorithm (Bosse et al. 2012). SLAM was originally developed by Leonard and Durrant-Whyte (1991), based on a previous study by (Smith et al. 1990). The basis of this algorithm is the extended Kalman filter (EKF) that determines the trajectory adjustment based on the recognized environmental elements. When the mobile platform is moved to a new position, environmental elements are extracted from the acquired 3D data set. If an element is observed at multiple positions, the EKF calculates, based on conformity, an adaptation to the current position of the mobile platform, which had already been determined by the INS (Bailey and Durrant-Whyte 2006). A schematic representation of the iterative SLAM algorithm can be found in Fig. 1.
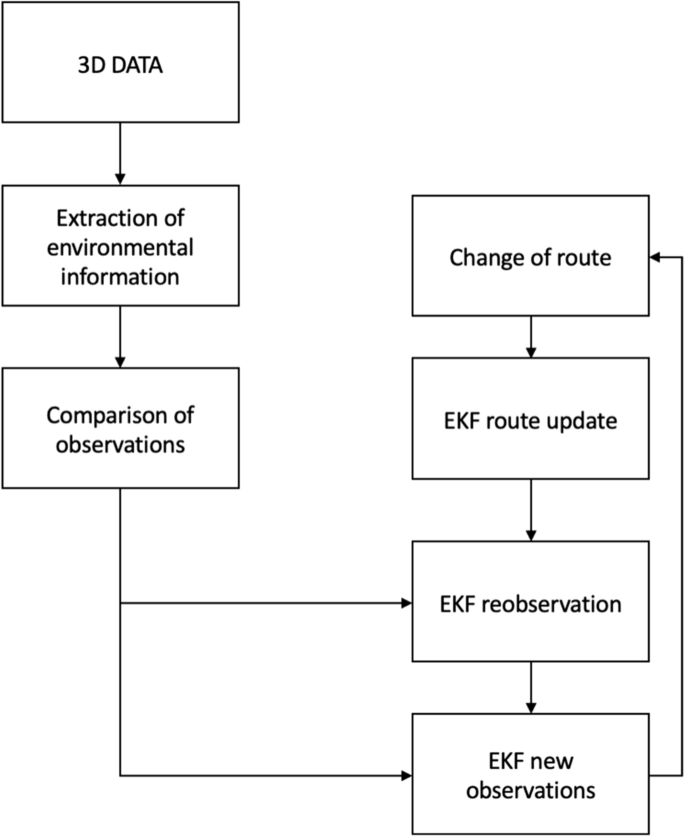
Workflow of the 3D simultaneous localization and mapping (SLAM) algorithm used to acquire point clouds in real-time using the handheld mobile terrestrial laser scanner
During data acquisition, the algorithm analyses a certain time interval, after which the time window is shifted sequentially according to a portion of its length. The analysis of each specific time window is an iterative process, closely related to the iterative closest point (ICP) algorithm. The ICP algorithm iteratively minimizes the distance between two different point clouds based on overlapping observations. Unlike this single transformation, the above approach describes a continuous range. The algorithm used searches for corresponding areas of points between two separate time intervals and, consequently, two separate recording positions. Next, the path followed by the platform, already known because of the used INS, is corrected by minimizing the deviations between these corresponding surfaces (Bosse et al. 2012).
Airborne laser scanning
Airborne laser scanning (ALS), a popular 3D data acquisition technique for urban and rural environmental modeling (Doneus et al. 2008; Oude Elberink and Vosselman 2011; Stal et al. 2013), allows the measurement of a 3D point cloud representing the area of interest by irradiating it with a laser beam from an airborne platform (Baltsavias 1999). It is widely used to collect data for forest inventories and was extensively described by Hauglin et al. (2013), who defined two general approaches: area-based and single-tree. The main advantage of airborne laser scanning is the data acquisition rate: the inventory of large areas can be acquired in a short time. The downside of this approach is the lower point density compared to other terrestrial laser scanning techniques.
Research goals
The objective of this study was to assess the performance of different measuring techniques to determine tree DBH with a focus on both comparability of the resulting parameters with the standard technique of manual measurements and the total time required for both data acquisition and data processing. More specifically, data were collected using manual measurements, handheld MTLS, STLS, and ALS. Given these techniques, the question arises whether the resulting DBH values are statistically equivalent when applied on a test site. In the next section, an overview of the research site, acquisition equipment, and processing techniques are elaborated. Then we extensively compare the four techniques and their respective performance in determining DBH and discuss the advantages and disadvantages of the different techniques.
Materials and methods
Study area
The study area is a plot of forest in Opwijk, a municipality approximately 20 km northwest of Brussels, Belgium (50°57′ N, 4°10′ E). The forest consists of planted Canadian poplars (Populus xcanadensis) in an approximately regular grid with an interval of 4–5 m (Fig. 2). A target area of 35 m × 35 m was chosen to capture the DBH. The trees in the plot are approximately 40 m tall. Only stems with DBH larger than 0.3 m were examined. A situation map and detail of the test site are presented in Fig. 3.

Image of the study area and the Leica ScanStation P40 Time-of-Flight (ToF) laser scanner

The test site in Opwijk, Belgium (red flag, left panel) and plot sample (red polygon, right panel)
Static terrestrial laser scanner
A Leica ScanStation P40 Time-of-Flight (ToF) laser scanner was employed for the static laser scanning. The scanner has an operating range of up to 270 m. The field of view is 360° horizontally by 290° vertically. Data were acquired at a rate of 1 million points/s. The on-board camera makes it possible to assign a true-color RGB value to each 3D point. According to the specifications (Table 1), the accuracy is 3 mm in position at a distance of 50 m (Leica 2017).
To minimize occlusion and allow efficient data acquisition and extraction of the forest attributes, a multi-scan technique was applied (Bienert et al. 2006). Liang et al. (2016) showed that data redundancy due to multiple scanning locations leads to higher effectiveness of up to 32% identified trees than when a single-scan method is used. However, this approach has a high operational cost and complex data registration with additional scan preparations. For this study, three scans were obtained. The location of the scans is illustrated in Fig. 4. Registration of the different scans and georeferencing in an absolute coordinate reference system are facilitated by the use of black-and-white targets. The targets are spread around the area and measured from different stations (Fig. 2).
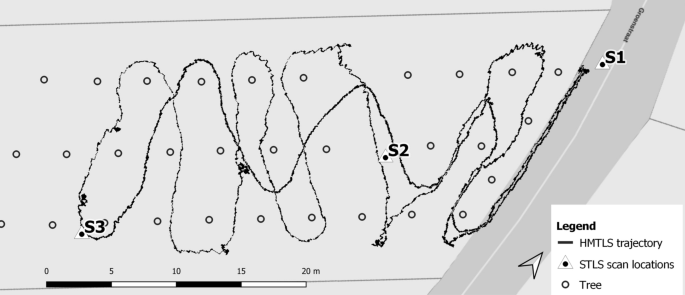
Static terrestrial laser scanning (STLS) scan locations and handheld mobile terrestrial laser scanning (HMTLS) trajectory in the forest (background: Flanders Information Agency)
Handheld mobile terrestrial laser scanning
Handheld mobile terrestrial laser scanning (HMTLS) provides high mobility, limited operational cost and reduced data collection time. Here we describe the operational features of the GeoSLAM Zeb1 platform, examined using a forest inventory test case and Computree 3.0 software (Piboule et al. 2013). (See Table 1 for the specifications, Fig. 5 for image and components.) The scanner has been introduced by Bosse et al. (2012). The system consists of a 2D laser scanner and an INS, both mounted on a spring. The laser scanner is a Hokuyo UTM-30LX, which is a 2D time-of-flight laser scanner with a 270° field of view. The laser has a maximum range of 30 m indoors and 15 m outdoors. The built-in INS is a MicroStrain 3DM-GX2 and consists of a triaxial MEMS gyroscope and accelerometers. These sensors provide data along the three motion axes at an output rate of 100 Hz. Finally, the platform is equipped with a battery with 5 h for continuous use.

GeoSLAM ZEB1 handheld mobile laser scanner
All data were captured and automatically recorded within 12 min. The trajectory path is visualized in Fig. 4. As indicated in this figure, the principle of loop closing was used to minimize the drift in the system’s INS measurements.
Airborne laser scanning
In Belgium, the different regions are responsible for their own authentic digital elevation models (DEM). In the Flemish Region, the first systematic acquisition of ALS point clouds took place between 2001 and 2004, resulting in a point sample density of at least 1 point per 4 m‒2 (Werbrouck et al. 2011). The second and latest version of the model, also with regional coverage, was acquired between 2013 and 2015, with about 16 points m‒2. As with the Dutch data, this model has an imposed accuracy of 0.10 m in planimetry and 0.05 m in altimetry (Roelens et al. 2016). The DHMVlaanderen DEM is available on the Flemish portal for spatial open data (www.geopunt.be) at a resolution of up to 1.0 m (Coordinate Reference System: planimetry: Belgian Lambert’72, EPGS:31,370); altimetry: Ostend lowest sea level, second general leveling or TAW, equipotential surface ca. 1.5 m below EGM96, EPGS:5110).
Point cloud processing
The acquisition methods were statistically analyzed based on the planimetric DBH of individual trees. The DBH is defined as the tree diameter 1.30 m above the ground (Olofsson et al. 2014). The terrestrial data sets were filtered from statistical outliers using the Statistical Outlier Removal (SOR) tool in CloudCompare (2020). Laser scans typically generate point cloud data sets of varying point densities. Additionally, measurement errors lead to sparse outliers that corrupt the results even more. Some of these irregularities can be solved using a statistical analysis of each point’s neighbourhood. For each point, the average distance to its nearest neighbours is computed. We assumed here that the distances follow a Gaussian distribution. Points with distances above the average distance plus the standard deviation on the distances are rejected from the data set. Approximately 94% of the original STLS data set and 96% of the HMTLS point cloud were conserved, resulting in the point cloud extractions shown in Figs. 6, 7.

Side view of merged plot samples generated by static terrestrial laser scanning (STLS). The scanning stations S1–S3 are indicated

Side view of plot sample generated by handheld mobile terrestrial laser scanning (HMTLS; colors: time scale with a maximum range of 12 min, which is equal to the duration of the scan)
Given the relatively low point density of the ALS data set, compared to the terrestrial counterparts, we decided to derive the DBH from the ALS data using the projection of a horizontal box with a height of 1.5 m. Based on the classification of the point cloud (ground versus non-ground), the height above the ground for each non-ground point was calculated. All points outside the interval (0.55 m < distance < 2.05 m) were removed, whereas the remaining points were clustered using connected component analysis. The resulting clusters are considered trees, for which each point is projected in a plane (i.e., by removing the z-ordinate). The tree coordinates and DHB are derived using iterative circle fitting, allowing the elimination of outliers in the horizontal plane (Maisonobe 2007).
Parameter extraction using point clouds
Tree parameters based on the point clouds measured with the Leica ScanStation P40 STLS and the GeoSLAM Zeb1 HMTLS are extracted using similar parameters in the Computree 3.0 open software (GPL/LGPL) developed by the Office National des Forêts (ONF) in France (Piboule et al. 2013). The program is specifically focused on the analysis of forest areas based on 3D point clouds. Tree isolation is obtained by a stepwise algorithm based on a data clustering methodology followed by a skeletonization step (Othmani et al. 2011).
The stepwise modulation resulting in stem position and DBH calculation was completed as described by Othmani et al. (2011). For each stem, a circle was fitted on the cluster of points between 1.0 m and 1.3 m. Then a linear regression was computed for the diameter of these modulated circles toward the height value. Outliers were iteratively removed and the linear regression fitted again. The stem DBH was computed from the fitted model; the stem position was defined as the centre of this model.
Results
The calculated DBHs are presented in Table 2 for each measurement technique. Figures 6, 7 show the point clouds produced by STLS and HMTLS, respectively. The figures indicate the differing point cloud density. While the STLS contains ca. 10.500 points m‒2, HMTLS produced a point cloud with a point density of approximately 4000 points m‒2.
To optimize spatial coherence between the different data sets, the orientation and positioning of the handheld scanner data were fine-tuned based on the HMTLS data. This process comprises a 3D transformation that is calculated using ICP. This transformation resulted in an RMSE being 0.014 m along the x-axis and 0.006 m along the y-axis, resulting in an overall planimetric RMSExy of 0.015 m. The mean deviation of the total trajectory is equal to 0.030 m and corresponds to the systematic error of the system. Note that the resulting error in position manifests itself in one particular direction. The continuous deviation in position is due to the increasing drift with increasing length of the path. The manufacturer of the handheld scanner intends a maximum absolute error in position between 0.030 m and 0.400 m. Thus, this survey met the assumed accuracy, also confirmed by previous research (Ryding et al. 2015). Differences in DBH are analyzed in the following section.
DBH comparison
The statistical analysis was based on the standard technique as described in the citation classic (Bland and Altman 1986). While manual DBH measurements are assumed to be the golden standard, this does not mean that it is the true value, since the manual measurements are also subject to measurement errors. Due to these measurement errors, the between-method differences are expected to be correlated. To enable between-method comparison, the differences between the measurement and the golden standard are plotted against the average of both measurements of each tree (see Fig. 9).
Starting with a scatter plot of the data of two methods and drawing the line of equality, the first indications of a trend in deviation become visible. The non-diagonal panels in Fig. 8 indicate agreement between two subsequent techniques that are named in the corresponding row and column labels. In the case that all data points would lie on the line of equality, then the different measuring techniques would result in the same acquired values. A second remark refers to the given correlation coefficients (Table 3), while these values appear to be high, they only indicate the strength of the relation, but not the agreement between the data points. A perfect agreement only exists when the points lie on the line of equality. From the plots in Fig. 8, the measured values from both HMTLS and STLS appear to be near the manual measurements. The ALS data contain more variance compared to the other laser scanning techniques. The HMTLS data appear to be slightly though systematically underestimating the manually measured values, while the STLS data, in turn, appear to be overestimates. For the ALS data, no constant under- or overestimation was observed.

Correlation matrix for the different measuring techniques (units in meters)
While Fig. 8 provides information regarding the measurement techniques, between-method differences plots can provide more information. For the comparison of the different techniques, Fig. 9 is given, in which each laser scanning technique is compared to the manual measurement. We assumed the manual measurements to be the golden standard. The difference against the mean measured value of each tree can provide us with more detailed information.

Between-method differences (units in meters)
From Fig. 9a, a small two-sigma band on the mean difference (mean = − 0.025 m, SD = 0.018 cm) for the manual measurements versus the handheld scanning measurements was observed. The spread of the differences over a changing average did not indicate a clear relation. For Fig. 9b, plotting the manual versus STLS values, we observe a wider two-sigma band (mean = 0.035 m, SD = 0.034 m), but the main observation here is the indication of a correlation between tree diameter and the variation on the difference, indicating a rising variation. For Fig. 9c, a positive correlation is implied between DBH and observed differences. The width of the two sigma band (mean = 0.000 m, SD = 0.040 m) could be induced by the low resolution of the airborne data, as described in the methods section, we project all data points in a vertical bandwidth on one surface, instead of explicitly measuring the tree diameter at BH. For the mean difference and the respective standard deviations, supplemented with the standard error, Table 4 is given. Finally, we refer to the diagonals in Fig. 8, indicating a normal distribution of the DBH of the sample trees. (For more information regarding the applied method for statistical analysis, refer to (Altman and Bland 1983, 1987; Bland and Altman 1992).
Conclusions
Our results demonstrated that handheld mobile laser scanning platforms can be used as a versatile forest inventory platform. Using the Computree 3.0 software (LGPL) developed by the Office National des Forêts (ONF), we extracted stem position and DBH from the GeoSLAM ZEB1 HMTLS point cloud and compared the values to those derived from the Leica ScanStation P40 STLS. The resulting point cloud of the HMTLS platform was characterized by a lower point density than STLS. Nevertheless, the model resulted in a root mean square error (RMSE) of the planimetric stem position of 0.015 m and the DBH of 0.024 m. The compactness of the platform and efficient data acquisition allows capturing more extensive coverage per time than current techniques. In this case, the HMTLS platform is five times more efficient for time than the tested STLS platform in supplying a resulting point cloud. For larger-scale forest inventories, this difference will substantially increase efficiency in absolute time measures. Due to the lower point density of the HMTLS data, post-processing time was also reduced compared to the time required for the STLS data. Notwithstanding this lower point density, the calculated DBH values did not suffer from information loss.
This research proves the potential of mobile laser scanning for estimating the parameters used in forest inventories. The limited loss in the number of data points is negligible relative to the increased efficiency in data collection and low operational cost. Improvements in hardware technology and registering algorithms should reduce the noise seen within the HMTLS point cloud, which will decrease the estimated DBH RMSE below 0.025 m.
References
Altman DG, Bland JM (1983) Measurement in medicine: the analysis of method comparison studies. Stat 32:307. https://doi.org/10.2307/2987937
Altman DG, Bland JM (1987) Statistical methods for assessing agreement between measurement. Biochimica 11:399–404
Bailey T, Durrant-Whyte H (2006) Simultaneous localization and mapping (SLAM): part II. IEEE Robot Autom Mag 13:108–117. https://doi.org/10.1109/MRA.2006.1678144
Baltsavias EP (1999) Airborne laser scanning: basic relations and formulas. ISPRS J Photogramm Remote Sens 54:199–214. https://doi.org/10.1016/S0924-2716(99)00015-5
Bauwens S, Bartholomeus H, Calders K, Lejeune P (2016) Forest inventory with terrestrial LiDAR: a comparison of static and hand-held mobile laser scanning. Forests 7:127. https://doi.org/10.3390/f7060127
Bienert A, Maas H, Scheller S (2006) Analysis of the information content of terrestrial laserscanner point clouds for the automatic determination of forest inventory parameters. In: Workshop on 3D remote sensing in forestry. pp 1–7
Bland JM, Altman DG (1992) Comparing methods of clinical measurement - a citation-classic. Curr Contents / Clin Med 5:8
Bland JM, Altman DG (1986) Statistical methods for assessing agreement between two methods of clinical measurements. Lancet 327:307–310. https://doi.org/10.1016/S0140-6736(86)90837-8
Boehler W, Marbs A (2003) Investigating laser scanner accuracy. Int Arch Photogramm Remote Sens Spat Inf Sci 34:696–701. https://doi.org/10.1002/pbc.ABSTRACT
Bosse M, Zlot R, Flick P (2012) Zebedee: design of a spring-mounted 3-D range sensor with application to mobile mapping. IEEE Trans Robot 28:1104–1119
Coomes DA, Dalponte M, Jucker T, Asner GP, Banin LF, Burslem DFRP, Lewis SL, Nilus R, Phillips OL, Phua MH, Qie L (2017) Area-based vs tree-centric approaches to mapping forest carbon in Southeast Asian forests from airborne laser scanning data. Remote Sens Environ 194:77–88. https://doi.org/10.1016/j.rse.2017.03.017
Dassot M, Colin A, Santenoise P, Fournier M, Constant T (2012) Terrestrial laser scanning for measuring the solid wood volume, including branches, of adult standing trees in the forest environment. Comput Electron Agric 89:86–93. https://doi.org/10.1016/j.compag.2012.08.005
Doneus M, Briese C, Fera M, Janner M (2008) Archaeological prospection of forested areas using full-waveform airborne laser scanning. J Archaeol Sci 35:882–893. https://doi.org/10.1016/j.jas.2007.06.013
Faltýnová M, Matoušková E, Šedina J, Pavelka K (2016) Building facade documentation using laser scanning and photogrammetry and data implementation into BIM. Int Arch Photogramm Remote Sens Spat Inf Sci 41:215–220. https://doi.org/10.5194/isprsarchives-XLI-B3-215-2016
Fassi F, Fregonese L, Ackermann S, De Troia V (2013) Comparison between laser scanning and automated 3D modeling techniques to resconstruct complex and extensive cultural heritage areas. Int Arch Photogramm Remote Sens Spat Inf Sci 5(W1):73–80
Girardeau-Montaut D (2020) CloudCompare (3D point cloud and mesh processing software Open Source Project),available at: https://www.cloudcompare.org/
González-Jorge H, Rodríguez-Gonzálvez P, Shen YQ, Lagüela S, Diaz-Vilarino L, Lindenbergh R, Gonzalez-Aguilera D, Arias P (2017) Metrological intercomparison of six terrestrial laser scanning systems. IET Sci Meas Technol 12:218–222
Guan HY, Li J, Cao S, Yu YT (2016) Use of mobile LiDAR in road information inventory. Int J Image Data Fusion 7:219–242. https://doi.org/10.1080/19479832.2016.1188860
Hancock S, Anderson K, Disney M, Gaston KJ (2017) Measurement of fine-spatial-resolution 3D vegetation structure with airborne waveform lidar: calibration and validation with voxelised terrestrial lidar. Remote Sens Environ 188:37–50. https://doi.org/10.1016/J.RSE.2016.10.041
Hauglin M, Dibdiakova J, Gobakken T, Næsset E (2013) Estimating single-tree branch biomass of Norway spruce by airborne laser scanning. ISPRS J Photogramm Remote Sens 79:147–156. https://doi.org/10.1016/j.isprsjprs.2013.02.013
Jayathunga S, Owari T, Tsuyuki S (2018) Analysis of forest structural complexity using airborne LiDAR data and aerial photography in a mixed conifer–broadleaf forest in northern Japan. J For Res 29(2):479–493. https://doi.org/10.1007/s11676-017-0441-4
Jin S, Tamura M, Susaki J (2016) A new approach to retrieve leaf normal distribution using terrestrial laser scanners. J For Res 27(3):631–638. https://doi.org/10.1007/s11676-015-0204-z
Leica (2017) Leica-Geosystems: ScanStation P30/P40 specifications. https://leica-geosystems.com. Accessed 15 April 2020
Leonard JJ, Durrant-Whyte HF (1991) Mobile robot localization by tracking geometric beacons. IEEE Trans Robot Autom 7:376–382. https://doi.org/10.1109/70.88147
Liang XL, Kankare V, Hyyppä J, Wang YS, Kukko A, Haggrén H, Yu XW, Kaartinen H, Jaakkola A, Guan FY, Holopainen M, Vastaranta M (2016) Terrestrial laser scanning in forest inventories. ISPRS J Photogramm Remote Sens 115:63–77. https://doi.org/10.1016/j.isprsjprs.2016.01.006
Lovell JL, Jupp DLB, Newnham GJ, Culvenor DS (2011) Measuring tree stem diameters using intensity profiles from ground-based scanning lidar from a fixed viewpoint. ISPRS J Photogramm Remote Sens 66:46–55. https://doi.org/10.1016/j.isprsjprs.2010.08.006
Maisonobe L (2007) Finding the circle that best fits a set of points. In: https://www.spaceroots.org/
Melville GJ, Welsh AH, Stone C (2015) Improving the efficiency and precision of tree counts in pine plantations using airborne LiDAR data and flexible-radius plots: model-based and design-based approaches. J Agric Biol Environ Stat 20:229–257. https://doi.org/10.1007/s13253-015-0205-6
Olofsson K, Holmgren J, Olsson H (2014) Tree stem and height measurements using terrestrial laser scanning and the RANSAC algorithm. Remote Sens 6:4323–4344. https://doi.org/10.3390/rs6054323
Othmani A, Piboule A, Krebs M, Stolz C, Lew Yan Voon LFC (2011) Towards automated and operational forest inventories with T-Lidar. 11th International conference on LiDAR applications for assessing forest ecosystems (SilviLaser 2011), Oct. 16‒19—Hobart, Australia. https://hal.archives-ouvertes.fr/hal-00646403
Oude Elberink S, Vosselman G (2011) Quality analysis on 3D building models reconstructed from airborne laser scanning data. ISPRS J Photogramm Remote Sens 66:157–165. https://doi.org/10.1016/j.isprsjprs.2010.09.009
Petrie G, Toth CK, Toth CK (2018) Terrestrial laser scanners. In: Topographic laser ranging and scanning. CRC Press, Second edition. Boca Raton : Taylor and Francis, CRC Press, 2018, pp 29–88
Piboule A, Krebs M, Esclatine L, Hervé J (2013) Computree: a collaborative platform for use of terrestrial lidar in dendrometry. In: Proceedings of the International IUFRO Conference MeMoWood. Nancy, pp 1–4
Roelens J, Dondeyne S, Van Orshoven J, Diels J (2016) Extracting cross sections and water levels of vegetated ditches from LiDAR point clouds. Int J Appl Earth Obs Geoinf 53:64–75. https://doi.org/10.1016/j.jag.2016.08.003
Ryding J, Williams E, Smith M, Eichhorn M (2015) Assessing handheld mobile laser scanners for forest surveys. Remote Sens 7:1095–1111. https://doi.org/10.3390/rs70101095
Shang C, Jones T, Treitz P (2016) Effect of size and number of calibration plots on the estimation of stem diameter distributions using airborne laser scanning. In: International geoscience and remote sensing symposium (IGARSS). Institute of Electrical and Electronics Engineers Inc., pp 1753–1756
Smith R, Self M, Cheeseman P (1990) Estimating uncertain spatial relationships in robotics. Autonomous robot vehicles. Springer, New York, pp 167–193
Stal C, Tack F, De Maeyer P, De Wulf A, Goossens R (2013) Airborne photogrammetry and lidar for DSM extraction and 3D change detection over an urban area—a comparative study. Int J Remote Sens 34:1087–1110. https://doi.org/10.1080/01431161.2012.717183
Stovall AEL, Shugart HH (2018) Improved biomass calibration and validation with terrestrial LiDAR: implications for future LiDAR and SAR missions. EEE J Sel Top Appl Earth Obs Remote Sens 11:3527–3537
Telling J, Lyda A, Hartzell P, Glennie C (2017) Review of earth science research using terrestrial laser scanning. Earth-Science Rev 169:35–68. https://doi.org/10.1016/J.EARSCIREV.2017.04.007
Wallace L, Lucieer A, Malenovský Z, Turner D, Vopenka P (2016) Assessment of forest structure using two UAV techniques: a comparison of airborne laser scanning and structure from motion (SfM) point clouds. Forests 7(3):62. https://doi.org/10.3390/f7030062
Werbrouck I, Antrop M, Van Eetvelde V, Stal C, De Maeyer P, Bats M, Bourgeois J, Court-Picon M, Crombé P, De Reu J, De Smedt P, Finke PA, Van Meirvenne M, Verniers J, Zwertvaegher A (2011) Digital elevation model generation for historical landscape analysis based on LiDAR data, a case study in Flanders (Belgium). Expert Syst Appl 38:8178–8185. https://doi.org/10.1016/j.eswa.2010.12.162
Wilkes P, Jones SD, Suarez L, Haywood A, Mellor A, Woodgate W, Soto-Berelov M, Skidmore AK (2016) Using discrete-return airborne laser scanning to quantify number of canopy strata across diverse forest types. Methods Ecol Evol 7:700–712. https://doi.org/10.1111/2041-210X.12510
Zhao GY, Lian M, Li YY, Duan Z, Zhu SM, Mei L, Svanberg S (2017) Mobile lidar system for environmental monitoring. Appl Opt 56:1506. https://doi.org/10.1364/ao.56.001506
Acknowledgments
The STLS and MTLS measurements were performed by Mr. Yannick Vandenbroeck in the context of his Master thesis, in collaboration with Ms. Annelies Vandenbulcke. We gratefully utilized the Leica ScanStation P40, made available by MEET HET, a partnership network of geomatics experts in Belgium. We thank the Flemish Government for providing the airborne laser scan data.
Author information
Authors and Affiliations
Corresponding author
Additional information
Corresponding editor: Tao Xu.
Publisher's Note
Springer Nature remains neutral with regard to jurisdictional claims in published maps and institutional affiliations.
Project funding: The work was funded by University College Ghent and Ghent University.
The online version is available at https://www.springerlink.com.
Rights and permissions
Open Access This article is licensed under a Creative Commons Attribution 4.0 International License, which permits use, sharing, adaptation, distribution and reproduction in any medium or format, as long as you give appropriate credit to the original author(s) and the source, provide a link to the Creative Commons licence, and indicate if changes were made. The images or other third party material in this article are included in the article's Creative Commons licence, unless indicated otherwise in a credit line to the material. If material is not included in the article's Creative Commons licence and your intended use is not permitted by statutory regulation or exceeds the permitted use, you will need to obtain permission directly from the copyright holder. To view a copy of this licence, visit http://creativecommons.org/licenses/by/4.0/.
About this article

Cite this article
Stal, C., Verbeurgt, J., De Sloover, L. et al. Assessment of handheld mobile terrestrial laser scanning for estimating tree parameters. J. For. Res. 32, 1503–1513 (2021). https://doi.org/10.1007/s11676-020-01214-7
Received:
Accepted:
Published:
Issue Date:
DOI: https://doi.org/10.1007/s11676-020-01214-7