
Abstract
The competitive formation of allotriomorphic α along the prior β grain boundaries, secondary α-phase and the growth of globular primary α is described for the Ti-6Al-4V alloy during continuous cooling. The formation kinetics of the different morphologies of the α-phase is related to the nucleation rate of allotriomorphic α and secondary α as well as with the V supersaturation at the β matrix. A mesoscale physical model is developed for the allotriomorphic α and secondary α based on classical nucleation and growth of platelets. The growth of the primary α is modelled as the growth of a spherical particle embedded in a supersaturated β matrix. Continuous cooling tests at two different holding temperatures in the α+β field, 930 °C and 960 °C, and five different cooling rates, 10, 30, 40, 100 and 300 °C/minutes, are conducted. Additionally, interrupted tests are conducted at different temperatures to determine the progress of growth of primary α and formation of allotriomorphic and secondary α-phases during cooling. The size of primary α increases, while its circularity decreases with decreasing cooling rate. The area fractions of primary α decrease with increasing cooling rate and increasing holding temperature. Moreover, the lower the cooling rate, the thicker the plates of allotriomorphic α and secondary α. The growth of primary α, as well as the formation of allotriomorphic α plates is observed at the beginning of the cooling stage. The formation of secondary α occurs at last and is nearly negligible for very low cooling rates. The model is able to accurately predict the different α-phase formation behaviours and the obtained results show good agreement with the experimental ones.
1 Introduction
The mechanical properties of Ti-6Al-4V, especially fatigue resistance, toughness and ductility, are strictly correlated with its microstructure formed during the industrial thermomechanical treatments.[1] Different microstructures can be achieved, i.e. martensitic, lamellar, equiaxed or bimodal, and they are related to the cooling rates after the thermomechanical treatment. A bimodal microstructure consisting of lamellar α and globular primary α (αp) is usually desired because of the combination of high ductility and high toughness.[1] The globular αp phase grows during cooling, while lamellar or secondary α (αSEC) nucleates and grows at the prior β grain boundary or from the primary alpha. Moreover, a third morphology of α-phase, named allotriomorphic α (αGB), also forms along the grain boundaries during cooling.
The growth of αp phase is diffusion-controlled. For very slow cooling rates, the β-phase transforms mainly into αp. Thus, the resulting microstructure consists of almost only large equiaxed αp with small amounts of retained β-phase.[2] The amount of αp decreases for increasing cooling rates and other morphologies of α-phase are formed.[3] Semiatin et al.[4] observed that αp exhibits epitaxial growth for Ti-6Al-4V controlled by the diffusion of V in the β-phase. The slower the cooling the larger the range in which the growth of αp is pronounced. The retardation and finally the end of αp growth with decreasing temperature during cooling can be attributed to two simultaneous effects related to the formation of αSEC and αGB: (1) a geometric restriction for growth (pinning effect), and (2) a decrement of the supersaturation of elements in the β matrix. The matrix supersaturation is the driving force for the growth of αp as well as for the formation of αs and αGB. In this way, the growth of αp competes with the formation of αs and αGB for intermediate cooling rates (between 5 and 300 °C/minutes).[5]
The presence of a rim-like region of α-phase surrounding the αp was observed in a near-α Ti60 alloy during cooling.[3] The rim-α-phase had the same crystallographic orientation as the interior of the αp particle, thus evidencing the epitaxial growth of the primary α-phase. Further analysis showed that the growth of αp particles was mainly controlled by diffusion of aluminium and molybdenum for the Ti60 alloy. The nucleation rate and growth of αGB depends on the cooling rate and follows a platelet-like formation.[2,4] Furthermore, extensions from αp with same crystallographic orientation were observed preferentially along the β/β boundary suggesting formation of αGB along β/β grain boundary from αp.[3] Sun et al.[6] observed for a near-α alloy TA15 (Ti-6Al-2Zr-1Mo-1V) cooled from the β-phase field preferential nucleation of αGB at triple junctions of the β grains, and then grew to one side of the grain boundary forming a flat plate. The αGB can also nucleate from the middle of one β/β grain boundary due to high levels of local supersaturation forming an unconnected layer of αGB. The formation of αGB depends on the available energy and time for growth. Therefore, different morphologies of αGB were observed: flat, zig-zag, and a mix of both.
Different modelling approaches were proposed for the β→α-phase transformation.[7,8,9,10,11,12,13,14,15] Classical Kolmogorov–Johnson–Mehl–Avrami (KJMA) equation was applied to predict the phase transformation kinetics in Ti-6Al-4V.[7] The growth of αGB was modelled using the diffusion solution for the growth of plate-like particles,[8] ellipsoid particles,[8,9] and ledge growth.[8,10,11] A cellular automation model based on diffusion, mixed and interface phase transformation was proposed by Song et al.[12] for phase transformation in titanium alloys. Phase field models were also developed.[13,14,15] and showed notably accuracy to predict the growth of particles in case of complex supersaturation fields in the particle growth front.[14]
Semiatin et al.[4] proposed a model for the growth of αp using the exact solutions of diffusion equations with the following considerations: (a) the diffusion coefficients were corrected with a thermodynamic factor for the specific composition of the material, and (b) the supersaturation degree reached during cooling is the driving force for the diffusion process.[4] Meng et al.[16] complemented the model proposed by Semiatin et al.[4] by considering the effect of thermal history on the diffusion field around the αp and the overlap of diffusion fields of growing phases.[17]
Extensive modelling of the formation of αSEC was performed by Katzarov et al.[18] The morphology, distribution, and geometry of the αSEC was simulated using finite element modelling implemented to solve the diffusion equation on the domain occupied by the β-phase. A random nucleation model as a function of the supersaturation of V in the matrix was implemented for 1-D and 2-D simulations of the formation of αSEC. It was observed that lower cooling rates lead to faster transformation of β→αSEC, considering the same temperature. Additionally, the thickness dependency of the αSEC on temperature during isothermal treatment was also measured and simulated. Despite the broad capability of prediction of the model proposed by Katzarov et al.,[18] the model was developed only for β→α transformation from the β field and not from the α+β field. Using a similar approach, the precipitation of αSEC in competition with the epitaxial growth of αp was modelled and simulated for a TA15 alloy.[5] In this case, the diffusion of Mo in β-phase was the controlling mechanisms for β→α transformation. The growth of αSEC was proposed to be a competition between direct interference from interface stability, where no misorientation is observed between the nucleating plate and the substrate, and sympathetic nucleation, where low-angle boundaries exist between the nucleating plate and the pre-existing substrate.
Robust, accurate and computational simple models to simulate the β→α transformation are necessary to predict and control the evolution of the microstructure in components with complex shapes produced by thermomechanical processing. Here we propose a simple model that is able to couple the competitive growth of primary α and formation of allotriomorphic α as well as secondary α-phases. The results are compared with systematic measured data acquired for different continuous cooling experiments below the β-transus temperature.
2 Experimental Procedures
2.1 Material
A cogged Ti-6Al-4V in the β and α+β fields with further annealing at 730 °C for 1 hour followed by air cooling was used for this investigation. The β-transus calculated using JMatPro® v.10 is ~995 °C and the chemical composition is listed in Table I.[19] Cylindrical samples with a diameter of 5.5 mm and a length 10 mm were heat treated in a dilatometer.
2.2 Heat Treatments
A dilatometer DIL 805A/D (TA Instruments, Hüllhorst, Germany) was used to perform continuous cooling heat treatments. The tests were carried out in a protective atmosphere of argon. After heating with a rate of 30 °C/minutes, the samples were held for 1 hour at two different holding temperatures in the α+β field, 930 °C and 960 °C, and then continuously cooled up to room temperature. The cooling was conducted using five different cooling rates: 10, 30, 40, 100 and 300 °C/minutes. Interrupted continuous cooling heat treatments were carried out to elucidate the mechanism/s governing the β→α transformation during cooling. After heating with 30 °C/minutes, the samples were held for 1 hour at a constant temperature of 960 °C. The subsequent cooling was performed with 10 and 100 °C/minutes. The samples were quenched using argon flow for four different temperatures, 900, 875, 850 and 800 °C.
2.3 Metallography and Microstructure Investigation
The samples were polished using OP-S (oxide polishing suspension) after a conventional grinding procedure from grit 500 up to 2000. The samples were etched with the Kroll’s reagent: 91 ml water, 6 ml HNO3 (69 vol Pct) and 3 ml HF (40 vol Pct). The prepared samples were investigated using light optical (LOM) and scanning electron (SEM) microscopy. A minimum of five representative LOM micrographs were analysed for each cooling rate and holding temperature for quantification of the globular αp. The thickness of αGB as well as of αSEC were measured following the stereology procedures for quantification described by Tiley et al.[20] For comparison, the interspace distance between the lamellas of αSEC and the thickness of αGB were manually measured to obtain a thickness distribution. For each micrograph, the particles of αp were manually marked using software GIMP (GNU Image Manipulation Program)[21] and analysed using ImageJ software.[22] The SEM analyses were conducted using a Tescan Mira3 microscope equipped with a Hikari EBSD camera. SE images were acquired using an acceleration voltage of 10 kV and a working distance of 12 mm. A minimum of five representative SE micrographs were acquired to measure the thickness of αGB and αSEC. An acceleration voltage of 25 kV and a working distance of 15 mm were used for the EBSD measurements. An area of 200 µm x 200 µm was measured using a step size of 0.2 µm. The data treatment was performed using the OIM DataAnalysis® software. A confidence index standardization was performed considering a minimum grain size of ten points and minimum boundary misorientation angle of 12 deg. Finally, the neighbour confidence index correlation was used to re-index the data-points with confidence index lower than 0.75.
2.4 Modelling Strategy
In the proposed model, the formation of αSEC, αGB and αp is computed simultaneously. The implementation is detailed and are separated mainly on nucleation kinetics (does not apply for the αp) and growth kinetics. The growth of αp during cooling in heat treatments conducted below the β-transus temperature was modelled based on Reference 4. The growth of αGB and αSEC were modelled based on the classical model of nucleation and diffusion equation for the growth of a platelet.[5] The microstructure is modelled as consisted of three major morphologies of α-phase: αp, αSEC and αGB, all embedded in a β-phase matrix, as schematically shown in Figure 1.

(a) Schematic representation of the different morphologies of α-phase: primary (αp), secondary (αSEC) and allotriomorphic (αGB), formed during cooling for a typical Ti-6Al-4V alloy; (b) growth of a spherical particle of radius R and particle composition CP embedded in an infinite matrix of composition CM, in which CI is the chemical composition of the matrix at the interface
2.4.1 Growth of primary alpha (αP)
Semiatin et al.[4] showed that for Ti-6Al-4V the growth of globular αp phase during cooling is limited only by V diffusion due to supersaturation. The interdiffusion coefficient of V in β titanium \( D_{V}^{\beta } \) as a function of temperature T is calculated from Reference 23 and also adopted in the model of Semiatin et al.[4] as well as Villa et al.[24] Eq. [1].
The growth of a spherical particle embedded in an infinite matrix of composition CM is given according to Eq. [2].
where R is the radius of the particle, D is the diffusion coefficient and is a growth rate parameter denoting the interface αP/β and is calculated according to Eq. [3].
The parameter Ω denotes supersaturation and is calculated according to Eq. [4].
where CI is the composition of the matrix-αP interface and CP is the composition of the αp phase. CI is considered as the equilibrium phase composition obtained from the phase diagram of the alloy at the calculated temperature considering a diffusion-controlled reaction,[4] and CP is considered as the equilibrium phase composition of the α-phase obtained from the phase diagram. It is considered a constant value with respect to temperature[4] and equivalent to the V concentration in α-phase.[4] Following this assumption, all α morphologies have same CP. The compositions are given in wt.Pct.
The supersaturation is the driving force for the growth of αp. The α-phase fraction at equilibrium as well as the chemical composition (CI) was calculated using the software JMatPro® v.10 in wt.Pct and are shown in Figures 2(a) and (b), respectively. To account for the soft impingement on the “far-field” matrix composition, CM is calculated using a usual mass balance between the total fraction of α (fα) phase, as given in Eq. [5].
C0 is the nominal concentration of V in the material.

Simulated data using JMatPro® v.10: (a) equilibrium α-phase fraction; (b) equilibrium V concentration for the β matrix obtained from the phase diagram
2.4.2 Formation of allotriomorphic alpha (αGB)
Similar to the growth of αp, the partial enrichment of V along the formed α/β-phase boundary is observed. Due to high anisotropy in interfacial energy a plate-like morphology of the α-phase is observed to form along the β/β grain boundaries. In the present model, the lengthening is considered notably higher in comparison to the thickening as also suggested by phase field simulation.[25] Therefore, the increase in the volume fraction of αSEC or αGB originates mainly from increase in number density and their thickness.[5] The nucleation, growth and overall transformation kinetics of grain boundary allotriomorphic platelets were proposed for steels[26] and titanium alloys.[27] Following a similar approach, when the nucleation time is neglected, the nucleation rate of precipitates is given according to Eq. [6].
where N0GB is a pre-exponent term corresponding to the number of incubation sites multiplied by a constant[18] and fitted according to an empirical power law to account to the effect of the initial prior beta grain size, Eq. [7]. Q is the activation energy for atomic migration across the interface and assumed to be half of the activation energy for diffusion.[28,29] \( \Delta G_{\text{NucGB}}^{*} \) is the energy barrier for heterogeneous nucleation, R the molar gas constant and T the temperature. fαp, \( f_{{\alpha {\text{GB}}}} \) and \( f_{{\alpha {\text{SEC}}}} \) are the calculated volume fraction of αp, αGB and αSEC, respectively, and their sum is the total fraction of alpha phase (\( f_{\alpha } \)).
where \( {\text{GS}}_{0} \) is a reference grain size and considered as 35 µm in the current model and \( {\text{GS}} \) is the prior beta grain size. The energy barrier for heterogeneous nucleation of αGB is calculated according to Eq. [8].
where \( A_{\text{GB}}^{ *} \) is a parameter obtained according to the nucleation at grain boundary (\( A_{\alpha \beta } \)), or sympathetic nucleation (\( A_{\text{SYM}} \)),[5] or a sum of contributions of both (adopted in the current model), Eq. [9].
where
where NA is the Avogadro constant (\( N_{\text{A}} = 6.02214076 \times 10^{23} {\text{mol}}^{ - 1} \)), \( \gamma_{\alpha \beta } \) is the interface energy between α/β-phases and considered \( \gamma_{\alpha \beta } = \)0.10 J/m2.[18] \( \gamma_{\alpha \alpha } \) is the interface energy of α/α-phase and \( \gamma_{\alpha \alpha } = \)0.30 J/m2.[5] \( V_{\text{m}} \) is the atomic volume of Ti (\( V_{\text{m}} = 1.0896 \times 10^{ - 5} \) m3mol−1) and \( S\left( \theta \right) \) is a shape factor given as a function of the wetting angle of the optimum embryo shape.[18] \( \gamma_{\alpha \beta } \left( {S\left( \theta \right)} \right)^{1/3} \) = 0.012 Jm−2.[18] A small variation in the interface energies (\( \gamma_{\alpha \beta } \) or \( \gamma_{\alpha \alpha } \)) notable impacts the nucleation rate. In the case of the sympathetic nucleation, \( A_{\text{SYM}} \) is a function of both, \( \gamma_{\alpha \beta } \) (second order) and \( \gamma_{\alpha \alpha } \) (first order). On the other hand, for nucleation at grain boundary, \( A_{\alpha \beta } \) is a function of only \( \gamma_{\alpha \beta } \) (third order). Thus, a small increase or decrease in \( \gamma_{\alpha \beta } \) and \( \gamma_{\alpha \alpha } \) would affect notably \( A_{\text{SYM}} \) and/or \( A_{\alpha \beta } \), increasing or decreasing the nucleation rate significantly, respectively. Finally, the model is adjusted with respect to the measured data as shown in Eq. [9] where a weighted sum of both \( A_{\text{SYM}} \) and \( A_{\alpha \beta } \) is considered. The critical thickness (\( B_{\text{GBcrit}} \)) for a disc-like αGB to nucleate is calculated according to Eq. [12].
where \( \Delta G_{\text{VGB}} \) is the chemical free energy of phase transformation obtained using Eq. [13].[5]
\( C_{\text{P}}^{{\alpha_{\text{GB}} }} \) is the concentration of V in the αGB assumed equal to the V concentration in the αp (\( C_{\text{P}}^{{\alpha_{\text{GB}} }} \) = \( C_{\text{P}} \)).
If the misfit strain energy is ignored, the nucleus of αGB grows by diffusion process by thickening of a planar disordered boundary via ledge growth mechanism. The lengthening of a platelet is significantly faster than the thickening due to high anisotropy in interfacial energy. Therefore, the evolution in the volume fraction of αGB is only dependent on the variation of the number density of αGB and its thickness. The variation in number density is related to the number of nuclei and calculated according to Eq. [6]. The thickening of the αGB is modelled according to Eq. [14].
where \( B_{\text{GB}} \) is the thickness of the αGB, \( m_{\text{GB}} \) is a ledge coefficient to account for the planar disordered growth[5] and fitted as 5 for the investigated alloy, \( D \) is the diffusivity of V in the β matrix and \( \lambda_{\text{GB}} \) is a growth rate parameter denoting the interface αSEC/β and is calculated according to Eq. [15].
where \( \Omega_{{\alpha {\text{GB}}}} = \left( {C_{\text{I}} - C_{\text{M}} } \right)/\left( {C_{\text{I}} - C_{\text{P}}^{{\alpha_{\text{GB}} }} } \right) \) is a dimensionless supersaturation parameter, and considered equal to \( \Omega \) because \( C_{\text{P}}^{{\alpha_{\text{GB}} }} \) = \( C_{\text{P}}^{{\alpha_{\text{p}} }} \). Similar to the growth of precipitates, the mean thickness of the platelets is calculated according to Eq. [16].[25]
The first term corresponds to the growth of the existing platelets of αGB, while the second one represents the contribution of new nuclei of critical size calculated according to Eq. [12]. The overall fraction of αGB is calculating according to Eq. [17].
The parameters used for the simulation of the formation of αGB are listed Table A1.
2.4.3 Formation of secondary alpha (αSEC)
The formation of αSEC is modelled similar to the formation of αGB, i.e. nucleation of disc platelets and growth. The colony size is not modelled, but only the thickness of the formed αSEC platelets and its number density (interpreted as the total number of formed nuclei of αSEC). The lengthening is considered notably faster in comparison to the thickening of the αSEC, thus neglected. Due to high anisotropy in interfacial energy, platelet-like αSEC is formed. Differently from the growth of αGB that is along the β/β grain boundaries, the growth of αSEC occurs from the grain boundary towards the centre of the prior β grain as well as sympathetic growth from the αp. Not considering any nucleation time, the rate of nucleation of αSEC is given according to Eq. [18].
where \( N_{{0{\text{SEC}}}} \) is a pre-exponent term similar to \( N_{{0{\text{GB}}}} \) and fitted as 6 × 10⁷ × \( \Delta {\text{G}}_{\text{NucSEC}}^{ *} \) is the energy barrier for heterogeneous nucleation of the αSEC and calculated according to Eq. [19].
where \( {\text{A}}_{\text{SEC}}^{ *} \) is fitted and calculated according to Eq. [20].
The critical thickness (\( B_{\text{critSEC}} \)) for a disc-like αSEC to nucleate is calculated according to Eq. [21].
where \( \gamma_{\alpha \beta } \) is the interface energy between α and β-phases, \( \Delta G_{\text{VSEC}} \) is the chemical free energy of phase transformation of αSEC obtained using Eq. [22].[5]
\( C_{P}^{{\alpha_{\text{SEC}} }} \) is the concentration of V in the αSEC, considered to be equal to the V concentration in the αp and αGB (\( C_{P}^{{\alpha_{\text{SEC}} }} \) = \( C_{P}^{{\alpha_{\text{GB}} }} \) = \( {\text{C}}_{\text{P}} \)).
The growth of the nucleus of αSEC is modelled as the growth of the αGB. The thickening of the αSEC is given according to Eq. [23].
where \( B_{\text{SEC}} \) is the thickness of the αSEC, \( m_{\text{SEC}} \) is a ledge coefficient and fitted as 3 for the investigated alloy, \( D \) is the diffusivity of V in the β matrix and \( \lambda_{\text{SEC}} \) is a parameter denoting the interface αSEC/β that is calculated according to Eq. [24].
where \( \Omega_{{\alpha {\text{SEC}}}} = \left( {C_{\text{I}} - C_{\text{M}} } \right)/\left( {C_{\text{I}} - C_{\text{P}}^{{\alpha_{\text{SEC}} }} } \right) \) is a dimensionless supersaturation parameter. The mean thickness of the αSEC is calculated according to Eq. [25].[30]
The first term corresponds to the growth of the existing platelets of αSEC, while the second represents the contribution of new nuclei of critical size calculated according to Eq. [21]. The overall fraction of αSEC is calculating according to Eq. [26].
The parameters used for the simulation of the formation of αSEC are listed Table A1.
3 Results and Discussion
Figures 3(a) and (b) show representative microstructures of the Ti-6Al-4V argon quenched after holding at 930 °C and 960 °C for 1 hour, respectively. The measured area fractions of αp are 38.6 ± 2.8 and 18.2 ± 3.3 Pct for the heat treatment at 930 °C and 960 °C, respectively. Sparsely and nearly separated αp particles are found in a matrix of martensite (α′), originally a matrix of β-phase. The partial agglomeration of αp is higher for the heat treatment at 930 °C, Figure 3(a). No trace of αSEC is observed. However, the αp particles slightly deviates from an ideal spherical shape particle.

Representative BSE micrographs of the investigated Ti-6Al-4V after 1 h at (a) 930 °C followed by argon quenching; (b) 960 °C followed by argon quenching
3.1 Experimental Observations
3.1.1 Influence of the Cooling Rate
Representative micrographs of the continuously cooled microstructure after holding for 1 hour at 930 °C and 960 °C are shown in Figure 4. The cooling rate of 10 °C/minutes leads to a nearly fully equiaxed microstructure in both cases. The shape of the αp exhibits higher irregularities in the case of 960 °C, decreasing its circularity. It is difficult to distinguish the lamellas of αSEC or αGB from the globular αp for samples cooled down at 10 °C/minutes. The growth of αp is also observed for the cooling rate of 30 °C/minutes. The increase in cooling rate leads to a clear formation of αSEC, as well as of αGB phase. For 30 °C/minutes, αGB exhibits bulges, as well as the αp phase. Higher cooling rates lead to less pronounced growth of αp.

Representative SE micrographs of the investigated Ti-6Al-4V after holding at 930 °C and 960 °C for 1 h followed by continuous cooling at: 10, 30 and 300 °C/min. The red arrows highlight the αGB
A detailed analysis of the microstructure after continuous cooling from 930 °C and 960 °C is seen in the SE micrographs of Figure 5. The αGB and αSEC are highlighted in dashed red and green lines, respectively. For the cooling rate of 300 °C/minutes, the presence of very fine acicular-like martensite (α′) is marked in yellow and in its vicinity plate-like αSEC is also observed. The morphology of αSEC deviates slightly from an ideal flat plate-like morphology. Serrations and discontinuous interlamellar β-phase are observed, especially for the cooling rate of 30 °C/minutes. Moreover, the above-mentioned irregularities of the shape of αP and αGB are observed. The serrations at the interfaces of αP are related to the surface instability due to competitive growth of αGB, αSEC and αP. When the αSEC or αGB are formed in the vicinity of an αP particle, it either hinders the local movement of the interface of the αP and/or changes the supersaturation for its growth. Comparably, if αSEC nucleates from αGB it also changes its interface movement kinetics and supersaturation field for growth. Since the time for diffusion is higher the slower the cooling rate, the serrations are more pronounced for the 30 °C/minutes compared to 300 °C/minutes. A nearly flat plate-like αGB is observed for the cooling rate of 300 °C/minutes.

Representative SE-SEM micrographs of the investigated Ti-6Al-4V after holding at 930 °C and 960 °C for 1 h followed by continuous cooling at 30, 100 and 300 °C/min
Figure 6 illustrates the effect of the cooling rate on the distributions of the diameter of αP (Figure 6(a)), the circularity of αP (Figure 6(b)), and the thicknesses of αGB (Figure 6(c)) and αSEC (Figure 6(d)).The distributions were normalized and fitted using a lognormal distribution and only the fitted data are shown in Figure 6. An increase in diameter of αP with decrease in cooling rate is observed. The circularity of αP decreases with decreasing cooling rate due to the interface serrations for lower cooling rates. The thickness of αGB or αSEC is smaller with narrower distribution for higher cooling rate. The distributions for the cooling rate of 10 °C/minutes are not shown due to the difficulty to distinguish αP from αGB or αSEC.

Normalized distributions of the measured: (a) diameter of αP; (b) circularity of αP; (c) thickness of αGB; and (d) thickness of αSEC
3.1.2 Sequence of Phase Formation
To clarify the sequence of formation of the different morphologies of α-phase, Figure 7 exhibits the typical micrographs after interrupted heat treatments. The αP, αGB and αSEC are highlighted in blue dashed line, red dashed line and green dashed line, respectively. The formation of αGB initiates from the globular αp as well as from triple points of the β grains. The fraction of the grain boundary that is occupied by αGB is very low for 900 °C. At 850 °C the grain boundaries are nearly completely decorated with αGB. Irregular growth of αGB seems to occur at 800 °C and is more pronounced for 10 °C/minutes. Nucleation and growth of αGB do not seem to be significant at temperatures higher than 900 °C for the two investigated cooling rates, leading to comparable evolution behaviour of the αGB after holding at temperatures of 930 °C and 960 °C. Formation of αSEC is not pronounced up to 850 °C. Although Figure 7 shows the presence of αSEC for 10 °C/minutes, its area fraction is notably smaller in comparison to cooling at 100 °C/minutes.

Representative SE-SEM micrographs of the interrupted heat treatments after holding at 960 °C for 1 h followed by continuous cooling at 10 and 100 °C/min. The tests were interrupted at: 900 °C, 850 °C and 800 °C
To investigate the growth of the αGB along the β grain boundaries from the αP, Figure 8 shows the inverse pole figure maps (IPF) of the EBSD measurements for four interrupted heat treatments. The presence of αGB formed from the αP is highlighted by a dashed white circle. In this case, none or very small (below 2 deg) misorientation angle is observed between the αP and the formed αGB. The presence of high-angle grain boundaries (boundary misorientation angle higher than 15 deg) is highlighted in white lines. Two nucleation sites were identified for αGB (a) at αP boundaries as a consequence of a morphological instability due to the presence of an existing β−β grain boundary, and (b) at β triple points and flat grain boundaries. There is no clear crystallographic relationship between the formed αGB from the αP and the particle of αP or at the ones formed at β triple points. It seems that the local supersaturation and surface energy play an important role in the determination of the different nucleation sites. At β triple points, the high surface energy can promote the nucleation of αGB, while the nucleation of αGB at the flat β grain boundaries without αP is promoted by a high local supersaturation due to large interspacing between the αP.

EBSD-IPF maps with αP and αGB formed from the αP indicated by the dashed white circles. The heat treatments correspond to an isothermal for 1 h at 960 °C followed by continuous cooling at (a) 10 °C/min interrupted at 800 °C; (b) 100 °C/min interrupted at 800 °C; (c) 10 °C/min interrupted at 875 °C; (d) 100 °C/min interrupted at 875 °C. The martensitic phase was erased for easier visualization. The CD and ND corresponds to cogging and normal direction, respectively
3.2 Model Performance
The simulated area fraction of αp, mean αp diameter, mean thickness of αGB and mean thickness of αSEC are in good agreement with respect to the experimental results. The fitting parameters are in the same range as reported in other investigations.[5,18] The results corroborate with the work of Semiatin et al.[4] and Meng et al.[5] This work adds the competitive growth of αP, αGB and αSEC. The nucleation of αGB and αSEC were modelled separately and different free energies for nucleation were considered. Despite of not considering the thermo-history included in the model proposed by Meng et al.[5] and despite of not accounting for complex supersaturation fields that are possible to predict when using phase field models,[14] the adoption of a ledge constant to the exact solution showed to be sufficient to achieve notably accuracy in a simple coupled model. The differences between measured and simulated data are dependent on both measurement limitations and model assumptions. The stereological procedures adopted for phase quantification have an inherent error. For instance, the assumption that all αSEC are platelets neglects the amount of αSEC that can exhibit a disc shape or more irregular morphology. Furthermore, the assumption of αp as isolated spherical particles impacts directly the prediction of the αp growth. The αp particles are observed to be partially agglomerated as well as slightly elongated due to initial cogged microstructure. Those differences can explain the deviations and relatively high standard deviation observed in Figure 9.

Measured and modelled evolution of microstructural features during continuous cooling for the αP: (a) average phase fraction at 10 and 100 °C/min for the holding temperatures of 960 °C; (b) average phase fraction for the holding temperatures of 930 °C and 960 °C; (c) mean diameter for the holding temperatures of 930 °C and 960 °C
3.2.1 Influence of the Cooling Rate
The cooling rate plays an important role in the formation of the different morphologies of α-phase. The following statements can be inferred:
-
During continuous cooling, the fraction of αp increases rapidly until 800 °C (Figures 9(a) and 11(d)). The area fraction of αp increases for decreasing cooling rate. The model describes accurately the area fraction evolution apart from 30 and 40 °C/minutes for the holding temperature of 960 °C (Figure 9(b)).
-
The diameter of αp increases with decreasing cooling rate (Figures 9(c) and 11(a)).
-
The calculated and measured thickness of the αGB are in the range of 1–4 µm and it increases with decreasing cooling rate (Figures 10(a) and (b)). Slightly thicker αGB is observed for the holding temperature of 960 °C. The higher supersaturation grade of the matrix at 960 °C, in addition to the faster growth after nucleation during the initial stages at high temperatures, can explain this difference with respect to the sample cooled from 930 °C.
Fig. 10 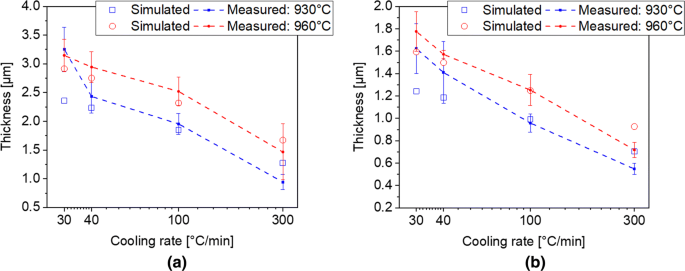
Measured and modelled evolution of the microstructural features during continuous cooling: (a) mean thickness of αGB for the holding temperatures of 930 °C and 960 °C; (b) mean thickness of αSEC for the holding temperatures of 930 °C and 960 °C
-
The thickness of αSEC was in the range of 0.5 to 2 µm and it increases with decreasing cooling rate (Figures 10(b) and (c)). Since the αSEC is formed at temperatures slightly lower than for the αGB, its formation is less influenced by the different holding temperatures.

3.2.2 Evolution of Microstructural Features
The developed model predicts also the evolution of the microstructural features: mean diameter and area fraction of αp, mean thickness and area fraction of αGB, and mean thickness and area fraction of αGB and they are plotted in Figure 11 for the holding temperature of 960 °C. The growth of the α-phase morphologies for temperatures lower than 600 °C is negligible. The formation of αGB starts close to 920 °C. Figures 11(b) and (e) show a high growth rate for αGB at around 900 °C, while the growth for temperatures lower than 800 °C is not significant. These evolutions are in good agreement with the experimental observations depicted in Figure 7. The αSEC formation starts at 875 °C, with a significant growth until 700 °C, explaining the micrographs in Figure 7. Figure 11(f) shows that the fraction of αSEC abruptly decreases when the cooling rate increases from 100 to 300 °C/minutes. The low nucleation rate and low time for diffusion explain this behaviour and are confirmed by the presence of martensite in the microstructure after cooling down at 300 °C/minutes. Rae 31 proposed a time-temperature-transformation diagram for Ti-6Al-4V where the martensitic starting temperature is ~850 °C[32] and martensite is formed if this temperature is achieved within ~5 s. To obtain a fully martensitic microstructure, the temperature of ~700 °C should be achieved within ~1 s from the holding temperature.[31] It deviates slightly from the results observed for cooling at 300 °C/minutes, where αSEC is still observed. Although the formation of martensite is not included in the model, the lower formation of αSEC is used as an indication for it.

Simulation results for the holding temperature of 960 °C during continuous cooling: (a) mean αP phase diameter; (b) mean thickness of αGB; (c) mean thickness of αSEC; (d) phase fraction of αP; (e) phase fraction of αGB; (f) phase fraction of αSEC
3.2.3 Additional Physical Features
Figure 12 shows the nucleation rate of αGB (Figure 12(a)) and αSEC (Figure 12(b)) for the holding temperature of 960 °C. The supersaturation of V within the β-phase matrix is shown in Figure 12(c). The predicted nucleation rate of αGB is significantly smaller compared to αSEC because only the grain boundaries are considered sites for nucleation and formation of αGB. The estimated prior β grain size is 35 µm. Therefore, the density number of platelets of αGB is notably smaller compared to αSEC.

Simulated results for the holding temperature of 930 °C and 960 °C for the cooling rates of 10, 30 and 300 °C/min: (a) nucleation rate of αGB; (b) nucleation rate of αSEC; and (c) supersaturation of V in the β matrix
A summary with the temperature for the beginning of nucleation and for the maximum nucleation rate is shown in Table II. The αGB nucleates first compared to αSEC. The temperature for the beginning of nucleation tends to increase with decrease cooling rate. An exception is calculated for the 10 °C/minutes cooling rate. In this case, the predominant growth of αP leaves no supersaturation to activate earlier nucleation of αGB. Similar tendency is observed for the αSEC. The slightly lower temperatures for nucleation in the case of 10 °C/minutes is more pronounced, as expected due to the higher free energy for nucleation (Eq. [9] in comparison to Eq. [20]). The dependency on the cooling rate in the case of the nucleation rate follows similar behaviour compared to the beginning of nucleation. The temperatures for maximum nucleation rate are 40 °C lower compared to the temperature for the beginning of nucleation for the αGB. In the case of the αSEC, this difference varies between 80 and 100 °C. The interrupted heat treatments (Figure 7) showed that αSEC forms at lower temperatures compared to αGB. Similar trend is exhibited by the simulated nucleation rates of αSEC. The incomplete formation of αSEC for high cooling rates (Figures 5 and 11) is also predicted in the current model, since the temperature for maximum nucleation rate of αSEC lies close to 800 °C. Furthermore, the notable low amount of αSEC formed during low cooling rates is also observed (Figure 4) and agrees with the model prediction.
The formation of the different morphologies is driven by the degree of supersaturation of the V in the β-phase, and its evolution during cooling is shown in Figure 12(c). It raises rapidly up to 810 °C, temperature slightly lower compared to the maximum nucleation rate of αSEC (Table II). Moreover, an intensive formation of ααSEC is observed between 850 and 800 °C (Figure 7). Higher supersaturation promotes nucleation of αGB and αSEC as well as growth of αP. The simulation and the microstructure analysis show that the growth of αP is favourable for lower cooling rates, while formation of αSEC is promoted for higher cooling rates. The lower time for diffusion at high cooling rates increases the supersaturation of V of the β matrix, thus promoting the formation of αSEC. The long time for diffusion for low cooling rates promotes the growth of αP.
4 Summary and Conclusions
The sequence of formation and growth of the different morphologies of α-phase (primary, secondary and allotriomorphic) in Ti-6Al-4V were investigated during cooling from isothermal treatments below the β-transus temperature. A mesoscale physical model to account for the competitive growth of the different morphologies was developed. Nucleation and growth of αGB as well as of αSEC are modelled based on the nucleation and growth of platelets. The growth of αP is modelled as the growth of a spherical particle. The simulated results are in agreement with the obtained results and the following conclusions are inferred:
-
Growth of αP is more pronounced for low cooling rates and occurs more notable up to 800 °C
-
Regular (planar) interface shape of αGB is observed decorating the prior β grain boundaries for high cooling rates. For low cooling rates, irregular shapes are observed
-
αGB nucleates preferentially from existing αp phase. For higher cooling rates nuclei in triple points of the β grains and other regions of the prior β/β grain boundary are observed. The higher nucleation rate for those cooling rates can explain the different behaviour
-
Formation of αSEC occurs at a lower temperature for the same cooling rate compared to the formation of αGB. The predicted temperature for maximum nucleation rate of αGB is ~80 °C higher compared to the one for the maximum nucleation rate of αSEC
-
αSEC nucleates from the already existing αGB as well as at the interface with the αP
-
The variation of nucleation rate with respect to the cooling rate is notably more pronounced for the αSEC compared to αGB
-
A sharp increase of V supersaturation in the β matrix is observed up to 850 °C, which is attributed to contributing to the formation of αSEC, especially for cooling rates higher than 10 °C/minutes.
References
G. Lütjering and J. C. Williams: Titanium. Berlin, Heidelberg, Springer Berlin Heidelberg, 2007.
R. Pederson: Microstructure and Phase Transformation of Ti-6Al-4V, PhD Dissertation, Lulea University of Technology, Lulea, Sweden, 2002.
X. Gao, W. Zeng, S. Zhang, and Q. Wang: Acta Mater., 2017, vol. 122, pp. 298–309.
S. L. Semiatin, S. L. Knisley, P. N. Fagin, F. Zhang, and D. R. Barker: Metall. Mater. Trans. A, 2003, vol. 34 A(10), pp. 2377–86.
M. Meng, X. G. Fan, H. Yang, L. G. Guo, M. Zhan, and P. F. Gao: J. Alloys Compd., 2017, vol. 714, pp. 294–302.
Z. Sun, X. Li, H. Wu, and H. Yang: J. Alloys Compd., 2016, vol. 689, pp. 693–701.
N. Kherrouba, M. Bouabdallah, R. Badji, D. Carron, and M. Amir: Mater. Chem. Phys., 2016, vol. 181, pp. 462–469.
M. Enomoto, H. I. Aaronson, and T. Furuhara: Metall. Trans. A, 1991, vol. 22(6), pp. 1341–48.
E. S. K. Menon and H. I. Aaronson: Metall. Mater. Trans. A, 1986, vol. 17(10), pp. 1703–1715.
C. Atkinson: Metall. Trans. A, 1991, vol. 22(6), pp. 1211–1218.
M. Enomoto: Metall. Trans. A, 1991, vol. 22(6), pp. 1235–1245.
K. J. Song, Y. H. Wei, Z. B. Dong, X. Y. Wang, W. J. Zheng, and K. Fang: J. Phase Equilibria Diffus., 2015, vol. 36(2), pp. 136–48.
Q. Chen, N. Ma, K. Wu, and Y. Wang: Scr. Mater., 2004, vol. 50(4), pp. 471–476.
B. Appolaire, L. Héricher, and E. Aeby-Gautier: Acta Mater., 2005, vol. 53(10), pp. 3001–3011.
G. W. Mei Yang Tao Liu, Wen-Juan Zhao, Dong-Sheng Xu: Acta Metallurgica Sinica(English letters), 2017, vol. 30(8), pp. 745–52.
M. Meng, H. Yang, X. G. Fan, S. L. Yan, A. M. Zhao, and S. Zhu: J. Alloys Compd., 2017, vol. 691, pp. 67–80.
V. Raghavan: Solid State Phase Transformations, PHI Learning Private Limited, Delhi, 1987.
I. Katzarov, S. Malinov, and W. Sha: Metall. Mater. Trans. A, 2002, vol. 33(4), pp. 1027–1040.
P. Homporová: Thermal history of alpha morphology in titanium alloy Ti-6Al-4V, PhD Dissertation, Vienna University of Technology, Vienna, 2011.
J. Tiley, E. Lee, S. Kar, R. Banerjee, J.C. Russ, and H.L. Fraser: Mater. Sci. Eng., A, 2004, vol. 372(1-2), pp. 191–98.
GIMP - GNU Image Manipulation Program, https://www.gimp.org/. Accessed: 20-Aug-2019.
ImageJ, https://imagej.nih.gov/ij/. Accessed: 20-Aug-2019.
U. Zwicker: Titan und Titanlegierungen, Springer, Berlin Heidelberg, 1974.
M. Villa, J.W. Brooks, R.P. Turner, H. Wang, F. Boitout, R.M. Ward: Metall. And Mater. Trans. B, 2019, vol. 50, pp.2898-2911.
R. Shi, Y. Wang: Acta Mater., vol. 61(16), pp. 6006–24.
M. Enomoto, H.I. Aaronson: Metall. Trans. A, 1986, vol. 17(8), pp. 1385-1397.
E. Sarath Kumar Menon, H.I. Aaronson: Metall. Mater. Trans. A, 1986, vol. 17(10), pp. 1703–15.
D. S. Wilkinson: Mass Transport in Solids and Fluids. Cambridge University Press, Cambridge, 2000.
J. W. Christian: The theory of transformations in metals and alloys : an advanced textbook in physical metallurgy. Pergamon Press, Oxford, 1975.
A. Deschamps and Y. Brechet: Acta Mater., 1998, vol. 47(1), pp. 293–305.
W. Rae: Mater. Sci. Technol., 2019, vol. 35(7), pp. 747-766.
J. Sieniawski, W. Ziaja, K. Kubiak, M. Motyka: in Titanium alloys-advances in properties control. IntechOpen, 2013.
Acknowledgments
Open access funding provided by Graz University of Technology. The authors carried out this work under CD-Laboratory for Design of High-Performance Alloys by Thermomechanical Processing, supported by the Christian Doppler Society.
Author information
Authors and Affiliations
Corresponding author
Additional information
Publisher's Note
Springer Nature remains neutral with regard to jurisdictional claims in published maps and institutional affiliations.
Manuscript submitted on December 10, 2020.
Appendix
Appendix
A Matlab® routine was developed to implement the model to couple the growth of the αp and the formation and growth of αGB and αSEC. The used parameters are listed in Table A1.
Rights and permissions
Open Access This article is licensed under a Creative Commons Attribution 4.0 International License, which permits use, sharing, adaptation, distribution and reproduction in any medium or format, as long as you give appropriate credit to the original author(s) and the source, provide a link to the Creative Commons licence, and indicate if changes were made. The images or other third party material in this article are included in the article's Creative Commons licence, unless indicated otherwise in a credit line to the material. If material is not included in the article's Creative Commons licence and your intended use is not permitted by statutory regulation or exceeds the permitted use, you will need to obtain permission directly from the copyright holder. To view a copy of this licence, visit http://creativecommons.org/licenses/by/4.0/.
About this article

Cite this article
Buzolin, R.H., Weiß, D., Krumphals, A. et al. Modelling the Competitive Growth of Primary, Allotriomorphic, and Secondary Alpha in Ti-6Al-4V. Metall Mater Trans A 51, 3967–3980 (2020). https://doi.org/10.1007/s11661-020-05810-4
Received:
Published:
Issue Date:
DOI: https://doi.org/10.1007/s11661-020-05810-4