
Abstract
Summary
The purpose of this study was to evaluate the effect of menopause on bone mineral density and bone width of the mandible. Results indicate that menopause affects the bone quality and quantity of the partially edentulous molar region of the mandible, which should be considered in dental implant treatment for postmenopausal women.
Introduction
The recovery of oral function with dental implant is clinically effective and highly predictable. Bone quantity and quality at the implant installation site affect its prognosis; however, the effects of menopause on jaw bone have not been well documented. The purpose of this study was to evaluate the effect of menopause on bone mineral density (BMD) and bone width of the mandible.
Methods
The subjects were 72 female patients with a partially edentulous molar region of the mandible: 30 premenopausal and 42 postmenopausal women aged 30 to 70 years. Trabecular BMD was measured with quantitative computed tomography. Trabecular region width (TW) and cortical width (CW) were measured with CT. The BMD, TW, and CW of the two groups were compared.
Results
The trabecular BMD of postmenopausal women was lower than that of the premenopausal women. The TW of postmenopausal women was greater than that of premenopausal women, whereas the CW of postmenopausal women was significantly smaller than that of premenopausal women. In all these women, BMD correlated negatively with TW and positively with CW. In the premenopausal women, BMD negatively correlated with TW, but it did not correlate with CW. In the postmenopausal women, there was no correlation between BMD and bone width.
Conclusion
These results indicate that menopause affects the bone quality and quantity of the partially edentulous molar region of the mandible, which should be considered in dental implant treatment for postmenopausal women.
Introduction
Loss of posterior teeth may result in the loss of neuromuscular stability of the mandible, reduced masticatory efficiency, loss of vertical dimension of occlusion, and poor aesthetics. Prosthetic rehabilitation should aim at restoring the vertical dimension and increasing the occlusal contact area in the premolar/molar region. Dental implant treatment is an excellent option for prosthetic restoration that is associated with high success rates. Bone quantity and quality are very important for successful implant treatment. Of these two, a vital determinant for implant placement feasibility and the potential for bone grafting is bone quantity, which can now be determined more precisely by the various X-ray CT systems including helical CT and small radiation field CT and the wide variety of software available for image analyses and multiplanar reconstruction.
Bone quality and cortical bone width, which are also important factors affecting primary implant stability and the duration of the non-loading period, have been classified by Lekholm et al. [1] and Misch [2], and their classification systems have been widely used in clinical practice. However, the practical and substantial assessment of bone quality often depends on the tactile impression while drilling to prepare the implant site and visual evaluation of X-ray CT and topographic images, which should be regarded as subjective procedures. Existing methods able to objectively assess bone quality depend on the cutting resistance experienced while preparing the implant site and the insertion torque during implant insertion. These are unable to provide a good preoperative understanding of bone quality and are sensitive to the procedures of implant surgery as well as implant geometry [3]. CT values obtained by X-ray scanning are another evaluation index of bone quality which, however, are not reliable in quantitative terms completely quantitative as CT values are influenced by the type of CT system used, tube voltages, algorithms, etc. In addition to the methods described above, a convenient and helpful method using panoramic radiography is available to assess the jaw bone, but it does not provide quantitative data.
We have applied a quantitative computed tomography (QCT) method, which was developed by Genant et al. [4] and has been widely used in the lumbar vertebrae and femur for the diagnosis of osteoporosis, to the quantitative and objective assessment of jaw bone quality and reported the changes in mandibular bone quality.
The purpose of this study was to investigate the effect of menopause on mandibular bone quantity and quality in the edentulous molar region in patients receiving dental implant.
Subjects and methods
The present study was approved by the Dental Hospital at Tokyo Medical and Dental University Ethics Committee and the written informed consents were obtained from all the patients.
Subjects
The subjects were 72 Japanese women with a partially edentulous molar region of the mandible receiving dental implant at the Dental Hospital at Tokyo Medical and Dental University between 2005 and 2009. Thirty of these subjects were premenopausal and 42 were postmenopausal. They were aged from 40 to 78 years. Exclusion criteria were: impaired bone metabolism (such as hyperparathyroidism, renal osteodystrophy, and oophorectomy, skeletal bone disorders) and the use of medications that affect bone metabolism (such as corticosteroids, estrogen preparation, bisphosphonate, and vitamin D).
Bone mineral density and bone width measurement
The trabecular bone mineral density (BMD) of the mandible was measured using single-energy QCT with a Siemens Somatom plus S (Siemens, Germany) at 120 kV and 125 mA with a slice thickness of 1 mm.
-
1.
The mandibular inferior border was placed vertical to the table with the mouth closed and set as the reference plane to perform CT scanning.
-
2.
The simultaneous scanning of a bone density calibration phantom containing two compartments with 0 and 200 mg/ml of calcium hydroxyapatite equivalent was performed when imaging in patients was done (Fig. 1).
Fig. 1 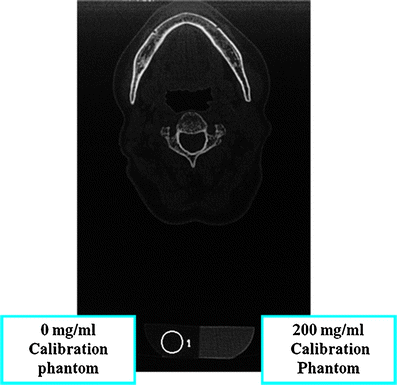
Simultaneous scanning of calibration phantom. The simultaneous scanning of bone density calibration phantom containing two compartments with 0 and 200 mg/ml of calcium hydroxyapatite equivalent was performed when CT scanning in patients was done
-
3.
Among all the CT images obtained, the sliced image containing the mental foramen parallel to the mandibular inferior border was selected for the measurement (Fig. 2).
Fig. 2 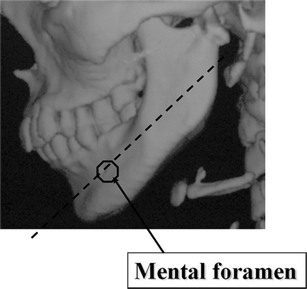
Image selection for measurements. The sliced images containing the mental foramen parallel to the lower border of the mandible were selected
-
4.
The edentulous region in the abovementioned image was set as the region of interest (ROI) to determine the average CT values of the trabecular bone in the edentulous molar region. The regions where the CT values were <500 HU were regarded as trabecular bone regions.
-
5.
Those parts presenting with localized bone sclerosis within the image of the trabecular bone region were excluded from CT value measurement. The areas adjacent to the interface between cortical and trabecular bone were also excluded from the ROI to eliminate the partial volume effect. The CT values measured within the ROI (3 × 3 mm) three times were averaged to obtain mean CT values for individual trabecular bone regions. These mean CT values and the CT values obtained with the calibration phantom were converted based on the linear relationship between the X-ray attenuation coefficients and the CT values to calculate the values of bone mineral density (in milligrams per milliliter: BMD).
-
6.
Additionally, for the edentulous molar region in the same sliced image (bone mode), the widths of the trabecular bone region (TW) as well as the width of the cortical bone (CW) including those in both the buccal and lingual layers of the cortex sides were determined using the distance measurement software provided with the CT scanner (Fig. 3).
Fig. 3 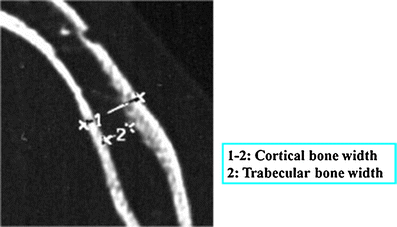
Bone width measurements


Statistical analysis
The following three analyses were performed using the measurements of the bone widths and the calculated BMD values:
-
1.
The comparison of the BMD values and the bone widths between pre- and postmenopause
-
2.
The correlations between BMD and bone width
The Wilcoxon test was used to verify possible differences between two groups and the correlations were determined using Spearman’s rank correlation coefficient. Statistical significance was accepted at the P < 0.005 level.
Results
Comparison of the BMD values and bone widths between pre- and postmenopausal women
Table 1 shows the values of BMD and bone widths of premenopausal and postmenopausal women.
The BMD values of postmenopausal women were significantly lower. Significantly higher TW values and lower CW values were observed in postmenopausal women. Thus, the results suggest a reduced percentage of cortical bone in the mandible of postmenopausal women.
Correlations between BMD and bone width
Figures 4, 5, and 6 shows the correlation between BMD and bone width (TW and CW) for all women (Fig. 4), premenopausal women (Fig. 5), and postmenopausal women (Fig. 6), respectively.
For all women (n = 72), BMD correlated negatively with TW (r = −0.560) and positively with CW (r = 0.593). For premenopausal women, BMD correlated negatively with TW (r = −0.592) but has no correlation with CW. No correlations between BMD and bone width were observed for postmenopausal women.

Correlation between bone width and bone mineral density for all patients. TW and CW represent bone width of trabecular bone and cortical bone, respectively

Correlation between bone width and bone mineral density for premenopausal women

Correlation between bone width and bone mineral density for postmenopausal women
Discussion
Utility of QCT technique in preoperative assessment for implant surgery
Conventional quantitative assessment methods for the jaw bone include the panoramic-based measurement method introduced by Benson et al. [5], photodensitometry using intraoral radiography, and dual energy X-ray absorptiometry (DXA) [6, 7]. These modalities have been used in several previous studies. QCT used in this study determines bone quantity using a three-dimensional measurement method by means of X-ray CT. This has several advantages over other measurement methods including the individual measurement of trabecular and cortical bone and the possible determination of bone density per volume (in milligrams per milliliter), and thus it may be the measurement method of choice for the jaw bone, given its complex and uneven structure. However, the QCT method has the disadvantages of relatively high exposure dose compared to that required for other radiography methods and its poor reproducibility due to high sensitivity to patient positioning and ROI setting. However, these disadvantages can be virtually eliminated as only a single exposure is required when applying the QCT method to preoperative assessment for implant surgery. By a single scan with the additional operation of simply mounting the ready-made calibration phantom onto the head, the QCT method can provide quantitative bone quality measurements of both cortical and trabecular as well as information including bone morphology and quantity at the planned implant site. Thus, it is an extremely helpful modality for preoperative examination prior to implant.
Furthermore, as the jaw bone can be affected by retained teeth and local impacts including mechanical stimulation caused by occlusion, careful consideration should be given to the measurement site within the jaw to be set. Therefore, patients with a posterior free end missing were included in this study to minimize the possible effects of such factors.
Influences of menopause on mandibular bone
In the studies of the influences of menopause on all the bones of the body by Ito et al. [8], Kroger et al. [9], and Kin et al. [10], the evident loss of bone mass and BMD after menopause have been reported for lumbar vertebral bodies and the femur.
Irie et al. [11] investigated the effect of menopause on mandibular bone by examining three-dimensional morphological changes in the mandibular bone of ovariectomized rats using micro CT and reported that not only significantly decreased values for both bone mass and width of trabecular bone but also significantly increased distances between trabeculae were observed in ovariectomized rats compared to controls. Kuroda et al. [12] also performed a similar study using DXA and pQCT methods and reported a significantly decreased trabecular bone density in the posterior region of the mandible in the ovariectomized rats compared to controls while no difference was observed for the cortical bone density in the same region. Furthermore, Kurosu et al. [13] investigated the correlation between the bone density of lumbar vertebrae determined by DXA examination and that of mandibular bone measured using QCT in 30 postmenopausal women with teeth and reported that a positive correlation existed between the bone density of lumbar vertebrae and the trabecular bone density of mandibular bone. Meanwhile, Klemetti et al. [14] conducted a similar study in 71 postmenopausal women with edentulous or partially edentulous jaws using QCT and reported that there was no correlation between the bone density of the lumbar vertebrae and density of trabecular bone in the mandible, but a correlation with mandibular cortical bone density existed. In addition, the results of the study by Taguchi et al. [15] using QCT were consistent with Klemetti’s findings.
In this study, the BMD values for mandibular trabecular bone in the edentulous region were significantly lower in postmenopausal women than in premenopausal women. The disagreement between our results and those of Klemetti et al. [14] and Taguchi et al. [15] may be attributed to the different patient histories from those in the studies of them as half of the patients that are included in our study had only a small edentulous span with three or fewer missing teeth. Thus, the possible contribution of occlusal forces derived from adjacent teeth to such results was suggested. However, in this study, the influences of other factors including the number of residual teeth, age, and the number of years after menopause were not taken into consideration and should be adequately investigated in the future.
Moreover, our study revealed that a significantly large proportion of the edentulous region of the mandible consisted of trabecular bone while the proportion occupied by cortical bone was significantly small. Taguchi et al. [16] reported a significant correlation between the bone density of lumbar vertebrae and cortical thickness and the morphology of the mandibular lower border, a finding which supports the results from our study together with the above-described results of Irie et al. [11].
Therefore, in the mandible where teeth are lost, the bone density may be reduced and the loss of trabecular bone density as well as cortical bone resorption from the inside can advance with menopause just as they do in bones in other parts of the body.
Relationships between bone quality and quantity
Osteoporosis is a systemic skeletal disease characterized by low bone mass and micro-architectural deterioration of bone tissue leading to enhanced bone fragility and an increase in fracture risk [17]. This bone fragility involves both bone quantity and quality; specifically, it results from thinning of the cortical bone and cavity expansion due to bone absorption at the endosteum surface as well as reduced bone density.
Regarding osteoporosis of the mandible, Tamai et al. [18] investigated mandibular bone quality using QCT in healthy subjects and reported that the BMDs of mandibular cortical and cancellous bone reached a peak when subjects were in their 30s and 40s and then began to decline. Takaishi et al. [19] also reported that mandibular alveolar bone mineral density diminishes with age. With regard to bone quantity, Von Wowern et al. [20] reported that in the mandible, the cortical bone mass diminishes with age. On the other hand, Kribbs et al. [21] showed that diminution of the mandibular mass is not correlated with age.
From our study results, the BMD of trabecular bone correlated negatively with trabecular bone width and positively with cortical bone width and such tendency was more distinctly observed in women. Therefore, these findings indicate that the reduced bone strength in the mandible develops with age just as in the other bones in the body, caused by age-associated BMD loss of mandibular trabecular bone accompanying increased trabecular bone mass and reduced cortical bone mass. It would also appear that trabecular bone quality reflects bone quantity in the same area.
New classifications of jaw bone for implant treatment
For predictable implant treatment, a number of patient-related factors need to be understood. These include systemic conditions such as a history of diabetes, etc., oral hygiene, periodontal condition, smoking habit, jaw bone quality and quantity, occlusion patterns, and parafunctional habits. As bone quality is a crucial factor for the successful achievement of osseointegration, systems for its classification have been developed by Lekholm et al. [1] and Misch [2], and based on their classification, many studies and case reports have been published to date. However, classification based on visual assessment of radiographic images is associated with several problems including imaging stability, which is affected by the tube voltage and current of the X-ray unit and degradation of the developing fluid. Moreover, assessment based on the tactile sensation during implant site preparation has been questioned due to poor objectivity as reported in the study by Trisi et al. [22].
Clinically, cortical bone thickness significantly affects implant primary stability compared to the trabecular bone. Thus, we measured the thickness of cortical bone and BMD and classified jaw bone for implant treatment (Table 2). Two patients of all participants, who experienced loose implants or early bone resorption during the non-loading period after implant insertion, were both premenopausal women whose bone quality was classified into A with high BMD values. Therefore, these failures may be attributable to heat-induced injury during implant site preparation and placement. Thus, we can conclude that these results have demonstrated the usefulness of the quantitative measurement of bone density for implant treatment and the utility of new bone classification based on such measurements.
Our classification using QCT may have applications beyond implant treatment planning based on the preoperative objective assessment of bone quality. It may also be possible to use it for inter-patient comparison and the evaluation of grafted bone. The correlation between our classification and factors including cutting resistance and removal torque should be further investigated to improve its clinical utility.
References
Lekholm U, Zarb GA (1985) Patient selection and preparation. In: Branemark PI, Zarb GA, Albrektsson T (eds) Tissue-integrated prosthesis: osseointegration in clinical dentistry. Quintessence, Chicago, pp 199–209
Misch CE (1993) Density of bone: effect on treatment planning, surgical approach, and healing. In: Contemporary implant dentistry. Mosby, St. Louis, pp 469-485
Johanson P, Strid KG (1994) Assessment of bone quality from cutting resistance during implant surgery. Int J Oral Maxillofac Implants 9:279–288
Genant HK, Cann CE, Ettinger B, Gorden GS (1982) Quantitative CT of vertebral spongisa: a sensitive method for detecting early bone loss after oophorectomy. Ann Intern Med 97:699–705
Benson BW, Phihoda TJ, Glass BJ (1991) Variations in adult cortical bone mass as measured by a panoramic mandibular index. Oral Surg Oral Med Oral Pathol 71:349–356
Von Wowern N (1988) Bone mineral content of mandibles: normal reference values-rate of age-related bone loss. Calcif Tissue Int 43:193–198
Bras J, van Ooij CP, Abraham-Inpijin L, Kusen GJ, Wilmink JM (1982) Radiographic interpretation of the mandibular angular cortex: a diagnostic tool in metabolic bone loss. Part 1. Normal state. Oral Surg Oral Med Oral Pathol 53:541–545
Ito M, Hayashi K, Kawahara Y, Uetani M, Imaizumi Y (1993) The relationship trabecular and cortical bone mineral density to spinal fractures. Invest Radiol 28:573–580
Kroger H, Tuppurainen M, Honkanen R, Alhava E, Saarikoski S (1994) Bone mineral density and risk factors for osteoporosis: a population-based study of 1,600 perimenopausal women. Calcif Tissue Int 55:1–7
Kin K, Kushida K, Yamazaki K, Okamoto S, Inoue T (1991) Bone mineral density of the spine in normal Japanese subjects using dual energy X-ray absorptiometry. Calcif Tissue Int 55:324–329
Irie M, Sakakura Y, Tsuruga E, Hosokawa Y, Yajima T (2004) Three-dimensional changes of the mandible and alveolar bone in the ovariectomized rat examined by micro-focus computed tomography. J Jpn Soc Periodontol 46:288–293
Kuroda S, Mukohyama H, Kondo H, Aoki K, Ohya K, Ohyama T, Kasugai S (2003) Bone mineral density of the mandible in ovariectomised rats: analyses using dual energy x-ray absorptiometry and peripheral quantitative computed tomography. Oral Dis 9:24–28
Kurosu K, Inagaki K, Yoshinari N, Sato R, Fuma D, Sakano M, Sugiishi T, Iwata T, Fukada J, Takagi Y, Noguchi T, Naitoh M, Ariji E, Taguchi A (2004) Relationship between the bone mineral density of mandible by quantitative computed tomography and lumbar spine by dual energy X-ray absorptiometry. J Jpn Soc Periodontol 46:202–208
Klemetti E, Vanio P, Lassila V, Alhava E (1993) Cortical bone mineral density in the mandible and osteoporosis status in postmenopausal women. Scand J Dent Res 101:219–223
Taguchi A, Tanimoto K, Suei Y, Otani K, Wada T (1996) Relationship between the mandibular and lumbar vertebral bone mineral density at different postmenopausal stages. Dentomaxillofac Radiol 25:130–135
Taguchi A, Suei Y, Ohtsuka M, Otani K, Tanimoto K, Ohtaki M (1996) Usefulness of panoramic radiography in the diagnosis of postmenopausal osteoporosis in women: width and morphology of inferior cortex of the mandible. Dentomaxillofac Radiol 25:263–267
NIH Consensus Development Panel on Osteoporosis Prevention, Diagnosis, and Therapy (2001) Osteoporosis prevention, diagnosis, and therapy. JAMA 285:785–795
Tamai M, Ishii Y (1996) The study on changes of bone mineral content of mandible by quantitative computed tomography. J Jpn Stomatol Soc 45:97–104
Takaishi Y, Okamoto Y, Ikeo T, Morii H, Takeda M, Hide K, Arai T, Nonaka K (2005) Correlations between periodontitis and loss of mandibular bone in relation to systemic bone changes in postmenoposal Japanese women. Osteoporos Int 16:1875–1882
Von Wowern N, Stoltze K (1980) Pattern of age related bone loss in mandibles. Scand J Dent Res 88:134–146
Kribbs PJ, Chesnut CH 3rd, Ott SM, Kilcoyne RF (1990) Relationship between mandibular and skeletal bone in a population of normal women. J Prosthet Dent 63:86–89
Trisi P, Rao W (1999) Bone classification: clinical-histomorphometric comparison. Clin Oral Implants Res 10:1–7
Conflicts of interest
None.
Open Access
This article is distributed under the terms of the Creative Commons Attribution Noncommercial License which permits any noncommercial use, distribution, and reproduction in any medium, provided the original author(s) and source are credited.
Author information
Authors and Affiliations
Corresponding author
Rights and permissions
Open Access This is an open access article distributed under the terms of the Creative Commons Attribution Noncommercial License (https://creativecommons.org/licenses/by-nc/2.0), which permits any noncommercial use, distribution, and reproduction in any medium, provided the original author(s) and source are credited.
About this article
Cite this article
Munakata, M., Tachikawa, N., Honda, E. et al. Influence of menopause on mandibular bone quantity and quality in Japanese women receiving dental implants. Arch Osteoporos 6, 51–57 (2011). https://doi.org/10.1007/s11657-011-0058-8
Received:
Accepted:
Published:
Issue Date:
DOI: https://doi.org/10.1007/s11657-011-0058-8