
Abstract
Background
The US Preventive Services Task Force recommends blood pressure (BP) measurements using 24-h ambulatory monitoring (ABPM) or home BP monitoring before making a new hypertension diagnosis.
Objective
Compare clinic-, home-, and kiosk-based BP measurement to ABPM for diagnosing hypertension.
Design, Setting, and Participants
Diagnostic study in 12 Washington State primary care centers, with participants aged 18–85 years without diagnosed hypertension or prescribed antihypertensive medications, with elevated BP in clinic.
Interventions
Randomization into one of three diagnostic regimens: (1) clinic (usual care follow-up BPs); (2) home (duplicate BPs twice daily for 5 days); or (3) kiosk (triplicate BPs on 3 days). All participants completed ABPM at 3 weeks.
Main Measures
Primary outcome was difference between ABPM daytime and clinic, home, and kiosk mean systolic BP. Differences in diastolic BP, sensitivity, and specificity were secondary outcomes.
Key Results
Five hundred ten participants (mean age 58.7 years, 80.2% white) with 434 (85.1%) included in primary analyses. Compared to daytime ABPM, adjusted mean differences in systolic BP were clinic (−4.7mmHg [95% confidence interval −7.3, −2.2]; P<.001); home (−0.1mmHg [−1.6, 1.5];P=.92); and kiosk (9.5mmHg [7.5, 11.6];P<.001). Differences for diastolic BP were clinic (−7.2mmHg [−8.8, −5.5]; P<.001); home (−0.4mmHg [−1.4, 0.7];P=.52); and kiosk (5.0mmHg [3.8, 6.2]; P<.001). Sensitivities for clinic, home, and kiosk compared to ABPM were 31.1% (95% confidence interval, 22.9, 40.6), 82.2% (73.8, 88.4), and 96.0% (90.0, 98.5), and specificities 79.5% (64.0, 89.4), 53.3% (38.9, 67.2), and 28.2% (16.4, 44.1), respectively.
Limitations
Single health care organization and limited race/ethnicity representation.
Conclusions
Compared to ABPM, mean BP was significantly lower for clinic, significantly higher for kiosk, and without significant differences for home. Clinic BP measurements had low sensitivity for detecting hypertension. Findings support utility of home BP monitoring for making a new diagnosis of hypertension.
Trial Registration
ClinicalTrials.gov NCT03130257 https://clinicaltrials.gov/ct2/show/NCT03130257
INTRODUCTION
Elevated blood pressure (BP) is the leading contributor to cardiovascular events and mortality.1, 2 While most adults with hypertension take antihypertensive medications, many are unaware they have high BP. A study using National Health and Nutrition Examination Survey 2017–2018 data estimated that 23% of US adults with high BP (systolic ≥140 mmHg or diastolic ≥90 mmHg) were unaware they had hypertension and were untreated.3
For patients with high screening BP in clinic, US Preventive Services Task Force (USPSTF)4 and other hypertension guidelines recommend follow-up BP testing outside of clinics by 24-h ambulatory BP monitoring (ABPM) or home BP monitoring (HBPM), to avoid overdiagnosis and unnecessary treatment.5,6,7
Currently, ABPM is infrequent in the USA, partly from lack of availability, low reimbursement, and perceptions of lower patient acceptability.8 HBPM is an alternative, but patients need to use validated monitors, be trained on proper use, and take multiple measurements,9,10,11 leading to questions about the accuracy of using HBPM to diagnose hypertension. BP kiosks in pharmacies or clinic waiting areas are an alternative for HBPM, but to our knowledge, no studies have compared kiosk to ABPM for making a new hypertension diagnosis. Blood Pressure Checks for Diagnosing Hypertension (BP-CHECK) was a randomized diagnostic study comparing the accuracy of clinic BP, HBPM, and kiosk BPs to ABPM for making a new diagnosis of hypertension.
METHODS
Setting and Population
The setting was 12 KPWA primary care centers in Western Washington. Enrollment was May 11, 2017, to March 4, 2019. Study design and methods were published.12 Electronic health records (EHRs) were used to identify individuals aged 18–85 with elevated BP (≥138 mmHg systolic or ≥88 mmHg diastolic at last outpatient visit) with no hypertension diagnosis in the prior 2 years and no prescribed antihypertensive medications in the prior 12 months. EHR data were used to exclude patients with BP ≥180 mmHg systolic or ≥110 mmHg diastolic; pregnancy; life-limiting illness (e.g., end-stage renal failure); and conditions that might make participation difficult (e.g., dementia) or BP monitoring less accurate (e.g., atrial fibrillation).
Potentially eligible individuals were mailed an invitation with a study description and $2 bill and called to confirm eligibility. Those willing to participate were scheduled for screening visits. At visits, a research assistant confirmed individuals had not engaged in heavy exercise, used tobacco, or had caffeinated drinks in the prior 30 min. Individuals sat in a chair with back support and the upper left arm was measured with an appropriately sized cuff used.11 After 5 minutes' rest, BP was measured twice 1 min apart using a validated Omron 907XL monitor.13
Individuals with BP ≥140 mmHg systolic or ≥90 mm Hg diastolic on both measurements were eligible. Those with mean ≥180 mmHg systolic or ≥110 mm Hg diastolic were excluded and told to make a physician’s appointment.
Randomization and Blinding
The biostatistician used R statistical software (version 3.2.2) to randomly assign patients to clinic, home, or kiosk groups. Randomization was stratified by clinic, age (<60 or ≥60 years), and mean baseline systolic BP (<150 or ≥150 mmHg), with random block sizes of 3 or 6 within each stratum. Except for study biostatisticians, investigators were blinded until all outcome data were collected. Participants and study staff were aware of group assignments.
Diagnostic Tests
The clinic group received routine care for high BP at KPWA. Participants were instructed to make an appointment at their clinic for a BP recheck. Clinic BP measurements are usually taken by a medical assistant using a wall-mounted aneroid BP monitor (Welch Allyn Tyco)14 or, less frequently, with a validated oscillometric BP monitor (GE CARESCAPE V100).15 For high initial BP (systolic BP ≥140 mmHg or diastolic BP ≥90 mmHg), standard procedure is to measure BP again after at least 5 min.16 If BP is elevated again, the patient’s clinician is notified to make a plan and a follow-up BP-check visit is scheduled. These steps are repeated until BP is <140/90 mmHg.
Home participants received a validated Bluetooth-enabled oscillometric Omron N786 BP monitor17 with an appropriately sized upper-arm cuff to take duplicate measurements twice daily for 5 days: after rising and at bedtime (total 20 measurements).18 Home BPs were collected by study staff via Bluetooth.
Kiosk participants were asked to measure BP using validated PharmaSmart BP kiosks19 at KPWA clinics or nearby pharmacies, with triplicate measurements on three separate days.20 Measurements were linked to participants via a kiosk smartcard and collected using the vendor’s cloud-based service.
Clinic, home, and kiosk participants received verbal and written instructions. All participants received the same reminder 2 weeks after their initial visit to complete their diagnostic assignment if they had not already done so.
Reference Standard
All participants were asked to return at 3 weeks for ABPM diagnostic testing by validated Welch Allyn 7100 ABPM (cuff size based on arm circumference, non-dominant arm),21 measuring BP every 30 min, 7AM to 11PM, and hourly, 11PM to 7AM. Patient participants and their physicians received ABPM results and were advised to follow up on tests that were positive for hypertension. ABPM results and communications were documented in the EHR (home and kiosk BPs were not).
Outcomes
The primary outcome was participant’s mean systolic BP for assigned diagnostic method using all available BP data. Mean diastolic BP and diagnostic accuracy were secondary outcomes. Daytime ABPM was defined as the mean of BPs collected 7AM-11PM. Nighttime plus daytime measurements were used for secondary outcomes of mean 24-h and mean nighttime ABPM. Adverse events potentially related to study participation were reported using the question: “Since your last research visit, have you experienced any new or serious health concerns?” BP outcomes at 6 months included receipt of a new hypertension diagnosis in the EHR (based on new ICD-10 code I-11, I-12, or 1-13). Prespecified subgroup comparisons were based on potential to influence diagnostic performance: baseline systolic BP (<150 mmHg vs. ≥150); age (<60 vs. ≥60 years); arm size (<33 vs. ≥33 cm); body mass index (BMI as kg/m2; <30 vs. ≥30); cardiovascular disease (CVD) risk; and race.
Sample Size
With a sample size of 510 (170 per group) and assuming an outcome ascertainment rate of at least 80%, we could detect a 4.1-mmHg difference in systolic and a 2.8-mmHg difference in diastolic BP between any two groups (assuming standard deviation 12.1 mmHg systolic and 8.3 mmHg diastolic). BP differences and standard deviation were based on prior studies comparing clinic, home, and kiosk BP to ABPM.18, 20, 22
Analyses
Primary and secondary outcomes were analyzed among participants completing ≥1 BP diagnostic test measurement and ≥14 daytime reference test ABPM measurements.23 Group differences in the comparability of the diagnostic test systolic BP relative to ABPM (primary outcome), were assessed using linear regression models with the dependent variable defined as within-person difference in systolic BP between the mean diagnostic test and ABPM measures. Models included indicators for diagnostic group, with adjustment for age, sex, BMI, education, and baseline systolic and diastolic BP. Generalized estimating equations with robust standard error were used to relax normality assumptions.24 Fisher protected least significant difference approach was used to protect against multiple comparisons, requiring that the omnibus test of any differences between groups was statistically significant before making pairwise comparisons.25 To address bias due to missing data, a sensitivity analysis was conducted using inverse probability weighting for the primary analysis population only. Group differences for diastolic BP measurement (secondary outcome) were assessed using similar methods. In exploratory analyses, we restricted analyses to those defined a priori as adherent to assigned diagnostic regimen, based on evidence for home and kiosk,18, 20 and usual care for clinic: clinic, 1 outpatient clinic BP; home, 16 measurements over ≥4 days; kiosk, 6 measurements over ≥2 days. Effect modification by baseline BP and participant characteristics (e.g., age, race) was assessed by including interactions between diagnostic method and subgroups. Bland-Altman plots were used to show agreement between diagnostic BP measurements and ABPM.
Secondary analyses assessed the diagnostic performance of clinic, home, and kiosk BP measures by estimating the sensitivity and specificity of each diagnostic method compared to the reference standard, daytime ABPM. Hypertension diagnosis according to the reference standard was defined as mean daytime ABPM systolic ≥135 mmHg and/or diastolic ≥85 mmHg. For each diagnostic method, we defined a positive test as mean diagnostic BP above a threshold for hypertension of systolic BP ≥140 mmHg and/or diastolic BP ≥90 mmHg for clinic and systolic ≥135 mmHg and/or diastolic ≥85 mmHg for home and kiosk.26, 27 Sensitivity was estimated by fitting a logistic regression model with an indicator for a positive test result as the dependent variable and diagnostic group as the dependent variable among participants with hypertension by ABPM. Specificity estimates were similar but with an indicator for a negative test result as dependent variable and diagnostic group as independent variable among participants without hypertension by ABPM. We also estimated positive and negative predictive values, and positive and negative likelihood ratios for each group. Exploratory analyses estimated these diagnostic metrics for a variety of systolic/diastolic pairs of thresholds for defining a positive diagnostic test using receiver operating characteristic (ROC) curves and computed area under the curve (AUC) separately for systolic and diastolic BP. AUC was not calculated for the curve based on systolic/diastolic pairs, because there is no way to vary the paired thresholds across the range of possible values.
Additional exploratory analyses included diagnostic performance assessment using the following: (a) mean 24-h ABPM instead of daytime ABPM as the reference standard with hypertension thresholds of mean systolic ≥130 mmHg and mean diastolic ≥80 mmHg and (b) American College of Cardiology/American Heart Association (ACC/AHA) recommendations for diagnosing stage 1 hypertension (≥130 mmHg systolic or ≥80 mmHg diastolic for mean daytime ABPM, clinic, home, and kiosk BP).5, 26 Analyses used Stata statistical software (release 15). Statistical inference used 2-sided hypothesis tests, and significance threshold P<.05.
RESULTS
We mailed 9434 invitation letters to patients with EHR data showing BP ≥138/88 at their last clinic visit, no hypertension diagnosis, and no antihypertensive medications (Fig. 1). Ineligibility was most commonly because BPs were not elevated at the screening visit. Patient characteristics were similar across randomization groups, with 48% female, 80% white, mean age 59 years, and mean baseline BP 150/88 mmHg (Table 1). Among those randomized to clinic, home, and kiosk, 142 (82.6%), 152 (89.4%), and 140 (83.3%) had sufficient BP data for primary analyses (Fig. 1, Appendix Table 1). ABPM adherence was similar across groups with 91.6% overall completion.
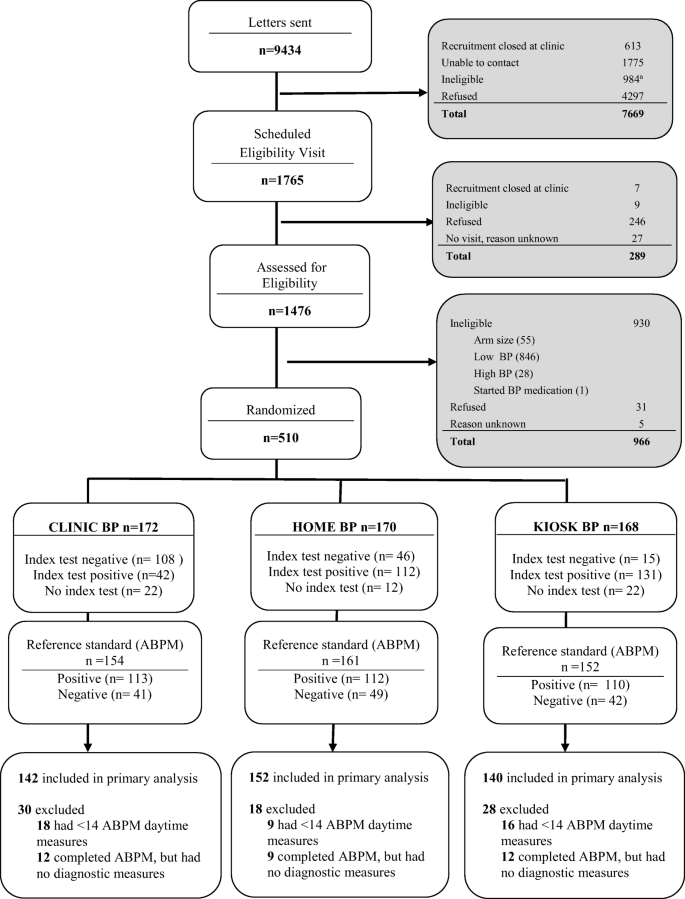
Recruitment, randomization, and follow-up in the BP-CHECK Study. The most common reasons for ineligibility on the follow-up call after invitation letters were sent were going out of town (>2 weeks in the next 2 months), n=509; leaving the health plan, n=174; and unable to converse in English, n=174. Abbreviations: BP, blood pressure; ABPM, 24-h ambulatory blood pressure monitoring.
Primary and Secondary Outcomes
Compared to mean daytime ABPM, adjusted mean differences in systolic BP were as follows: clinic (−4.7 mmHg [95% confidence interval −7.3, −2.2]; P<.001); home (−0.1 mmHg [−1.6, 1.5]; P=.92); and kiosk (9.5 mmHg [7.5, 11.6]; P<.001) (Table 2). Differences for diastolic BP were as follows: clinic (−7.2 mmHg [−8.8, −5.5]; P<.001); home (−0.4 mmHg [−1.4, 0.7]; P=.52); and kiosk (5.0 mmHg [3.8, 6.2]; P<.001). Bland-Altman plots demonstrate the variability of within-person differences (Appendix Figure 1).
Using a diagnostic threshold of daytime mean ABPM ≥135 mmHg systolic or ≥85 mmHg diastolic, 71.7% of participants tested positive for hypertension. Sensitivities for detecting hypertension were 31.1% (95% CI 22.9, 40.6) clinic, 82.2% (73.8, 88.4) home, and 96.0% (90.0, 98.5) kiosk. Specificities were 79.5% (64.0, 89.4) clinic, 53.3% (38.9, 67.2) home, and 28.2% (16.4, 44.1) kiosk (Table 3). False positive rates were 5.6% clinic, 13.8% home, and 20.0% kiosk.
Area under the curve (AUC) analyses for systolic BP (Appendix Figure 2) suggested that HBPM (AUC 0.77, CI 0.69, 0.84) performed better than clinic (AUC 0.64, CI 0.54, 0.71) and similar to kiosk (AUC 0.75, CI 0.70, 0.84) for identifying elevated systolic BP compared to ABPM. For diastolic BP, kiosk (AUC 0.86, CI 0.79, 0.92) performed better than both clinic (AUC 0.75, CI 0.67, 0.83) and HBPM (AUC 0.75, CI 0.67, 0.92). However, caution should be used in interpreting these results as hypertension diagnosis is based on either a high systolic BP or high diastolic BP and not each value separately. Using a variety of thresholds for receiver operating characteristic (ROC) curves demonstrated that home and kiosk performed better than clinic over a range of BP thresholds (Fig. 2). While diagnostic accuracy was similar for home and kiosk, thresholds needed to achieve similar sensitivity and specificity were higher for clinic.

Receiver operating characteristic curves based on paired systolic/diastolic thresholds. TPR, true positive rate; FPR, false positive rate.
Sensitivity and Exploratory Analyses
Planned sensitivity analyses used inverse probability weighting to account for missing outcome data (Appendix Table 2), or were limited to participants adherent to protocol based on a prespecified number of clinic, home, or kiosk BP measurements (Appendix Table 3). Results did not differ from the main analyses. Using ABPM 24-h mean BP with diagnostic threshold ≥130 mmHg systolic or ≥80 mmHg (Appendix Table 4), or ABPM nighttime BP (Appendix Table 5) with diagnostic threshold ≥120 mmHg systolic or ≥70 mmHg made little difference in clinic, home, and kiosk diagnostic performance. Using ACC/AHA thresholds for stage 1 hypertension (systolic BP ≥130 mmHg or diastolic BP ≥80 mmHg) increased hypertension prevalence to 86.2% and improved the sensitivity of clinic, home, and kiosk, but at the expense of specificity (Appendix Table 6). Very high Clinic BPs (≥160/100 mmHg, specificity 94.9%) provided some assurance that white coat hypertension could be ruled out (Appendix Table 7).
Subgroup Analyses
Differences between mean daytime ABPM and mean clinic, home, and kiosk systolic and diastolic BP and diagnostic performance varied little by patient characteristics (Appendix Table A8.a-c).
Intermediate Outcomes
Among the 71.7% (335/467) of individuals with hypertension based on ABPM testing (reference standard), 40.9% (137/335) had a hypertension diagnosis recorded in the EHR by their provider between the baseline and 6-month follow-up visit, with no differences by randomization group.
Adverse Events
No adverse events related to clinic, home, or kiosk BP monitoring were reported. ABPM-related adverse events were reported by 36 participants with 39 complaints: arm discomfort (n=20), skin irritation (n=7), sleep disturbance (n=7), and anxiety or restlessness (n=5).
DISCUSSION
In a real-world diagnostic study conducted in primary care, home mean systolic and diastolic BP did not differ significantly from ABPM. In contrast, clinic BPs were significantly lower and kiosk BPs were significantly higher than ABPM.
A systematic review for the USPSTF evaluated the accuracy of office-based BPs compared to ABPM for screening and confirming hypertension.6, 7 Most but not all studies found that office-based BPs were higher than ABPM.6, 7 Most studies used automated oscillometric or manual mercury BP monitors with attention to optimal technique and multiple measurements averaged. In our study, BP measurements were mainly by medical assistants as part of usual care, typically using aneroid syphyngomanometers. Possible explanations for our finding of clinic BP lower than ABPM include improper measurement technique (e.g., not inflating cuff above true systolic BP, deflating cuff too rapidly, difficulties discerning Korotkoff sounds), end-number rounding, and unintentional bias toward lower BP readings.28, 29 Our findings align with a cluster randomized trial that found systolic BP 7.5 mmHg lower in clinics using manual measurements than clinics with BP measured by validated oscillometric automated monitors (P<.001), with substantial reductions in end-number rounding (systolic BP manual 71%, versus automated 18%; P<.001).30 Routine use of automated monitors, especially with multiple readings taken over several minutes, could lead to average clinic BPs closer to ABPM;31, 32 however, this practice is uncommon in the USA.33
Another reason that clinic BPs may have been lower than ABPM in our setting is because BP is rechecked only if the initial BP was >140/90 as recommended by our healthcare organization and national guidelines.34 This policy, recommended by our healthcare organization and national guidelines was informed in part by Handler et al., which analyzed data from National Health and Nutrition Examination Surveys among 22,641 adults with 3 BP readings.16 Among those with Joint National Committee 7 (JNC7)35 defined stage 1 hypertension (systolic BP ≥140 to <160 mmHg or diastolic ≥90 to <100 mmHg) or stage 2 hypertension (systolic ≥160 mmHg or diastolic ≥100 mmHg), 18.2% and 33.5%, respectively, were reclassified to a lower stage using the mean of the second and third BP readings, and less than 0.5% were reclassified to a higher stage. This was interpreted to mean that no additional measures are needed if the first BP is below a threshold, but if the first BP is high, it should be checked again after 5 min of rest. Criticisms of this paper include lack of comparison to ABPM or repeated BPs taken on separate days. Thus, downward reclassification after repeated BP measurements may lead to a bias of using the lowest BP instead of the true average, which our study suggests.
Lower clinic BPs resulted in lower sensitivity for detecting hypertension than home and kiosk. In the USPSTF review,6, 7 initial screening BPs had low sensitivity and moderate specificity for detecting ABPM-confirmed hypertension, with pooled sensitivity and specificity from 15 studies of 54% and 90%, respectively. However, confirmatory office-based BPs (i.e., after a high screening BP) tended to overdiagnose hypertension with pooled sensitivity and specificity from 8 studies of 80% and 55%.6, 7 These results are in sharp contrast to our study, with clinic sensitivity 31.1% and specificity 79.5%. The negative likelihood ratio (calculated from both sensitivity and specificity) was close to 1.0, indicating that a clinic BP less than 140 mmHg systolic and 90 mmHg diastolic (negative test) had little impact on the likelihood that the ABPM would be negative. Our study suggests that confirmatory BPs in clinic, as practiced in routine care, may be more likely to underdiagnose than overdiagnose hypertension.
Home BP was similar to ABPM. BP is highly variable, particularly among individuals with untreated hypertension, with systolic often varying by 30–40 mmHg or more during daytime hours.36 Home provided many more BPs, with average standard deviation smaller than single or duplicate clinic measurements. Home had higher sensitivity than clinic for detecting hypertension, but at the expense of specificity. However, as most participants had hypertension, false positive rates were relatively low. Our Home BP results are similar to those reported by the USPSTF review,6, 7 which had HBPM pooled sensitivity and specificity 84.0% and 60.0%, respectively. While ABPM is considered the “gold standard,” controversy remains.27 Both ABPM and HBPM are more predictive of cardiovascular events than clinic BPs. Three studies demonstrated that ABPM more closely correlates with left ventricular hypertrophy/mass than HBPM.37,38,39 However, no trials have compared the effectiveness of ABPM and HBPM in preventing CVD events.
Mean systolic and diastolic BPs were significantly higher for kiosk than ABPM. Kiosk diagnostic accuracy was still better than clinic across a range of BP thresholds. The BP kiosk we used was validated against mercury manometers.19 Another study compared it to ABPM,20 with 100 individuals without treated hypertension taking triplicate kiosk BP measurements at local pharmacies on 4 separate days. Kiosk BP was only slightly higher than ABPM (by 2.3±9.5 mmHg systolic, 2.2±6.9 mmHg diastolic). Kiosks in our study were often in busy waiting rooms, possibly leading to higher BPs. While participants were instructed to rest 5 min before measurements, we are not certain they did. Additional study could determine if protocol or equipment adjustments (e.g., rest period, quiet location) improve BP kiosk performance.
Our study used ACC/AHA stage 2 recommendations for making a new diagnosis of hypertension5. Using ACC/AHA stage 1 BP thresholds, 86% of our population tested positive for hypertension. The ACC/AHA guidelines recommend lifestyle behavior change to lower BP for individuals with stage 1 hypertension at low risk for CVD and antihypertensive medications for those at moderate-to-high CVD risk. Most of our population was at moderate-to-high CVD risk and would qualify for antihypertensive medications at the lower stage 1 threshold.5, 40
Even though home BP monitoring performed better than clinic and kiosk, many implementation challenges remain. The tools we used to systematically collect and average home BPs (Bluetooth connectivity and a database for averaging BPs) are not typically available in primary care. Furthermore, although participants and their physicians received ABPM results and the diagnostic interpretation of the test, only 41% of those with a positive test had a hypertension diagnosis recorded in the EHR by 6 months. We know of only one implementation study that is testing different strategies for improving hypertension diagnosis, with results not yet published.41 This US study is testing a multilevel strategy that includes provider presentations, patient information, nurse training for teaching patients to conduct HBPM, EHR-embedded clinical decision support, and increased access to a culturally adapted ABPM service. Results of this study might inform next steps for improving hypertension diagnosis.
Limitations
Study limitations were first, since the study was conducted at a single healthcare organization, results might differ at other settings with different standards for measuring BP, such as use of automated BP. Second, African American and other racial/ethnicity groups were underrepresented. Third, although the accuracy of all BP monitors used was validated by established protocols, results might differ with other monitors.42 Fourth, participants were aware of their diagnostic group assignment and that they had high BP. Contextual and behavioral factors might have influenced BP diagnostic results. Fifth, diagnostic performance may have differed if we included individuals with lower BPs. Sixth, statistical comparisons of AUCs for ROCs of systolic or diastolic BP between diagnostic methods and the reference standard should be interpreted cautiously because the diagnosis of hypertension is based on both systolic or diastolic BP, rather than considering each measure separately, and thresholds for diagnosing hypertension differ across guidelines and subgroups. Last, assessment of comparative performance across measurement methods might have been more robust if participants had completed all three diagnostic regimens. However, our study compared hypertension diagnosis methods as used in real-world settings, which would not be possible with that study design.
CONCLUSIONS
In this diagnostic study, compared to ABPM, clinic had significantly lower and kiosk significantly higher mean BP measures. HBPM was not significantly different, lending further credibility to the utility of home measurements. Most participants with high BP on screening and ABPM diagnostic testing did not receive a hypertension diagnosis. New strategies are needed to improve hypertension diagnosis.
References
Han L, You D, Ma W, et al. National trends in American Heart Association revised Life's Simple 7 metrics associated with risk of mortality among US adults. JAMA network open. 2019;2(10):e1913131.
G. B. D. Risk Factors Collaborators. Global, regional, and national comparative risk assessment of 79 behavioural, environmental and occupational, and metabolic risks or clusters of risks, 1990-2015: a systematic analysis for the Global Burden of Disease Study 2015. Lancet. 2016;388(10053):1659-1724.
Muntner P, Hardy ST, Fine LJ, et al. Trends in blood pressure control among US adults with hypertension, 1999-2000 to 2017-2018. JAMA. 2020;324(12):1190-1200.
U. S. Preventive Services Task Force, Krist AH, Davidson KW, et al. Screening for hypertension in adults: US Preventive Services Task Force reaffirmation recommendation statement. JAMA. 2021;325(16):1650-1656.
Whelton PK, Carey RM, Aronow WS, et al. 2017 ACC/AHA/AAPA/ABC/ACPM/AGS/APhA/ASH/ASPC/NMA/PCNA Guideline for the Prevention, Detection, Evaluation, and Management of High Blood Pressure in Adults: a Report of the American College of Cardiology/American Heart Association Task Force on Clinical Practice Guidelines. Circulation. 2018;138(17):e484-e594.
Guirguis-Blake JM, Evans CV, Webber EM, Coppola EL, Perdue LA, Weyrich MS. Screening for hypertension in adults: updated evidence report and systematic review for the US Preventive Services Task Force. JAMA. 2021;325(16):1657-1669.
Guirguis-Blake JM, Evans CV, Webber EM, Coppola EL, Perdue LA, Weyrich MS. Screening for hypertension in adults: a systematic evidence review for the U.S. Preventive Services Task Force. AHRQ Publication No. 20-05265-EF-1: Prepared for the Agency of Healthcare Research and Quality and the U.S. Department of Human and Health Services; 2020:Evidence Synthesis 197.
Kronish IM, Kent S, Moise N, et al. Barriers to conducting ambulatory and home blood pressure monitoring during hypertension screening in the United States. J Am Soc Hypertens. 2017;11(9):573-580.
Cohen JB, Padwal RS, Gutkin M, et al. History and justification of a national blood pressure measurement validated device listing. Hypertension. 2019;73(2):258-264.
Muntner P, Einhorn PT, Cushman WC, et al. Blood pressure assessment in adults in clinical practice and clinic-based research: JACC Scientific Expert Panel. J Am Coll Cardiol. 2019;73(3):317-335.
Muntner P, Shimbo D, Carey RM, et al. Measurement of blood pressure in humans: a scientific statement from the American Heart Association. Hypertension. 2019;73(5):e35-e66.
Green BB, Anderson ML, Campbell J, et al. Blood pressure checks and diagnosing hypertension (BP-CHECK): design and methods of a randomized controlled diagnostic study comparing clinic, home, kiosk, and 24-hour ambulatory BP monitoring. Contemp Clin Trials. 2019;79:1-13.
El Assaad MA, Topouchian JA, Darne BM, Asmar RG. Validation of the Omron HEM-907 device for blood pressure measurement. Blood Press Monit. 2002;7(4):237-241.
Ma Y, Temprosa M, Fowler S, et al. Evaluating the accuracy of an aneroid sphygmomanometer in a clinical trial setting. Am J Hypertens. 2009;22(3):263-266.
de Greeff A, Reggiori F, Shennan AH. Clinical assessment of the DINAMAP ProCare monitor in an adult population according to the British Hypertension Society Protocol. Blood Press Monit. 2007;12(1):51-55.
Handler J, Zhao Y, Egan BM. Impact of the number of blood pressure measurements on blood pressure classification in US adults: NHANES 1999-2008. J Clin Hypertens. 2012;14(11):751-759.
Altunkan S, Ilman N, Kayaturk N, Altunkan E. Validation of the Omron M6 (HEM-7001-E) upper-arm blood pressure measuring device according to the International Protocol in adults and obese adults. Blood Press Monit. 2007;12(4):219-225.
Nunan D, Thompson M, Heneghan CJ, Perera R, McManus RJ, Ward A. Accuracy of self-monitored blood pressure for diagnosing hypertension in primary care. J Hypertens. 2015;33(4):755-762.
Alpert BS. Validation of the Pharma-Smart PS-2000 public use blood pressure monitor. Blood Press Monit. 2004;9(1):19-23.
Padwal RS, Townsend RR, Trudeau L, Hamilton PG, Gelfer M. Comparison of in-pharmacy automated blood pressure kiosk to daytime ambulatory blood pressurein hypertensive subjects. J Am Soc Hypertens. 2015;9(2):123-129.
Westhoff TH, Schmidt S, Zidek W, van der Giet M. Validation of the Stabil-O-Graph blood pressure self-measurement device. J Hum Hypertens. 2008;22(3):233-235.
Hodgkinson J, Mant J, Martin U, et al. Relative effectiveness of clinic and home blood pressure monitoring compared with ambulatory blood pressure monitoring in diagnosis of hypertension: systematic review. BMJ. 2011;342:d3621.
Bromfield SG, Booth JN, 3rd, Loop MS, et al. Evaluating different criteria for defining a complete ambulatory blood pressure monitoring recording: data from the Jackson Heart Study. Blood Press Monit. 2018;23(2):103-111.
Liang K, Zeger S. Longitudinal data analysis using generalized linear models. Biometrika. 1986;73:13-22.
Levin J, Serlin R, Seaman MA. A controlled, powerful multiple-comparison strategy for several situations. Psychol Bull. 1994;115:153-159.
Muntner P, Carey RM, Jamerson K, Wright JT, Jr., Whelton PK. Rationale for ambulatory and home blood pressure monitoring thresholds in the 2017 American College of Cardiology/American Heart Association guideline. Hypertension. 2019;73(1):33-38.
Shimbo D, Abdalla M, Falzon L, Townsend RR, Muntner P. Role of ambulatory and home BP monitoring in clinical practice. Ann Intern Med. 2015;163(9):691-700.
Kallioinen N, Hill A, Horswill MS, Ward HE, Watson MO. Sources of inaccuracy in the measurement of adult patients' resting blood pressure in clinical settings: a systematic review. J Hypertens. 2017;35(3):421-441.
World Health Organization. WHO technical specifications for automated non-invasive blood pressure measuring devices with cuff. Geneva: World Health Organization. 2020: https://apps.who.int/iris/bitstream/handle/10665/331749/9789240002654-eng.pdf.
Nelson MR, Quinn S, Bowers-Ingram L, Nelson JM, Winzenberg TM. Cluster-randomized controlled trial of oscillometric vs. manual sphygmomanometer for blood pressure management in primary care (CRAB). Am J Hypertens. 2009;22(6):598-603.
Myers MG, Matangi M, Kaczorowski J. Comparison of awake ambulatory blood pressure and automated office blood pressure using linear regression analysis in untreated patients in routine clinical practice. J Clin Hypertens (Greenwich). 2018;20(12):1696-1702.
Roerecke M, Kaczorowski J, Myers MG. Comparing automated office blood pressure readings with other methods of blood pressure measurement for identifying patients with possible hypertension: a systematic review and meta-analysis. JAMA Intern Med. 2019;179(3):351-362.
Todkar S, Padwal R, Michaud A, Cloutier L. Knowledge, perception and practice of health professionals regarding blood pressure measurement methods: a scoping review. J Hypertens. 2021;39(3):391-399.
American Heart Association, American Medical Association. Measure Accurately. https://targetbp.org/blood-pressure-improvement-program/control-bp/measure-accurately/.
Chobanian AV, Bakris GL, Black HR, et al. The seventh report of the Joint National Committee on Prevention, Detection, Evaluation, and Treatment of High Blood Pressure: the JNC 7 report. JAMA. 2003;289(19):2560-2572.
Parati G, Ochoa JE, Lombardi C, Salvi P, Bilo G. Assessment and interpretation of blood pressure variability in a clinical setting. Blood Press. 2013;22(6):345-354.
Zhang L, Li Y, Wei FF, et al. Strategies for classifying patients based on office, home, and ambulatory blood pressure measurement. Hypertension. 2015;65(6):1258-1265.
Anstey DE, Muntner P, Bello NA, et al. Diagnosing masked hypertension using ambulatory blood pressure monitoring, home blood pressure monitoring, or both? Hypertension. 2018;72(5):1200-1207.
Schwartz JE, Muntner P, Kronish IM, et al. Reliability of office, home, and ambulatory blood pressure measurements and correlation with left ventricular mass. J Am Coll Cardiol. 2020;76(25):2911-2922.
SPRINT Research Group, Wright Jr JT, Williamson JD, et al. A randomized trial of intensive versus standard blood-pressure control. N Engl J Med. 2015;373(22):2103-2116.
Kronish IM. Implementing hypertension screening guidelines in primary care. 2018; https://clinicaltrials.gov/ct2/show/NCT03480217.
Stergiou GS, Palatini P, Asmar R, et al. Recommendations and practical guidance for performing and reporting validation studies according to the Universal Standard for the validation of blood pressure measuring devices by the Association for the Advancement of Medical Instrumentation/European Society of Hypertension/International Organization for Standardization (AAMI/ESH/ISO). J Hypertens. 2019;37(3):459-466.
National Heart Lung and Blood Institute, Boston University. Framingham Heart Study risk functions: cardiovascular disease (10-year risk). 2020; https://www.framinghamheartstudy.org/fhs-risk-functions/cardiovascular-disease-10-year-risk/.
D'Agostino RB, Sr., Vasan RS, Pencina MJ, et al. General cardiovascular risk profile for use in primary care: the Framingham Heart Study. Circulation. 2008;117(6):743-753.
Gaziano TA, Young CR, Fitzmaurice G, Atwood S, Gaziano JM. Laboratory-based versus non-laboratory-based method for assessment of cardiovascular disease risk: the NHANES I Follow-up Study cohort. Lancet. 2008;371(9616):923-931.
Green BB, Anderson ML, Cook AJ, McClure JB, Reid R. Using body mass index data in the electronic health record to calculate cardiovascular risk. Am J Prev Med. 2012;42(4):342-347.
Acknowledgements
We acknowledge the contributions of Chris Tachibana, PhD, for scientific editing. We acknowledge the research study team: Camilo Estrada, AA; Ron Johnson, MA; Ann Kelley, MHA; Miriam Marcus-Smith, RN, MHA; Stephen Perry, BS, Stacie Wellwood, LPN, AS; and Margie Wilcox, for their work on recruiting and conducting research visits, and project manager Christine Mahoney, MA, for her contributions in developing and launching data collection. We thank the Kaiser Permanente Washington primary care medical centers that allowed us to enroll their patients and provided space for research visits. We also acknowledge our patient and stakeholder advisory committee for their assistance in planning the study and interpreting the study results. We recognize Jerry Campbell, BS, who contributed to the concept, design, and research processes as a patient co-investigator prior to his death in 2019.
Funding
This work was supported through a Patient-Centered Outcomes Research Institute (PCORI) Project Program Award (CER-1511-32979). All statements in this report, including its findings and conclusions, are solely those of the authors and do not necessarily represent the views of PCORI.
Author information
Authors and Affiliations
Corresponding author
Additional information
Publisher’s Note
Springer Nature remains neutral with regard to jurisdictional claims in published maps and institutional affiliations.
Prior Presentations 1. The North American Primary Care Research Group Annual Meeting, November 24, 2020, webinar, oral presentation selected as one of the top 3 abstracts of the meeting. 2. The Healthcare Systems Research Network Annual Meeting, May 11, 2021, webinar, oral presentation.
Supplementary Information
ESM 1
(DOCX 448 kb)
Rights and permissions
Open Access This article is licensed under a Creative Commons Attribution 4.0 International License, which permits use, sharing, adaptation, distribution and reproduction in any medium or format, as long as you give appropriate credit to the original author(s) and the source, provide a link to the Creative Commons licence, and indicate if changes were made. The images or other third party material in this article are included in the article's Creative Commons licence, unless indicated otherwise in a credit line to the material. If material is not included in the article's Creative Commons licence and your intended use is not permitted by statutory regulation or exceeds the permitted use, you will need to obtain permission directly from the copyright holder. To view a copy of this licence, visit http://creativecommons.org/licenses/by/4.0/.
About this article

Cite this article
Green, B.B., Anderson, M.L., Cook, A.J. et al. Clinic, Home, and Kiosk Blood Pressure Measurements for Diagnosing Hypertension: a Randomized Diagnostic Study. J GEN INTERN MED 37, 2948–2956 (2022). https://doi.org/10.1007/s11606-022-07400-z
Received:
Accepted:
Published:
Issue Date:
DOI: https://doi.org/10.1007/s11606-022-07400-z