
Abstract
In this study, photocatalysis technology was used to reduce water pollution. Decolorization of Reactive Black 5 using nano-TiO2 (NT) as a photocatalyst was investigated by adsorption and degradation experiments. Effects of NT particle size and utilization ratio on the time-dependent flow performance, compressive-flexural strength, and Bohme abrasion resistance of cementitious systems were investigated. In addition to the NT-free control mixture, a total of six photocatalytic self-cleaning mortar mixtures (PSCM) were prepared using NT in two different particle sizes (28 and 38 nm) and three different ratios (0.5%, 1%, and 1.5%). The PSCM sample containing 38 nm NT exhibited superior performance in terms of photocatalytic properties compared to the 28 nm state. It was observed that the flow performance of PSCM mixtures with NT substitution is adversely affected regardless of the NT type. Mixtures containing NT with a lower particle size (28 nm) had higher compressive and flexural strengths.
Find the latest articles, discoveries, and news in related topics.Avoid common mistakes on your manuscript.
Introduction
Air and water pollution caused by rapidly developing industrialization brings along important social concerns (Kalıpcılar et al. 2016; Mardani-Aghabaglou et al. 2019; Sezer et al. 2016; Yiğit et al. 2020; Mardani-Aghabaglou 2016; Yüksel et al. 2016; Şahin and Mardani 2022a). At the forefront of these concerns is “health problems.” It is known that approximately 9% of the total annual carbon emissions come from the construction sector. Studies are being carried out on CO2 emissions resulting from increasing environmental requirements and different suggestions have been presented to reduce CO2 emissions. In a very comprehensive study conducted by Riekstins et al. (2020), it was stated that one of these is to ensure energy efficiency by using grinding aids during clinker grinding, and another is to reduce cement usage by substituting certain amounts of mineral additives into the cement used. The use of mineral admixtures in cementitious systems is widely researched (Şahin et al. 2024a, 2024b).
Volatile organic compounds and inorganic oxides (CO2, NOx, and SOx) in the air accelerate global warming by causing secondary hazards such as acid rain in addition to health problems (Nath et al. 2016). The application of “photocatalysis” technology, which accelerates the natural decomposition process, was accepted as an effective solution to reduce and/or prevent the pollution in question (Yang et al. 2000). With the help of this technology, numerous pollutants, including hydrocarbons, chlorinated hydrocarbons, SO2, CO, and NO, can be transformed directly into H2O and CO2 without the use of an additional carrier gas (Castro-Hoyos et al. 2022). In a study by Beeldens (2008), it was stated that concrete is an ideal substrate for “photocatalysis” reactions due to its large surface area. Similarly, it was stated by various researchers that the self-cleaning and pollutant removal performance is improved when photocatalytic materials are used in concrete (Liang et al. 2019). In this process, energy and time savings are achieved due to the use of sun rays and rain water (Obuchi et al. 1999; Yu and Brouwers 2009). Due to these positive effects, concretes with self-cleaning technology, produced by using materials with photocatalytic properties, have become a popular topic in recent years (Shen et al. 2015; Zailan et al. 2017). Most studies in this area have focused on the use of semiconductor oxides as photocatalysts, such as titanium dioxide (TiO2), zinc oxide (ZnO), cadmium selenide (CdSe), and tungsten oxide (WO3). Compared to other oxides, TiO2 is preferred more because of (i) low cost, (ii) non-toxicity and (iii) good thermal stability, (iv) easy accessibility, and (v) chemical-biological inertness (Yuranova et al. 2007; Yasmina et al. 2014; Lazar et al. 2012; Kweinor Tetteh et al. 2021; Zhang et al. 2016). Apart from its self-cleaning effect, it was reported that the use of nano-TiO2 (NT) has some positive effects on the mechanical properties of cementitious systems (Sanchez and Sobolev 2010; Pacheco-Torgal and Jalali 2011). In a study conducted by Li et al. (2007), it was determined that the flexural-fatigue performance of the concrete mixture increased with the addition of 1% NT. In a study by Daniyal et al. (2019), it was emphasized that the use of NT improves the microstructure by causing a denser matrix formation. In another study by Senff et al. (2012), it was determined that the use of NT increased the compressive strength of concrete mixtures.
The large amount of waste water resulting from industrialization and globalization causes water pollution by being discharged into water resources without undergoing treatment processes. It was emphasized that dyestuffs come first among these pollutants (Lellis et al. 2019). It was declared that the mentioned dyestuffs are classified as nitro, azo, indigo, phtalein, anthraquinone, triphenyl, methyl, and nitrate dyes according to the chemical structures of the chromophore groups. Reactive Black 5 (RB5) dyestuff is in the azo dyestuffs class, which constitutes approximately 70% of the dyestuffs used in the industry (Berradi et al. 2019). It was emphasized that RB5 is a water-soluble synthetic dyestuff found most commonly in wastewater (Jalali Sarvestani and Doroudi 2020). It was understood that the chemical structure of RB5 is characterized by an azo (-N = N-) chromophore group and a sulfonic (-SO3-) functional group (Przystas et al. 2012; Sudha et al. 2014; Benkhaya et al. 2017; Kaplan et al. 2019). Dyestuffs cause deterioration of water quality, decrease in gas solubility, increase in toxicity, allergic reactions, and cancer in the skin by reducing photosynthesis in the aquatic ecosystem (Sudha et al. 2014; Asad et al. 2007; Shanehsaz et al. 2015; Imran et al. 2015; Slama et al. 2021). For this reason, the treatment of dyestuffs from wastewater has become extremely important.
Traditional treatment methods are used to reduce the environmental impact of dyestuffs. It was reported that these methods are (i) ozonation (Snider and Porter 1974), (ii) chlorination (Francy et al. 2012), (iii) sedimentation (Mazari and Abdessemed 2020), (iv) ultrafiltration (Barredo-Damas et al. 2010), and (v) adsorption (Ram et al. 2012; Georgiou et al. 2002).
It was emphasized that traditional treatment methods are not sufficient to remove dyestuffs, despite the various positive effects they provide. Advanced oxidation processes have come about as a result of this. It was understood that photocatalytic decolorization is an advanced oxidation process and is a more effective and sustainable method for the removal of dyestuffs compared to other methods (Natarajan et al. 2018). As emphasized earlier, this process converts organic pollutants into non-toxic small molecules such as CO2, H2O, and HCl using low-energy UV light and a semiconductor (Espulgas et al. 2002; Bizani et al. 2006; Cebeci and Selçuk 2020).
In this study, photocatalysis technology was used to reduce water pollution. It was reported that charcoal (Horgnies et al. 2012), methylene blue (Zhou et al. 2022), and Rhodamine-B (Ruot et al. 2009) are used in concrete structures to control this process. However, in the textile industry, RB5 was found to be removed from fabrics by photocatalysis technology (Tang and Chen 2004). It was emphasized before that RB5 is found in high amounts in wastewater as a dyestuff. In this study, it was planned to remove RB5 by applying the photocatalysis process. Thus, it is foreseen that the quality of wastewater will be increased by applying the photocatalysis process. However, the use of NT is also aimed to improve the mechanical properties of the produced photocatalytic self-cleaning mortar (PSCM) mixtures. Within the scope of this study, it was aimed to examine the effect of NT particle size and utilization ratio on photocatalytic concrete properties. In addition to the control mixture without NT, six series of NT substituted mixtures were prepared. For this purpose, PSCM mixtures were produced by replacing NT with particle sizes of 28 nm and 38 nm with cement at the rates of 0, 0.5, 1, and 1.5%. Time-dependent flow performance, photocatalytic property, compressive-flexural strength, and Böhme abrasion resistance of PSCM mixtures were determined. The photocatalytic property of the mixtures was examined in two stages: adsorption and decolorization.
Material and method
Materials
CEM I 42.5R type PC was used as a binder. The properties of the cement are shown in Table 1.
Two NT with 28- and 38-nm particle size were used in order to fully comprehend the impact of NT fineness on the performance of cementitious systems. Some properties of the NT used are shown in Table 2.
Crushed limestone aggregate with a Dmax of 2 mm was used in the preparation of photocatalytic self-cleaning mortar (PSCM) mixtures. The specific gravity and water absorption capacity values of the aggregate determined in accordance with TS EN 1097–6 were measured as 2.58 and 0.4%, respectively. Figure 1 shows the SEM analysis image and EDS results of the limestone aggregate. Additionally, the granulometry of the aggregate is shown in Fig. 2.

SEM and EDS analysis of limestone aggregate
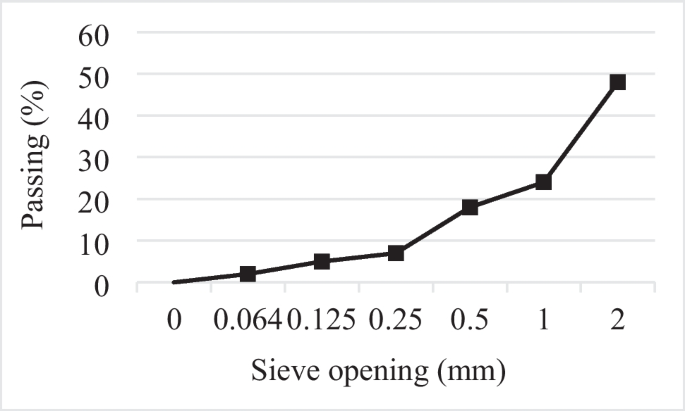
Grading curve of the aggregate used in the study
A polycarboxylate ether-based high range water reducing admixture (HRWRA) was used to achieve a target flow value of 240 ± 20 mm. Some properties of the HRWRA are shown in Table 3.
In experimental studies, RB5 (dye content ≥ 50%) used to determine photocatalytic properties, from Sigma-Aldrich, polyvinyl alcohol (PVA) (Mw = 70.000, ≥ 85% hydrolyzed), toluene (≥ 99%), HCl (32%), benzoyl peroxide (with 25% H2O), NaOH (98%, pellet), and ethyl alcohol were obtained from Merck. The chemical structure of the RB5 dyestuff applied in the study is shown in Fig. 3.
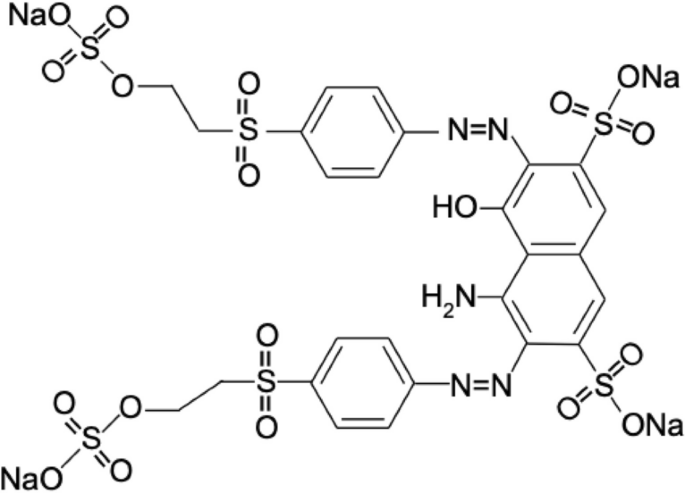
Reactive Black 5
Mixing ratios
In order to examine the effect of NT particle size and utilization ratio on the photocatalytic concrete properties, six series of NT substituted mixtures were prepared in addition to the NT-free control mixture. For this purpose, PSCM mixtures were produced by replacing NT with 28-nm and 38-nm particle sizes with 0, 0.5, 1, and 1.5% cement. Within the scope of the study, the amount of material used in the production of 1 m3 PSCM mixtures with a flow value of 240 ± 20 mm is shown in Table 4. The w/b ratio was kept as 0.45 in all mixtures. The naming of the mixtures was made according to the NT particle size and utilization ratio. For example, the mixture containing NT at a 1% substitution ratio with a particle size of 28 nm was named NT28_1%. The prepared samples were subjected to water curing in accordance with the standard until the test day.
Method
Time-dependent flow performance, photocatalytic property, compressive-flexural strength, and Bohme abrasion resistance of PSCM mixtures were determined. The workflow applied within the scope of the study is shown in Fig. 4.

Workflow carried out within the scope of the study
Flow performance
Nano-materials, which are highly reactive and increase the risk of agglomeration (Wiesner and Bottero 2017), can seriously affect fresh state properties such as time-dependent flow and rheological performance of cementitious systems (Nazar et al. 2020). Thus, it was thought that the properties that provide information about the homogeneity and flowability of cementitious systems should be determined in mixtures containing NT (Jiang et al. 2018; Senff et al. 2012). It was understood that these properties of paste mixtures are generally determined by rheology testing (Şahin and Mardani 2022b, Şahin and Mardani 2023a). It was understood that these properties of mortar and concrete mixtures are generally determined by time-dependent flow performance. According to the literature, it was reported that the rheological properties are generally negatively affected by the addition of nano-materials to the mixture. However, some studies have also been found that state the opposite of this situation. In order to resolve these contradictions, time-dependent flow properties of mortar mixtures were investigated.
Time-dependent flow performance of PSCM mixtures was determined by measuring the flow value in accordance with ASTM C1437. In addition, the flow value was measured time interval 20 min for 60 min in order to examine the effect of NT usage on the flow performance of the mixtures.
Photocatalytic properties
Photocatalytic properties of the mixtures were investigated in two stages as adsorption and decolorization.
Adsorption experiments
It was reported by Ferkous et al. (2022) that the pH value of the solution is the most important factor affecting the adsorption and decolorization of dyestuffs on concrete samples, since the surface charge of the adsorbent changes. For the adsorption and decolorization studies of RB5 dyestuff, the optimum pH value was chosen as pH3 based on previous studies. Three different specimens, control, NT28_1.5%, and NT38_1.5%, were used for adsorption studies of concrete samples. Experimental studies were carried out under the optimum conditions of 25 °C ambient temperature and 30 mg/L solution concentration; it was carried out by taking 50 ml of dyestuff solution. The surface area of the concrete specimens in contact with the dye solution was measured as 75 cm2. RB5 dyestuff solutions containing concrete samples were kept in the dark for 24 h. At the end of the experiment, the remaining dyestuff concentration in the solutions was determined by UV–vis spectrophotometer (Shimadzu-2100 UV–vis, Japan). In Fig. 5, the wavelength-absorbance graph of the RB5 dyestuff is shown. The adsorption capacity (Qe) (mg/g) of the remaining dyestuff concentration in each solution was determined using Eq. 1 (Özer et al. 2015; El-Bery et al. 2022).
where \({C}_{0}\) is the initial dye concentration (mg/L), \({C}_{e}\) is the dye remaining concentration in solution (mg/L), \(v\) is the volume of solution (mL), and \(m\) is the polymer amount (g).
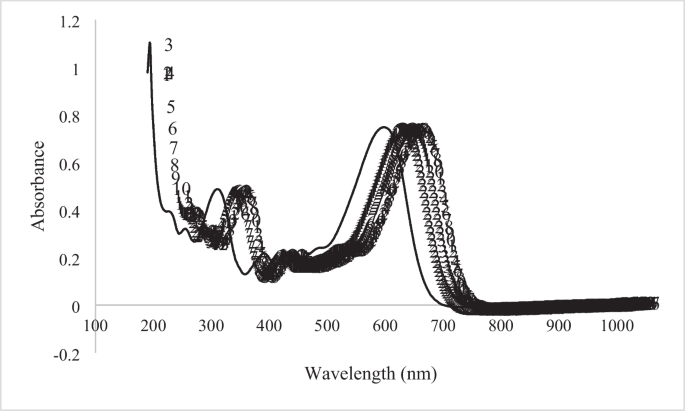
Wavelength-absorbance graph of RB5
Decolorization experiments
Photocatalytic decolorization of RB5 dyestuff was investigated over time. The experiments were carried out under UV light with a wavelength of 366 nm and in a cabinet at a constant temperature of 25 °C. The remaining dyestuff concentration in the solution was determined by UV–vis spectrophotometer. The % removal amount was calculated using Eq. 2 (Elhadj et al. 2020).
where \({C}_{0}\) is the initial dye concentration (mg/cm2), and \({C}_{e}\) is the dye remaining concentration in solution (mg/L).
The adsorption of RB5 dyestuff to PSCM samples is shown in Fig. 6.

Adsorption of RB5 dyestuff to PSCM samples
A schematic depiction of the photocatalytic degradation mechanism of RB5 dyestuff with a concrete sample is presented in Fig. 7. Photocatalytic reactions commence with the excitation of the TiO2 semiconductor by a UV source. The electrons in the valence band move to the conduction band, creating positive vacancies (h +) in the valence band and electrons (e−) in the conduction band. These electron–hole pairs initiate redox reactions by transferring to the surface of the TiO2 photocatalyst. Thus, water molecules or hydroxyl (OH−) ions in the valence band are oxidized by the vacancies to form active hydroxyl radicals (OH). The electrons transitioning to the conduction band also react with O2 molecules on the photocatalyst surface to produce O2−. The free radicals facilitate the degradation of pollutant compounds, leading to their conversion into CO2 and H2O (Koçak Mutlu et al. 2024; Navidpour et al. 2023). This mechanism generally describes not only the removal of pollution in water (dyes, lead, copper, mercury, etc.) but also the elimination of volatile organic compounds in air (benzene, formaldehyde, toluene, etc.) and the self-cleaning ability of the TiO2 semiconductor with the assistance of UV rays (Tsang et al. 2019).

Schematic representation of the photocatalytic degradation mechanism of RB5 dyestuff with concrete sample
Mechanical properties
The 7- and 28-day compressive strength and Bohme abrasion resistance of the mixtures were determined on 50-mm cube samples, respectively, according to ASTM C109 and EN 1338 Standards. The 7- and 28-day flexural strength of the mixtures was determined by performing a three-point bending test on 40 × 40 × 160 mm prism specimens in accordance with TS EN 196–1 Standard.
Experimental results and discussion
Photocatalytic properties
RB5 adsorption capacities and photocatalytic decolorization of control, NT28_1.5%, and NT38_1.5% are shown in Figs. 8 and 9, respectively.

Adsorption capacity

Graph of % removal over time
Regardless of the particle size, the adsorption capacity of the mixtures containing NT was found to be higher than the control mixture. Also, it is seen that the 38 nm NT-containing PSCM sample has better RB5 adsorption capacity and dye removal performance than the 28-nm case. It was stated by Gunnelius et al. (2014) that the surface area and activity of NT increase with increasing particle fineness. It is thought that the hydration rate is higher in mixtures containing NT with a particle size of 28 nm (Li et al. 2020). It was also stated by Nazari and Riahi (2010) and Nazari et al. (2010) that with the decrease in the particle fineness of NT, the potential of NTs that do not or only slightly bind to CH to leak to the surface is high. In this case, it is thought that the particles infiltrating the surface increase the photocatalytic effect. As expected, the percentage of dye removal increased over time.
In a study by Kalkan et al. (2014), the removal of RB5 from aqueous solutions using silica fume after its modification with laccase from Russulaceae (Lactarius volemus) was examined. It was shown that the adsorption experimental data agreed well with the Langmuir isotherm model, and the adsorption capacity was found to be 322.58 mg/g. As a result, it has been understood that laccase-modified silica fume can be used as an alternative low-cost adsorbent in the processing of aqueous solutions. In another study conducted by Erdal et al. (2010), the removal of textile dye RB5 color by actively growing the mycelium of the Penicillium chrysogenum MT-6 fungus isolated from cement-contaminated soil was examined. The maximum removal/uptake of dye by the fungus was measured to be 89% with a biomass production of 3.83 g/l at an initial dye concentration of 0.3 g/l in 100 h. As a result, it was determined that the fungus is a good biosystem for decolorizing the medium containing RB5.
In order to explain the decolorization kinetics of RB5 dyestuff in the presence of concrete samples, a suitable kinetic model was searched by drawing ln(C/C0) − t graphs. The degradation kinetics of RB5 dyestuff were also evaluated by literature studies and explained with a first-order kinetic model (Hang et al. 2005).
where r is the rate and Kapp (min−1) the apparent first-order rate constant; the integration of Eq. (4) gives:
It is known that the ln(C/C0) graph is linear and examined as a function of time (David and Vedhi 2017). A constant Kapp value is characteristic of the photocatalytic process and defines that the model conforms to the Langmuir–Hinshelwood model, where the reaction takes place in diluted medium (Elhadj et al. 2020). The graph of 1/Kapp vs. C0 is presented in Fig. 10.

1/Kapp-C graph
Modeling of degradation kinetics by the Langmuir–Hinshelwood
The Langmuir–Hinshelwood (L–H) model states that dyestuffs are adsorbed according to the Langmuir model before undergoing photocatalytic degradation (Elhadj et al. 2020). Adsorption of RB5 dyestuff on the surface of concrete samples affects the rate of degradation. The L–H equation, which expresses the connection between concentration and velocity, is given in Eq. 5.
where Ks (L/mg) is the adsorption constant; Kr (mg/L.min) represents the rate of reaction.
Linear form of the equation:
1/Kaap is expressed as a function of Cr. Looking at the graph in Fig. 10, it is seen that the curve is linear (r = 0.9969). This shows that it is compatible with the L–H model.
Time-dependent flow performance
The flow value of the PSCM mixtures produced within the scope of the study, measured every 20 min for 60 min, and the HRWRA requirement where the target flow value is achieved are shown in Table 5. Regardless of the utilization ratio and particle size, it was understood that the need for HRWRA increased in order to achieve the desired flow value with NT substitution into the mixture. In a similar study (Joshaghani et al. 2020), it was emphasized that the workability was adversely affected by the use of 5% NT, and this was due to the increased water requirement of the mixtures. Similar results were obtained by Nazari and Riahi (2010) and Nazari et al. (2010). According to Lee and Kurtis (2010), the use of NT in cementitious systems increases the hydration rate of C3S, causing the formation of C–S–H gel at earlier ages. It was emphasized that this situation causes an increase in the degree of hydration of cementitious systems and negatively affects the workability. Similar statements were also reported by Singh et al. (2015). In another study by Chen et al. (2012), it was found that when 5% and 10% NT are substituted into the mixture, the water requirement to achieve target flow value increases by 7 and 15%, respectively. It was emphasized that this may be due to the rapid free water consumption accelerating the bridging process of the voids, resulting in increased viscosity and earlier solidification. It was reported by Ma et al. (2016) that the addition of NT accelerates the formation and precipitation of early hydration products. It was emphasized that this situation caused the workability properties of NT-containing mixtures to be adversely affected.
It is also understood from Table 5 that the decrease in flow performance as a result of NT substitution into the mixture becomes more evident with the decrease in NT particle size. As a result of the addition of 1.5% of NT with 28- and 38-nm particle sizes to the mixture, it was understood that the need for HRWRA in PSCM mixtures increased by 29% and 14%, respectively. It is thought that the need for HRWRA is higher due to the increase in the wettable surface area (Durgun et al. 2022; Mardani-Aghabaglou et al. 2018; Özen et al. 2021; Şahin et al. 2022, 2020; Şahin and Mardani 2023b) and the amount of adsorbed water due to the increased surface area due to the decrease in NT particle size (Kuo et al. 2006). It was reported by Chen et al. (2012) that the rapid hardening potential, which is directly dependent on the NT particle size and utilization ratio, directly affects the consistency retention capacity of the mixtures.
It is understood from the table that 0.5% substituted PSCM mixtures in both particle sizes exhibited the best consistency retention performance at 60 min. In addition, it was observed that mixtures containing 0.5% NT have better consistency retention performance, regardless of particle size. It was observed that the consistency retention capacity decreased as the NT substitution ratio increased. It was reported by Wang et al. (2018) that this may be due to the increase in the hydration rate and the acceleration of the setting due to the increase in NT substitution.
Mechanical properties
Compressive strength
Compressive strength (CS) results of PSCM are shown in Fig. 11. It was understood that the CS of the mixtures containing NT with a lower particle size value (28 nm) was higher regardless of the sample age. This condition is believed to be the result of the quick consumption of Ca(OH)2 produced during the hydration of portland cement, which was brought on by the NT’s smaller particle size, increased surface area, and increased reactivity. However, it was stated by Nazari et al. (2010) that the use of NT improves the particle packing density of the cement and thus less large pores are formed in the cement paste.

Seven- and 28-day CS values of PSCM
It was observed that the 7-day CS increased by 1, 11, and 6%, respectively, with 0.5%, 1.0, and 1.5% NT substitution with 28-nm particle size to the control mixture. In 28-day samples, this rate was found to be 1, 19, and 11, respectively. Thus, it was determined that the optimum NT particle size and utilization ratio in terms of CS were 28 nm and 1%, respectively. It was understood that the use of NT above this ratio affects the CS of PSCM mixtures negatively. It was emphasized that this situation may be due to the decrease in the crystalline Ca(OH)2 content required for C-S–H gel formation with the increase of NT, on the one hand, and the increase in the amount of voids in the matrix as a result of the presence of large amounts of nano-particles in the system (Sorathiya et al. 2017). Similarly, in a study where NT with a particle size of 15 nm was used at 0.5, 0.75, 1, 1.25, and 1.50% of the cement weight, it was emphasized that the optimum NT usage rate in terms of CS was 1% (Sorathiya et al. 2017). In another study by Nazari et al. (2010), it was determined that the CS value obtained when 2% of NT with a particle size of 15 nm is used is similar to the control mixture without NT. According to reports, the combination contains more NT particles than is necessary for them to react with the lime that is produced during the hydration process. This results in excessive particle leakage and negatively affects the mixture’s strength. Similar results were also reported by Dikkar et al. (2021). In another study conducted by Mohd Sani et al. (2022), it was reported that the CS increased with an increase of 1% in the use of NT, but decreased above this rate. However, in a study conducted by Sharma et al. (2019), it was observed that the maximum CS value in mixtures containing NT with a particle size of 15 nm is obtained when 1.5% NT is used.
Various studies in the literature (Feng et al. 2013; Khataee et al. 2013; Karapati et al. 2014; Zhu et al. 2022; Mousavi et al. 2021) have emphasized that the optimum NT usage rate in cementitious mixtures containing NT is between 1 and 2%. In a study conducted by Zhu et al. (2022), the compressive strength of cement paste produced using different proportions of NT was examined. It has been reported that the mixture with optimum compressive strength contains 2% NT. In a study conducted by Khushwaha et al. (2015), the compressive strength of mixtures with 1%, 2%, and 3% NT content was examined. It has been determined that the strength decreases with increasing dosage. According to Chen et al. (2012), the compressive strength of mixtures containing two different NTs with particle sizes of 21 nm and 350 nm was examined. It was stated that the 7- and 28-day compressive strengths of the mixture containing 21 nm NT were higher than the results of the mixture containing 350 nm NT. It has been emphasized that the increase in strength is greater as the particle size decreases. However, the study conducted by Li (2021) reported the opposite. It was emphasized that as the particle size increases, it can absorb less amount of water as its surface area decreases. It was emphasized that NTs used in smaller particle sizes will deteriorate the W/B ratio, negatively affect workability, and cause internal defects. It was stated in various studies that the dosage of NT usage is important to increase the compressive strength in cementitious systems and that it depends on many parameters such as particle size, distribution, W/B ratio, and curing temperature (Li et al. 2023; Moro et al. 2020; Francioso et al. 2019, Pimenta Teixeira et al. 2016).
Unlike the mixtures containing NT with a particle size of 28 nm, the 7-day CS was decreased by 15, 12, and 2%, respectively, with 0.5%, 1.0, and 1.5% substitution of NT with 38-nm particle size in the control mixture. It was understood that this decrease was 7 and 6%, respectively, in the samples with 0.5% and 1% NT replacement for 28 days. A 3.5% increase in strength was measured for the mixture containing 1.5% NT. It is thought that this negative effect experienced with the use of NT with 38-nm particle size is due to its relatively lower surface area and reactivity compared to 28 nm NT.
Three-point flexural strength
Seven- and 28-day three-point flexural strength (FS) results of PSCM are presented in Fig. 12. FS values increased with the addition of NT to the mixture, regardless of particle size and sample age. It was understood that there are different opinions about this behavior in the literature. Nazari and Riahi (2010) and Nazari et al. (2010) suggested that this is due to the acceleration of the hydration reaction, especially at early ages, with the addition of NT, and thus the formation of hydration products in larger volumes. However, according to Meng et al. (2012), this increase in FS was not due to the increase in the amount of hydration products, which was due to the decrease in the orientation index for the core function. On the other hand, it was stated by Nazari and Riahi (2010) and Nazari et al. (2010) that NTs provide the reduction of voids in cementitious systems by recovering the particle packing density of the cement, thus contributing to the increase in strength. It was determined that the 7-day FS were increased by 15, 16, and 20%, respectively, with 0.5%, 1.0, and 1.5% NT substitution with 28-nm particle size to the control mixture.

Results of FS of mixtures
In a similar study (Selvasofia et al. 2022), in which NT was used at 1, 2, 3, and 4% of cement weight, it was found that 2% and 3% NT substituted mixtures had the highest FS values. In order to explain the reason for this situation, FESEM images were examined. It was observed that in the 2% and 3% NT substituted state, a homogeneous C-S–H gel with relatively few spaces between the particles was formed. In addition, it was reported that NT used at the rate of 2% and 3% is fully bonded to the cement, resulting in a stronger bond and increased FS. However, it was understood that the highest FS values in the 28-day samples were obtained when the NT usage rate was 0.5% and it was not necessary to increase the usage rate. A similar statement was also stated by Meng et al. (2012).
In NT-substituted mixtures with 38-nm particle size, 4% and 13% reductions were measured in 7- and 28-day FS, respectively, with an increase in NT utilization rate from 0.5 to 1.5%. In a study conducted by Salman et al. (2016), the effect of using 0.25%, 0.75, 1.25, and 1.75% NT on the FS of mixtures was investigated. As a result, it was reported that the use of NT up to 0.75% causes the FS of the mixtures to increase, but the use of NT above this ratio causes the FS values to be adversely affected. It was stated that in the case of 0.75% of the cement weight NT is used, it acts as a filler to strengthen the microstructure of the system, reduces the amount and size of CH crystals, and increases the strength due to filling the voids of the C-S–H gel structure. However, it was reported that there is a decrease in nano-particle distance with an increase in the amount of NT use up to 1.75%, and the CH crystal cannot grow to the appropriate size due to the limited space, and this causes a decrease in strength.
As with the CS values, it was measured that the NT-containing mixtures with a particle size of 28 nm have a higher FS value than the mixtures containing NT with a particle size of 38 nm, regardless of the NT utilization rate. With smaller particle size, the number of surface atoms increases, depending on the increase in the surface area. It was emphasized that the highly active and unstable nature of these surface atoms causes an increase in the hydration reaction rate and higher strengths (Kuo et al. 2006).
In addition, it was observed that the optimum NT utilization rate was 0.5% in terms of FS, regardless of particle size. In this case, the mixture with the highest FS was NT28_0.5%.
Bohme abrasion resistance
The 7- and 28-day Bohme abrasion resistance (B’AR) results of PSCM specimens are shown in Fig. 13. It was found that mixtures containing NT had higher B’AR at all ages, independent of NT particle size and utilization ratio. This situation was thought to be due to the formation of a denser matrix with the use of nano-materials and the reduction of the permeability of the system due to the nucleation effect (Selvasofia et al. 2022). A study by Chen et al. (2012) reported that as hydration continues, aggregations containing nano-particles expand and fill the void space around them over time, contributing to the reduction of porosity over time. On the other hand, Gartner et al. (2002) emphasized that the decrease in porosity as a result of nano-material addition is due to the physical clogging of capillary spaces.

Bohme abrasion resistance results
Effect of NT usage rate on the B’AR of the mixtures varies depending on the sample age, particle size, and NT usage rate. It was observed that the mass loss of 7-day PSCM decreased with the increase in the use of NT with 28-nm particle size up to 1%. However, the opposite was found with NT substitution above this ratio. It was understood that the mass loss increased continuously with the increase in the use of NT in the 28-day samples. In mixtures containing NT with a particle size of 38 nm, regardless of the sample age, it was understood that the mass loss increased as the NT usage rate increased up to 1%, but decreased above this rate.
It was found that NT substituted mixtures with 38-nm particle size have higher B’AR than mixtures containing 28 nm NT. This is thought to be due to the increase in the particle size of NT and the NTs that do not bind to CH leak onto the surface (Nazari and Riahi 2010; Nazari et al. 2010), contributing to the hardening of the surface and thus to the increase in B’AR. When the 7-day B’AR performance was examined, it was observed that the NT38_1.5% mixture had a 50% higher B’AR compared to the control mixture. This result was measured to be followed by the NT28_1.0% mixture, which had a 40% increase compared to the control. In the 28-day samples, the mixture with the best B’AR was found to be NT38_0.5% (44% increase compared to control), followed by NT28_0.5% (33% increase compared to control).
Microstructure ımages
Microstructure images of the mixtures produced within the scope of the study are shown in Fig. 14. The micro-structure of the specimens was studied by using Carl Zeiss/Gemini 300 electron microscope. Scanning electron microscopy (SEM) analyses were attempted to identify the properties of mentioned materials. When Fig. 14 is examined, the effect of NT addition on density and porosity is clearly understood. It was observed that the cracks and pores in the control mixture, shown with the red line, decreased with the use of NT, regardless of the fineness of the NT. Similarly, in a study conducted by Feng et al. (2013), cement paste containing 0.1, 0.5, 1.0, and 1.5% of the cement mass with NT and a water/cement ratio of 0.4 was prepared and SEM images were examined. As a result, it was observed that NT substitution greatly reduced the amount of internal microcracks in the cement paste. Also, it was emphasized that a new type of needle-shaped hydration product was observed.

Microstructure images of mixtures
Conclusions
The following results are provided in line with the study’s materials and the practical experiments:
-
It was understood that the mixtures containing NT with a higher particle size value (38 nm) in terms of photocatalytic properties performed better.
-
It was determined that decolorization kinetics were compatible with Langmuir–Hinshelwood model in all mixtures regardless of NT particle size and utilization ratio.
-
It was understood that the flow performance of PSCM mixtures was negatively affected by NT substitution. This situation became more evident with the increase in NT utilization ratio and the decrease in particle size.
-
It was determined that the addition of 1.5% of NT with particle sizes of 28 and 38 nm to the mixture raised the requirement for HRWRA in PSCM mixes by 29% and 14%, respectively.
-
CS of the mixtures containing NT with lower particle size (28 nm) was higher. In terms of compressive strength, the optimum NT particle size and utilization ratio were found to be 28 nm and 1%, respectively.
-
It was found that when 0.5%, 1.0, and 1.5% of the NT replacement with 28-nm particle size was added to the control mixture, the 7-day CS increased by 1, 11, and 6%, respectively. This rate was determined to be 1, 19, and 11 in 28-day samples.
-
It was determined that flexural strength and Bohme abrasion resistance values increased with the addition of NT to the control mixture, regardless of particle size and sample age. In terms of flexural strength, the optimum NT utilization rate was 0.5%. NT-substituted mixtures with 38-nm particle size were measured to have higher abrasion resistance.
-
It was found that when 0.5%, 1.0, and 1.5% of the NT replacement with 28-nm particle size was added to the control mixture, the 7-day CS increased by 1, 11, and 6%, respectively. This rate was determined to be 1, 19, and 11 in 28-day samples.
-
When the 7-day B’AR performance was examined, it was measured that the NT38_1.5% mixture had a 50% higher B’AR value than the control mixture, and the NT28_1.0% mixture showed a 40% increase compared to the control.
Data availability
The data that support the findings of this study are available on request from the corresponding author.
References
Asad S, Amoozegar MA, Pourbabaee AA, Sarbolouki MN, Dastgheib SMM (2007) Decolorization of textile azo dyes by newly isolated halophilic and halotolerant bacteria. Biores Technol 98(11):2082–2088. https://doi.org/10.1016/J.BIORTECH.2006.08.020
Barredo-Damas S, Alcaina-Miranda MI, Bes-Piá A, Iborra-Clar MI, Iborra-Clar A, Mendoza-Roca JA (2010) Ceramic membrane behavior in textile wastewater ultrafiltration. Desalination 250(2):623–628. https://doi.org/10.1016/j.desal.2009.09.037
Beeldens A (2008) Air purification by pavement blocks: final results of the research at the BRRC. Air purification by pavement blocks: final results of the research at the BRRC. Transport Research Arena Europe, Ljubljana
Benkhaya S, Harfi SE, Harfi AE (2017) Classifications, properties and applications of textile dyes: a review. Appl J Environ Eng Sci 3(3):311–320. https://doi.org/10.48422/IMIST.PRSM/ajees-v3i3.9681. (N°3(2017))
Berradi M, Hsissou R, Khudhair M, Assouag M, Cherkaoui O, el Bachiri A, el Harfi A (2019) Textile finishing dyes and their impact on aquatic environs. Heliyon 5(11):e02711. https://doi.org/10.1016/J.HELIYON.2019.E02711
Bizani E, Fytianos K, Poulios I, Tsiridis V (2006) Photocatalytic decolorization and degradation of dye solutions and wastewaters in the presence of titanium dioxide. J Hazard Mater 136(1):85–94. https://doi.org/10.1016/j.jhazmat.2005.11.017
Castro-Hoyos AM, Rojas Manzano MA, Maury-Ramírez A (2022) Challenges and opportunities of using titanium dioxide photocatalysis on cement-based materials. Coatings 12(7):968
Cebeci MS, Selçuk SF (2020) Dye removal and mineralization from wastewater by photocatalytic method [In Turkish]. Acad Platform J Eng Sci 8(3):533–539. https://doi.org/10.21541/APJES.625338
Chen J, Kou SC, Poon CS (2012) Hydration and properties of nano-TiO2 blended cement composites. Cement Concr Compos 34(5):642–649
Daniyal M, Akhtar S, Azam A (2019) Effect of nano-TiO2 on the properties of cementitious composites under different exposure environments. J Market Res 8(6):6158–6172
David SA, Vedhi C (2017) Synthesis of nano Co3O4-MnO2-ZrO2 mixed oxides for visible-light photocatalytic activity. Int J Adv Res Sci Eng 6(01):613–623
Dikkar H, Kapre V, Diwan A, Sekar SK (2021) Titanium dioxide as a photocatalyst to create self-cleaning concrete. Mater Today: Proc 45:4058–4062
Durgun MY, Özen S, Karakuzu K, Kobya V, Bayqra SH, Mardani-Aghabaglou A (2022) Effect of high temperature on polypropylene fiber-reinforced mortars containing colemanite wastes. Constr Build Mater 316:125827
El-Bery HM, Saleh M, El-Gendy RA, Saleh MR, Thabet SM (2022) High adsorption capacity of phenol and methylene blue using activated carbon derived from lignocellulosic agriculture wastes. Sci Rep 12(1):5499
Elhadj M, Samira A, Mohamed T, Djawad F, Asma A, Djamel N (2020) Removal of Basic Red 46 dye from aqueous solution by adsorption and photocatalysis: equilibrium, isotherms, kinetics, and thermodynamic studies. Sep Sci Techn 1–19. https://doi.org/10.1080/01496395.2019.1577896
Erdal S, Taskin M (2010) Uptake of textile dye reactive black-5 by penicillium chrysogenum MT-6 isolated from cement-contaminated soil. Afr J Microbiol Res 4(8):618–625
Espulgas S, Giménez J, Contreras S, Pascual E, Rodríguez M (2002) Comparison of different advanced oxidation processes for phenol degradation. Water Res 36:1034–1042
Feng D, Xie N, Gong C, Leng Z, Xiao H, Li H, Shi X (2013) Portland cement paste modified by TiO2 nanoparticles: a microstructure perspective. Ind Eng Chem Res 52(33):11575–11582
Ferkous H, Rouibah K, Hammoudi NEH, Alam M, Djilani C, Delimi A, Laraba O, Yadav KK, Ahn HJ, Jeon BH, Benguerba Y (2022) The removal of a textile dye from an aqueous solution using a biocomposite adsorbent. Polymers 14(12):2396. https://doi.org/10.3390/POLYM14122396
Francioso V, Moro C, Martinez-Lage I, Velay-Lizancos M (2019) Curing temperature: a key factor that changes the effect of TiO2 nanoparticles on mechanical properties, calcium hydroxide formation and pore structure of cement mortars. Cement Concr Compos 104:103374
Francy DS, Stelzer EA, Bushon RN, Brady AMG, Williston AG, Riddell KR, Borchardt MA, Spencer SK, Gellner TM (2012) Comparative effectiveness of membrane bioreactors, conventional secondary treatment, and chlorine and UV disinfection to remove microorganisms from municipal wastewaters. Water Res 46:4164–4178. https://doi.org/10.1016/j.watres.2012.04.044
Gartner EM, Young JF, Damidot DA, Jawed I (2002) Hydration of Portland cement. Struct Perform Cements 2:57–113
Georgiou D, Melidis P, Aivasidis A, Gimouhopoulos K (2002) Degradation of azo-reactive dyes by ultraviolet radiation in the presence of hydrogen peroxide. Dyes Pigm 52(2):69–78. https://doi.org/10.1016/S0143-7208(01)00078-X
Gunnelius KR, Lundin TC, Rosenholm JB, Peltonen J (2014) Rheological characterization of cement pastes with functional filler particles. Cem Concr Res 65:1–7
Hang H, Duan L, Zhang Y, Wu F (2005) The use of ultrasound to enhance the decolorization of the CI Acid Orange 7 by zero-valent iron. Dyes Pigm 65(1):39–43
Horgnies M, Dubois-Brugger I, Gartner EM (2012) NOx de-pollution by hardened concrete and the influence of activated charcoal additions. Cem Concr Res 42(10):1348–1355
Imran M, Crowley DE, Khalid A, Hussain S, Mumtaz MW, Arshad M (2015) Microbial biotechnology for decolorization of textile wastewaters. Rev Environ Sci Bio/technology 14:73–92. https://doi.org/10.1007/s11157-014-9344-4
Jalali Sarvestani MR, Doroudi Z (2020) Removal of reactive black 5 from waste waters by adsorption: a comprehensive review. J Water Environ Nanotechnol 5(2):180–190
Jiang S, Shan B, Ouyang J, Zhang W, Yu X, Li P, Han B (2018) Rheological properties of cementitious composites with nano/fiber fillers. Constr Build Mater 158:786–800
Joshaghani A, Balapour M, Mashhadian M, Ozbakkaloglu T (2020) Effects of nano-TiO2, nano-Al2O3, and nano-Fe2O3 on rheology, mechanical and durability properties of self-consolidating concrete (SCC): an experimental study. Constr Build Mater 245:118444
Kalıpcılar İ, Mardani-Aghabaglou A, Sezer Gİ, Altun S, Sezer A (2016) Assessment of the effect of sulfate attack on cement stabilized montmorillonite. Geomech Eng 10(6):807–826
Kalkan E, Nadaroğlu H, Celebi N, Tozsin G (2014) Removal of textile dye Reactive Black 5 from aqueous solution by adsorption on laccase-modified silica fume. Desalin Water Treat 52(31–33):6122–6134
Kaplan BE, Kara A, Eren HA (2019) Temperature effects on the adsorption with microbeads in Reactive Black 5 m-poly (EGDMA-VIM). J Phys Chem Funct Mater 2(1):5–11
Karapati S, Giannakopoulou T, Todorova N, Boukos N, Antiohos S, Papageorgiou D, Chaniotakis E, Dimotikali D, Trapalis C (2014) TiO2 functionalization for efficient NOx removal in photoactive cement. Appl Surf Sci 319:29–36
Khataee R, Heydari V, Moradkhannejhad L, Safarpour M, Joo SW (2013) Self-cleaning and mechanical properties of modified white cement with nanostructured TiO2. J Nanosci Nanotechnol 13(7):5109–5114
Khushwaha A, Saxena R, Pal S (2015) Effect of titanium dioxide on the compressive strength of concrete. J Civ Eng Environ Technol 2(6):482–486
Koçak Mutlu G, Kara A, Tekin N, Demirel S (2024) Synthesis and characterization of 1-vinyl-1,2,4-triazole, m-poly(EGDMA-VTA)-TiO2 polymer composite particles and the using of Reactive Orange 16 dye in adsorption and photocatalytic decolorization. Colloid Polym Sci 2024(302):623–642. https://doi.org/10.1007/s00396-023-05213-y
Kuo WT, Lin KL, Chang WC, Luo HL (2006) Effects of nano-materials on properties of waterworks sludge ash cement paste. J Ind Eng Chem 12(5):702–709
Kweinor Tetteh E, Rathilal S, Asante-Sackey D, Noro Chollom M, Castanheira Coutinho S (2021) Materials prospects of synthesized magnetic TiO2-based membranes for wastewater treatment: a review. https://doi.org/10.3390/ma14133524
Lazar MA, Varghese S, Nair SS (2012) Photocatalytic water treatment by titanium dioxide: recent updates. Catalysts 2(4):572–601. https://doi.org/10.3390/CATAL2040572
Lee BY, Kurtis KE (2010) Influence of TiO2 nanoparticles on early C3S hydration. J Am Ceram Soc 93(10):3399–3405
Lellis B, Fávaro-Polonio CZ, Pamphile JA, Polonio JC (2019) Effects of textile dyes on health and the environment and bioremediation potential of living organisms. Biotechnol Res Innov 3(2):275–290. https://doi.org/10.1016/J.BIORI.2019.09.001
Li H, Zhang MH, Ou JP (2007) Flexural fatigue performance of concrete containing nano-particles for pavement. Int J Fatigue 29(7):1292–1301
Li H, Ding S, Zhang L, Ouyang J, Han B (2020) Effects of particle size, crystal phase and surface treatment of nano-TiO2 on the rheological parameters of cement paste. Constr Build Mater 239:117897
Li S, Hu M, Chen X, Sui S, Jin L, Geng Y, Jiang J, Liu A (2023) The performance and functionalization of modified cementitious materials via nano titanium-dioxide: a review. Case Stud Constr Mater e02414
Li Z (2021) Effect and mechanism of modification of mechanical and functional properties of cementitious materials by titanium dioxide nanoparticles (Dissertation for the Master Degree in Engineering), Dalian University of Technology
Liang X, Cui S, Li H, Abdelhady A, Wang H, Zhou H (2019) Removal effect on stormwater runoff pollution of porous concrete treated with nanometer titanium dioxide. Transp Res Part d: Transp Environ 73:34–45
Ma B, Li H, Li X, Mei J, Lv Y (2016) Influence of nano-TiO2 on physical and hydration characteristics of fly ash–cement systems. Constr Build Mater 122:242–253
Mardani-Aghabaglou A, Özen S, Altun MG (2018) Durability performance and dimensional stability of polypropylene fiber reinforced concrete. J Green Build 13(2):20–41
Mardani-Aghabaglou A, İlhan M, Özen S (2019) The effect of shrinkage reducing admixture and polypropylene fibers on drying shrinkage behaviour of concrete. Cement-Wapno-Beton= Cement Lime Concrete 24(3):227–237
Mardani-Aghabaglou A (2016) Investigation of cement-superplasticizer admixture compatibility. Doctoral dissertation, Civil Engineering Department, Engineering Faculty, Ege University, Turkey, Izmir
Mazari L, Abdessemed D (2020) Feasibility of reuse filter backwash water as primary/aid coagulant in coagulation–sedimentation process for tertiary wastewater treatment. Arab J Sci Eng 45:7409–7417. https://doi.org/10.1007/s13369-020-04597-1
Meng T, Yu Y, Qian X, Zhan S, Qian K (2012) Effect of nano-TiO2 on the mechanical properties of cement mortar. Constr Build Mater 29:241–245
Mohd Sani MSH, Muftah F, Ahmad N (2022) An assessment of mechanical properties on self-cleaning concrete ıncorporating rutile titanium dioxide. Design in Maritime Engineering: Contributions from the ICMAT 2021. Springer International Publishing, Cham, pp 287–298
Moro C, Francioso V, Velay-Lizancos M (2020) Nano-TiO2 effects on high temperature resistance of recycled mortars. J Clean Prod 263:121581
Mousavi MA, Sadeghi-Nik A, Bahari A, Jin C, Ahmed R, Ozbakkaloglu T, de Brito J (2021) Strength optimization of cementitious composites reinforced by carbon nanotubes and Titania nanoparticles. Constr Build Mater 303:124510
Natarajan S, Bajaj HC, Tayade RJ (2018) Recent advances based on the synergetic effect of adsorption for removal of dyes from waste water using photocatalytic process. J Environ Sci 65:201–222
Nath RK, Zain MFM, Jamil M (2016) An environment-friendly solution for indoor air purification by using renewable photocatalysts in concrete: a review. Renew Sustain Energy Rev 62:1184–1194
Navidpour AH, Abbasi S, Li D, Mojiri A, Zhou JL (2023) Investigation of advanced oxidation process in the presence of TiO2 semiconductor as photocatalyst: property, principle, kinetic analysis, and photocatalytic activity. Catalysts 13(2):232. https://doi.org/10.3390/catal13020232
Nazar S, Yang J, Thomas BS, Azim I, Rehman SKU (2020) Rheological properties of cementitious composites with and without nano-materials: a comprehensive review. J Clean Prod 272:122701
Nazari A, Riahi S (2010) The effect of TiO2 nanoparticles on water permeability and thermal and mechanical properties of high strength self-compacting concrete. Mater Sci Eng, A 528(2):756–763
Nazari A, Riahi S, Riahi S, Shamekhi SF, Khademno A (2010) Assessment of the effects of the cement paste composite in presence TiO2 nanoparticles. J Am Sci 6(4):43–46
Obuchi E, Sakamoto T, Nakano K, Shiraishi F (1999) Photocatalytic decomposition of acetaldehyde over TiO2/SiO2 catalyst. Chem Eng Sci 54(10):1525–1530
Özen S, Altun MG, Mardani-Aghabaglou A, Ramyar K (2021) Effect of main and side chain length change of polycarboxylate-ether-based water-reducing admixtures on the fresh state and mechanical properties of cementitious systems. Struct Concr 22:E607–E618
Özer ET, Osman B, Kara A, Demirbel E, Beşirli N, Güçer Ş (2015) Diethyl phthalate removal from aqueous phase using poly(EGDMA-MATrp) beads: kinetic, isothermal and thermodynamic studies. Environ Technol 36(13):1698–1706. https://doi.org/10.1080/09593330.2015.1006687
Pacheco-Torgal F, Jalali S (2011) Nanotechnology: advantages and drawbacks in the field of construction and building materials. Constr Build Mater 25(2):582–590
Pimenta Teixeira K, Perdigão Rocha I, De Sá Carneiro L, Flores J, Dauer EA, Ghahremaninezhad A (2016) The effect of curing temperature on the properties of cement pastes modified with TiO2 nanoparticles. Materials 9(11):952
Przystas W, Zablocka-Godlewska E, Grabinska-Sota E (2012) Biological removal of azo and triphenylmethane dyes and toxicity of process by-products. Water Air Soil Pollut 223(4):1581–1592. https://doi.org/10.1007/S11270-011-0966-7/FIGURES/7
Ram C, Kant Pareek R, Singh V, Nayak J, Devi C (2012) Photocatalytic degradation of textile dye by using titanium dioxide nanocatalyst. Int J Theor Appl Sci 4(2):82–88
Riekstins A, Haritonovs V, Straupe V (2020) Life cycle cost analysis and life cycle assessment for road pavement materials and reconstruction technologies. Baltic J Road Bridge Eng 15(5):118–135
Ruot B, Plassais A, Olive F, Guillot L, Bonafous L (2009) TiO2-containing cement pastes and mortars: measurements of the photocatalytic efficiency using a rhodamine B-based colourimetric test. Sol Energy 83(10):1794–1801
Şahin H, Mardani A (2022a) Effect of cement C3A content on some fresh state properties and compressive strength of 3D printing concrete mixtures. J Uludag Univ Fac Eng 27:831–846
Sahin HG, Mardani A (2022b) Sustainable 3D printing concrete mixtures. J Modern Technol Eng 7(1):20–29
Şahin HG, Mardani A (2023a) How does rheological behaviour affect the interlayer-bonding strength of 3DPC mixtures? J Adhes Sci Technol 38(9):1353–1377
Şahin HG, Mardani A (2023b) Mechanical properties, durability performance and interlayer adhesion of 3DPC mixtures: a state-of-the-art review. Struct Concr 24(4):5481–5505
Şahin HG, Biricik Ö, Mardani-Aghabaglou A (2022) Polycarboxylate-based water reducing admixture–clay compatibility; literature review. J Polym Res 29(1):33
Şahin HG, Mardani A, Beytekin HE (2024a) Effect of silica fume utilization on structural build-up, mechanical and dimensional stability performance of fiber-reinforced 3D printable concrete. Polymers 16(4):556
Şahin HG, Altun ÖB, Mardani A (2024b) Multi-effect of fineness and replacement ratio of binders on thixotropic and some fresh state properties of cementitious systems, a comparative study. Adv Powder Technol 35(2):104324
Şahin H, Biricik ÖZNUR, Mardanı Aghabaglou ALİ (2020) The enhancement methods of polycarboxylate-based water reducing admixture performance in systems containing high amount of clay literature review, 14
Salman MM, Eweed KM, Hameed AM (2016) Influence of partial replacement TiO2 nanoparticles on the compressive and flexural strength of ordinary cement mortar. Al-Nahrain J Eng Sci 19(2):265–270
Sanchez F, Sobolev K (2010) Nanotechnology in concrete–a review. Constr Build Mater 24(11):2060–2071
Selvasofia SA, Sarojini E, Moulica G, Thomas S, Tharani M, Saravanakumar PT, Kumar PM (2022) Study on the mechanical properties of the nanoconcrete using nano-TiO2 and nanoclay. Mater Today: Proc 50:1319–1325
Senff L, Hotza D, Lucas S, Ferreira VM, Labrincha JA (2012) Effect of nano-SiO2 and nano-TiO2 addition on the rheological behavior and the hardened properties of cement mortars. Mater Sci Eng, A 532:354–361
Sezer A, Mardani-Aghabaglou A, Boz A, Tanrinian N (2016) An investigation into strength and permittivity of compacted sand-clay mixtures by partial replacement of water with lignosulfonate. Acta Physica Polonica 130:23–27
Shanehsaz M, Seidi S, Ghorbani Y, Shoja SMR, Rouhani S (2015) Polypyrrole-coated magnetic nanoparticles as an efficient adsorbent for RB19 synthetic textile dye: removal and kinetic study. Spectrochim Acta Part A Mol Biomol Spectrosc 149:481–486. https://doi.org/10.1016/j.saa.2015.04.114
Sharma S, Kaur I, Gupta S (2019) Effect of fly ash and nano titanium dioxide on compressive strength of concrete. Int Res J Eng Technol 6(07):2262–2265
Shen W, Zhang C, Li Q, Zhang W, Cao L, Ye J (2015) Preparation of titanium dioxide nano particle modified photocatalytic self-cleaning concrete. J Clean Prod 87:762–765
Singh LP, Bhattacharyya SK, Shah SP, Mishra G, Ahalawat S, Sharma U (2015) Studies on early stage hydration of tricalcium silicate incorporating silica nanoparticles: Part I. Constr Build Mater 74:278–286
Slama HB, Bouket AC, Pourhassan Z, Alenezi FN, Silini A, Cherif-Silini H, Oszako T, Luptakova T, Goli ´nska, P., Belbahri, L. (2021) Diversity of synthetic dyes from textile ındustries, discharge ımpacts and treatment methods. Appl Sci 11(14):6255. https://doi.org/10.3390/app11146255
Snider EH, Porter JJ (1974) Ozone treatment of dye waste. J (Water Pollut Control Federation) 46(5):886–894. http://www.jstor.org/stable/25038731
Sorathiya J, Shah S, Kacha S (2017) Effect on addition of nano “titanium dioxide”(TiO2) on compressive strength of cementitious concrete. Kalpa Publ Civ Eng 1:219–225
Sudha M, Saranya A, Selvakumar G, Sivakumar N (2014) Microbial degradation of azo dyes: a review. Int J Curr Microbiol App Sci 3(2):670–690
Tang C, Chen V (2004) The photocatalytic degradation of reactive black 5 using TiO2/UV in an annular photoreactor. Water Res 38(11):2775–2781
Tsang CHA, Li K, Zeng Y, Zhao W, Zhang T, Zhan Y, Xie R, Leung DYC, Huang H (2019) Titanium oxide based photocatalytic materials development and their role of in the air pollutants degradation: overview and forecast. Environ Int 125:200–228. https://doi.org/10.1016/j.envint.2019.01.015
Wang L, Zhang H, Gao Y (2018) Effect of TiO2 nanoparticles on physical and mechanical properties of cement at low temperatures. Adv Mater Sci Eng 2018(12)
Wiesner MR, Bottero JY (2017) Environmental nanotechnology: applications and impacts of nanomaterials, 2nd edn. McGraw-Hill Education
Yang J, Li D, Zhang Z, Li Q, Wang H (2000) A study of the photocatalytic oxidation of formaldehyde on Pt/Fe2O3/TiO2. J Photochem Photobiol, A 137(2–3):197–202
Yasmina M, Mourad K, Mohammed SH, Khaoula C (2014) Treatment heterogeneous photocatalysis; factors influencing the photocatalytic degradation by TiO2. Energy Procedia 50:559–566
Yiğit B, Salihoğlu G, Mardani-Aghabaglou A, Salihoğlu NK, Özen S (2020) Recycling of sewage sludge incineration ashes as construction material. J Faculty Eng Archit Gazi Univ 35(3):1647–1664
Yu QL, Brouwers HJH (2009) Indoor air purification using heterogeneous photocatalytic oxidation. Part I: experimental study. Appl Catal B: Environ 92(3–4):454–461
Yüksel C, Mardani-Aghabaglou A, Beglarigale A, Yazıcı H, Ramyar K, Andiç-Çakır Ö (2016) Influence of water/powder ratio and powder type on alkali–silica reactivity and transport properties of self-consolidating concrete. Mater Struct 49:289–299
Yuranova T, Sarria V, Jardim W, Rengifo J, Pulgarin C, Trabesinger G, Kiwi J (2007) Photocatalytic discoloration of organic compounds on outdoor building cement panels modified by photoactive coatings. J Photochem Photobiol A: Chem 188(2–3):334–341
Zailan SN, Mahmed N, Abdullah MMAB, Sandu AV, Shahedan NF (2017) Review on characterization and mechanical performance of self-cleaning concrete. In: MATEC web of conferences, vol 97. EDP Sciences, p 01022
Zhang P, Wang T, Chang X, Gong J (2016) Effective charge carrier utilization in photocatalytic conversions. Acc Chem Res 49(5):911–921. https://doi.org/10.1021/ACS.ACCOUNTS.6B00036/ASSET/IMAGES/MEDIUM/AR-2016-00036N_0013.GIF
Zhou Y, Elchalakani M, Liu H, Briseghella B, Sun C (2022) Photocatalytic concrete for degrading organic dyes in water. Environ Sci Pollut Res 29(26):39027–39040
Zhu SF, Wang GX, Deng J, Liu FC, Xiao M (2022) Effect of nano-TiO2 dispersion on cement hydration and properties. J Constr Mater 25(08):843–852
Acknowledgements
The authors thank Bursa Uludağ University Scientific Research Coordination Center (BUUSRC) for their support to the project numbered FOA-2022-1135. First author thanks the TUBITAK 2211-A program for its support throughout her doctoral education. In addition, second author thanks the scholarship provided by BUUSRC with the project number FAY-2021-579.
Funding
Open access funding provided by the Scientific and Technological Research Council of Türkiye (TÜBİTAK).
Author information
Authors and Affiliations
Contributions
All authors contributed to the study conception and design. Material preparation, data collection, and analysis were performed by Ali Mardani, Hatice Gizem Şahin, Müge Temel, Gözde Koçak, and Ali Kara. The first draft of the manuscript was written by Ali Mardani, Hatice Gizem Şahin, Müge Temel, Gözde Koçak, and Ali Kara and all authors commented on previous versions of the manuscript. All authors read and approved the final manuscript.
Corresponding author
Ethics declarations
Ethical approval
Not applicable.
Consent to participate
All authors have consented to participate.
Consent to publish
All authors have consent for publication.
Conflict of interest
The authors declare no competing interests.
Additional information
Responsible Editor: George Z. Kyzas
Publisher's Note
Springer Nature remains neutral with regard to jurisdictional claims in published maps and institutional affiliations.
Rights and permissions
Open Access This article is licensed under a Creative Commons Attribution 4.0 International License, which permits use, sharing, adaptation, distribution and reproduction in any medium or format, as long as you give appropriate credit to the original author(s) and the source, provide a link to the Creative Commons licence, and indicate if changes were made. The images or other third party material in this article are included in the article's Creative Commons licence, unless indicated otherwise in a credit line to the material. If material is not included in the article's Creative Commons licence and your intended use is not permitted by statutory regulation or exceeds the permitted use, you will need to obtain permission directly from the copyright holder. To view a copy of this licence, visit http://creativecommons.org/licenses/by/4.0/.
About this article

Cite this article
Şahin, H.G., Temel, M., Koçak, G. et al. Effect of nano-TiO2 size and utilization ratio on the performance of photocatalytic concretes; self-cleaning, fresh, and hardened state properties. Environ Sci Pollut Res 31, 37109–37124 (2024). https://doi.org/10.1007/s11356-024-33660-9
Received:
Accepted:
Published:
Issue Date:
DOI: https://doi.org/10.1007/s11356-024-33660-9