
Abstract
Green finance is an essential way to cope with environmental pollution, promote the transformation of industrial structure and upgrade, and finally construct a resource-conserving and environment-friendly society and achieve the goal of sustainable development. This study explores the influence of green finance on industrial reasonability and is based on sample data of 30 provinces in China from 2009 to 2019. Through the application of the spatial panel Durbin model with the weight matrix based on the geographical distance, the influence of green finance on the industrial structure as well as its spatial spillover effects are analyzed. The degree of industrial reasonability and the index of green finance development are also examined by applying the Theil index and the entropy method. The empirical results demonstrate two things. First, there is a strong aggregation of the spatial distribution of industrial reasonability, and the spatial pattern remains relatively constant over the 11 years. The main aggregated types are the H–H and L-L between the regions. Second, green finance can promote the industrial reasonability of this region, while it has a significant negative spatial spillover effect on the process of industrial reasonability in adjacent regions.
Introduction
Since the reform and opening up in China, the economy has experienced a period of rapid development. China’s industrial structure has been gradually optimized and upgraded, evolving from “primary, secondary, tertiary” into “tertiary, secondary, primary.” However, the structure still has several problems, such as a low internal level; the unreasonable structure of primary, secondary, and tertiary industry; and the relatively high proportion of pollution and energy consumption industry and so on (Peng et al. 2020; Zhao et al. 2021; Zheng et al. 2021). The rapid development of the economy has also resulted in serious environmental problems, such as haze and climate warming, which will ultimately have a negative impact on agricultural production (Elahi et al. 2021a). The report of the 18th National Congress of the Communist Party of China emphasizes that ecological civilization should be taken into consideration and should be integrated into various aspects of China’s politics, economy, culture, and social construction. Moreover, the report of the 19th National Congress of the Communist Party of China further suggests accelerating the reform of the ecological civilization system and putting an emphasis on developing green finance to achieve the goal of sustainable development. Under this situation, promoting the transformation of industrial structure and the development of green finance are both significant for China’s economic development.
Green finance plays an important role in transforming the economy and adjusting the industrial structure through taking the environmental effect into account when financing and investing. This is because green finance can guide economic and social resources into environment-friendly industries, which can support their further development, while restricting increases in the scale of the “two high and one surplus” industry by cutting off the source of capital. Therefore, the application of green finance could be used to optimize and upgrade industrial structure and ultimately lead to a resource-conserving and environment-friendly society. Besides, it is necessary to examine the mechanism of the influence of green finance on industrial reasonability.
This study aims to investigate the impact of green finance on industrial reasonability through the spatial econometric model. The contribution of this paper is discussed as follows. First, most exiting studies only conduct the non-spatial analysis while ignoring spatial correlation effects between provinces. This might make the estimated results inaccurate. The development of each province in China is different and unbalanced, whereas they are interrelated and have an influence on surrounding regions. Hence, this paper takes regional characteristics into account to evaluate the spatial spillover effect, which makes sure the accuracy of the estimated results and generates a new perspective of investigation. From the perspective of spatial correlation, this study investigates the spatial spillover effect of green finance by constructing the spatial weight matrix of geographical distance. Second, compared with previous studies which merely implement the traditional mathematical statistics method, this study combined both traditional mathematical statistics and a geographic information system (GIS). By implementing the Theil index, the entropy method, and exploratory spatial data analysis (ESDA), this study provides an up-to-date understanding of the impact of green finance on industrial reasonability. Therefore, it makes the research more scientific and comprehensive, by providing in-depth analysis and enriching the research dimensions. Third, the measurement of the green finance development index varies, and some scholars only take several indicators to represent the development level of green finance, which is not representative. This study selects five aspects of green finance which contain green credit, green security, green investment, green insurance, and carbon finance and nine second-level indicators to calculate the index of green finance development. The data of micro-enterprises in high energy-consuming and environmental protection industries is novel and is collected from the Wind database and CSMAR database. This also makes the measurement of the green finance index more accurate and representative, which leads to a more practical research result. In addition, the selection of research objects in line with China’s conditions and the present development background can provide new empirical evidence for green finance development.
Literature review
Green finance
Green finance originated from the concept of environmental finance. Previous scholar initially investigated green finance from the perspective of the concept and systematic structure. The concept of environmental finance is put forward by Salazar (1998), who stated that compared with traditional finance, environmental finance emphasizes environmental protection and the achievement of sustainable economic development. Cowan (1999) argued that environmental finance is an interdisciplinary area that combines the green economy and finance and proposes a way to obtain financing and investment for the environmental protection industry developing. Labatt (2002) agreed, and they further investigated the relationship between environmental protection and financial innovation. Meanwhile, they pointed out that environmental finance is an efficient combination of financial innovation and environmental protection, which can diversify environmental risk and improve environmental quality. Scholtens and Dam (2007) investigated the mechanism of how finance promotes sustainable development, finding that green finance can solve resource and environment problems through the rational application of financial instruments. Sachs et al. (2019) agreed, and they stated that green finance can achieve sustainable development goals. Through implementing the new financial instruments and new policies, the environmental benefits can be gained. According to Höhne et al. (2012), green finance is an extensive term that can guide financial capital investing in projects that are related to sustainable development and environmental products and finally lead to a more sustainable economy. Furthermore, Salzmann (2013) argued that the advancement of green finance is determined by how financial institutions make contributions to protect environments. Investments in green energy projects play a significant role in achieving sustainable development goals and meeting the Paris Agreements. Focusing on research about green finance in China, Li and Xia (2014) explored the green finance development index from the perspective of five dimensions: green credit, green stock, green investment, green insurance, and carbon finance. They stated that the development of green finance in China is relatively slow. Based on a sample of 13 cities in Heilongjiang Province, Dong and Fu (2018) investigated the determinants of green finance and analyze the current situation of green finance development. Wang et al. (2021a) investigated the influence of green finance instruments on carbon emissions under different intensities of environmental regulations. They pointed out that green finance can cooperate with environmental regulations to promote CO2 emission reduction. Peng et al. (2022) explored the effects of green credit policy, reporting that green credit policies can significantly reduce the scale of debt financing of high pollution enterprises, which also demonstrates that the impact of green credit policies has materialized gradually.
Industrial structure
According to Porter (2011), the process of industrial structure adjusting refers to the more reasonable allocation of the resource, which transfers the production resource from the industry with low productivity to the industry with high productivity. The process of achieving industry optimizing and upgrading is first “primary, secondary, tertiary,” then “secondary, tertiary, primary,” and finally “tertiary, secondary, primary.” Marelli (2004) analyzed the evolution of employment structures and found that employment structures play an important role in optimizing industrial structure. He and Yao (2008) analyzed the determinants of industrial structure and investigated the effect of employment structure transformation, resource allocation, and technical progress from the perspective of transformation of the industrial structure. Song and Liu (2013) examined the industrial development of western China by applying empirical analysis, reporting that the industrial structure of western China has improved since but still needs to be optimized through green development and economic development. Su and Xu (2015) evaluated the industrial structure in terms of labor productivity, and their results show that the industrial structure of western China is continually being optimized. Li et al. (2015) explored the transformation of industrial structure, and they pointed out that the transformation of industrial structure is dynamic and industrial reasonability is the basement of industrial upgrading. Based on the Dagum Gini coefficient and the convergence methods, Yang and Qin (2018) carried out further research to explore the spatial inequality features of the optimization of the industrial structure, and they found that industrial reasonability and optimization in China have significant spatial disparities. Xiao et al. (2018) measured the index of industrial structure upgrading and examined the determinants of industrial structure upgrading based on the angle cosine method, reporting the China’s industrial structure is constantly upgrading and in comparison with the central and western regions, the optimizing level of industrial structure in eastern regions is much higher. Hu et al. (2018) investigated the space pattern and evolution of the transformation of the industrial structure during the period from 1996 to 2015 and analyzed the distribution conditions and development trends of the primary, secondary, and tertiary industry in China.
Green finance and industrial structure
Schumpeter (1982) first argued that financial institutions can reallocate capital and guide capital flow to emerging industries through credit expansion, ultimately leading to the optimization of industrial structure. Salazar (1998) stated that financial institutions are crucial to adjust the industrial structure by investing capital in the environment protection and low-carbon industry. Tadesse (2005) explored the relationship between financial development and industrial structure with cross-country data, reporting that financial development can promote technical innovation, which further optimizes the industrial structure. Acemoglu et al. (2012) agreed with this and stated that the development of finance can lead to innovation progress, which can improve total factor productivity and then further promote industrial optimization. Moreover, financial development can also be devoted to adjusting the economic structure and industrial structure through combating environmental degradation. Su and Xu (2015) demonstrated that financial development is important to the industrial structure upgrading. Furthermore, existing scholars also put concern on the relationship between green credit and industrial structure. Xu et al. (2018) investigated the influence of green credit on the transformation of industrial structure with a sample of 31 provinces in China over the period from 2004 to 2015, and they found that green credit significantly affects the industrial adjustment and the impact varies in western, central, and eastern China. Hu et al. (2020) agreed with this, and they investigated the mechanisms of how green credit impacts the industrial structure based on the sample data from western, central, and eastern China. The results demonstrate that green credit can affect industrial structure through capital and financing channels of enterprises. From the perspective of the financial development quality, Tong et al. (2021) investigated the inner mechanism of financial structure affecting industrial structure. Reporting the quality of financial development could affect the relative cost of production factors, which results in reconsidering the tendency of industrial structure, thereby eventually leading to the adjustment of the industry structure and productivity efficiency. Gu et al. (2021) explored the relationship between industrial transformation and green finance in terms of the policy effect based on the VAR model and DEA model, and they found that green finance has a vital influence on promoting industrial transformation, but the tendency is shown as downward.
Theoretical analysis
Capital formation mechanism
It is necessary for enterprises to have enough capital to ensure daily production and expansion. The process of industrial capital formation consists of two parts: the formation of savings and the conversion of savings into investments. The mechanism of capital formation refers to the financial institutions aggregate the capital from the micro-entities, then forming savings, and finally converting the savings into the production capacity of enterprise in the form of investments. Green finance can improve the process of converting savings into investment through promoting the innovation of the finance institution and financial tools efficiently. Because the research and development (R&D) of green products and environmental protection technology has relatively high risk and uncertainty, it often requires a continuously huge amount of investment. Meanwhile, it is difficult for enterprises to attain innovation only with internal accumulated capital. With the proposing of the green finance policy, financial institutions can provide persistent large amounts of financial support for the environmental protection industry, hence promoting investment in R&D and accelerating the production of green products and green services, which can overcome the problem of enterprises’ capital shortages. Furthermore, it can also improve the efficiency of converting savings into investments, which further expands the scale of industry development and supports the development of green finance. Additionally, capital plays a significant role in adjusting the industrial structure. With the accumulation of financial capital, the capital will be more stable, and the formation of superior industries will be accelerated, which can finally be devoted to the production factor that allocates more rational and the industrial structure more rational.
Fund-oriented mechanism
One effective path to achieve industry reasonability is to allocate the capital rationally. Capital flow refers to the process of making resources rational and optimized, which can guide the capital transfer from the industry with low production efficiency to the industry with high production efficiency. Green finance can help industrial structure become rational by guiding the flow of capital. With the development of green finance, more and more capital will flow into the green industry. Thereby, the financing cost of the green industry will decrease and ensure the sustainable development of the industry. Moreover, financial institutions can also devote to capital allocation by setting different interest rates according to different industries. For example, set a relatively low rate for green industry whereas carrying out a high interest rate for the high pollution and high energy-consuming industries. Under the new development philosophy, the capital will be invested in the low-carbon and energy-saving industry rather than the “two high and one surplus” industry. Due to the implementation of the green finance policy, the development of an industry with high polluting and energy-consuming is restricted. On the contrary, the environment protection and green industry can get government support, which promotes further development. The continuous input of capital can accelerate industrial growth. Meanwhile, the scale effect will lead to the redistribution of social resources hence finally achieve the industrial reasonability. In addition, in the process of granting credit extension loans, commercial banks and financial institutions should not only pay attention to the earnings of the project, but also should consider to whether the pollution of the project conforms to the standard. The government should also take responsibility to achieve the green allocation of capital.
Industrial integration mechanism
Against the background of advocating the development of a low-carbon economy, the development of high pollution industries, such as steel and coal, has been impeded. On the contrary, the development of the green industry has potential prospects, and green finance can provide financial support for the industry adjusting. The integration of green industry can break through the constraint of traditional green industry development, which can achieve the efficient allocation of resources in different regions, industries, or even a much broader range, finally improving market efficiency. A sound market system can also promote the capital flow to the green industry. This can generate a scale effect and lead to the production factors assembling toward the superior industries as well as improving the competitiveness of these industries. Furthermore, intangible assets such as the brand and creativity will be transferred accordingly under the situation that the capital flows to the green industry steadily. Industry integration can lead to a synergy effect among the intangible assets, which jointly improves the adjustment of industrial structure.
Risk allocation mechanism
In general, even though the development of green finance has potential prospects, its risk is also relatively high. Most risk-averse investors still tend to invest in traditional industries with low risk, which will aggravate the environmental capacity. Therefore, risk diversification factors should be taken into account when formulating green finance-related policies to ensure that the green industry has potential prospects but that high risk can get investment support. By doing so, the environmental risk of these enterprises can be dispersed effectively. Moreover, green finance can reduce the risks that might be met by market participants by providing insurance for high-risk and high-yield emerging industries or innovative projects. Therefore, the goal of industrial structure optimization and sustainable economic development can be achieved.
Information transmission mechanism
The information asymmetry between enterprises and financial institutions might lead to adverse selection problems or moral hazard problems, which have a negative influence on rational resource allocation. Information transmission mechanisms can make the information transmission between enterprises and financial institutions more transparent and opener, thereby weakening the degree of information asymmetry. Furthermore, investors and financial institutions have paid more and more attention to enterprises’ environmental information disclosure with the development of green finance. Under this condition, green industries with good environmental information disclosure and high social reasonability can get financial support more easily, while the high polluting and energy-consuming industries are hard to gain support which are forced to transform. In other words, the capital will flow into the green industries rather than the “two high and one surplus” industry. Ultimately, the industrial structure can be rational and optimized due to the effective capital allocation.
Material and methods
Data source
To examine the impact of green finance on the industrial structure and its spatial spillover effects, the data of 30 provinces (excluding Tibet) from 2009 to 2019 are chosen as samples. The original data on industrial reasonability is collected from the Statistical Yearbooks of each province and the China Statistical Yearbook, and the original data of the financial development index is selected from the Wind database, CSMAR database, China Insurance Yearbook, Industry Statistical yearbooks of each province, and China Industry Statistical Yearbook.
Variable description
Industrial reasonability
The adjustment of industrial structure can be measured through two aspects: industrial reasonability and industrial upgrading. Green finance can reallocate the financial resources through leading capital flow to green and environmental protection and energy conservation industries and reducing investments in high pollution and energy-consuming industries, which aims to achieve the sustainable economic development. Thus, it seems clear that the influence of green finance on industrial structure focuses more on the process of the coordination of the input structure and output structure as well as the effective allocation of resources and labor. Under this situation, the industrial structure will become more rational and coordinated. Therefore, industrial reasonability is more suitable for evaluating industrial structure adjustment in this paper.
Industrial reasonability is an indicator that can reflect the degree to which industrial structure and employment structure coordinate. Not only can it reveal the coordination among three industries, but it can also measure the coordination of the input structure and output structure effectively. Some scholars use the deviation of industry structure to determine the index. However, this method ignores the extent of the relative importance between industries. Based on this empirical literature, Gan et al. (2011) redefine the Theil index to estimate the rationalization of industrial structure. Since the Theil index can avoid the defects of previous methods, it is generally approved by later researchers. Therefore, the Theil index is applied in this paper to make the measurement more intuitive, and the inverse of the Theil index is used to evaluate the reasonability of industrial structure.
\(Y\) refers to value of GDP, \({Y}_{i}\) (n = 1, 2, 3) represents the added value of three industries, \(L\) is the total number of the labor force, and \({L}_{i}\) (n = 1, 2, 3) denotes the number of the labor force in each industry. \(\frac{{Y}_{i}}{Y}\) is the output structure, and \(\frac{Y}{L}\) is the production rate. \(TL\) refers to the Theil index, and \(TR\) refers to industrial reasonability. There is an inverse relationship between \(TL\) and \(TR\), which means that the smaller the Theil index, the more rational the industrial structure is. Additionally, a higher \(TR\) indicates a more reasonable industrial structure.
Green finance
According to Zeng et al. (2014), the development of green finance can be measured by several dimensions, including green insurance, carbon finance, green security, green credit, green bonds, and green investment. Since the green bond starts relatively late in China and based on other scholars, this paper finally chooses five first indicators and nine second indicators, which contain green credit, carbon finance, green security, green investment, and green insurance to measure the index of green finance development. Table 1 gives the descriptions of first-level and second-level indicators and the calculating methods in this research. Since the data selected should represent the features of the industry, this paper chooses enterprises in six high energy-consuming industries, which include smelting and pressing of non-ferrous metals, smelting and pressing of ferrous metals industry, processing of petroleum, manufacture of raw chemical materials and chemical products, manufacture of non-metallic mineral products, production and supply of electric power and heat power, and coking and nuclear fuel industry (Hu et al. 2020). Meanwhile, the enterprises of the environmental protection industry are collected from the 21 sectors in the Wind database, which include new energy vehicles, garbage sorting, beautiful China, energy conservation of buildings, fuel cells, sewage treatment, new materials, wind power, and so on.
As green finance starts late in China, there is no unified method for evaluating the index of green finance development. According to scholars, this paper selected the entropy weight methods. This method can calculate the weight of each indicator based on the data from the indicators. The smaller the differentiation between the indicators, the bigger the entropy value is, and vice versa. Through calculating entropy weight and the standardized data, the final results can reflect the evaluation index systems comprehensively (Wang et al. 2021b). Meanwhile, the entropy weight method is more objective without considering the subjective influence that can reveal the mutual effects between indicators. Hence, the entropy weight methods are feasible for measuring each province’s green finance development index. Among nine indicators, the ratio of high energy-consuming industry and proportion of interest expense of high energy-consuming industries are negative indexes, and the others are all positive indexes. The calculating steps of the entropy weight method are shown as follows.
-
(1)
This paper selects data from 30 provinces with nine basic indicators; the matrix below consists of the original data, and \({x}_{ij}\) specifies the j-th indicator of the i-th province.
$$X={({x}_{ij})}_{mn}={\left(\begin{array}{c}\begin{array}{ccc}{x}_{11}& \cdots & {x}_{n1}\end{array}\\ \begin{array}{ccc}\vdots & \ddots & \vdots \end{array}\\ \begin{array}{ccc}{x}_{m1}& \cdots & {x}_{mn}\end{array}\end{array}\right)}_{mn}$$(3) -
(2)
Normalize the original data to remove the dimensional difference of each indicator. Meanwhile, because the normalization step
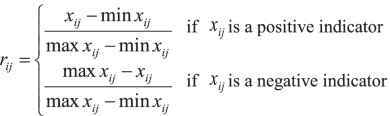
might turn the data into zero, 0.00001 is added to avoid the influence of the logarithmic calculation.
$${b}_{ij}={r}_{ij}+0.0001$$(4) -
(3)
In the next step, the proportion of the j-th indicator of the i-th province is calculated. After obtaining the proportion, the entropy of j-th can be gained.
$${p}_{ij}=\frac{{b}_{ij}}{\sum_{i=1}^{m}{b}_{ij}}$$(5)$${e}_{j}=\frac{1}{\mathrm{ln}n}\sum_{i=1}^{n}{p}_{ij}\mathrm{ln}\left({p}_{ij}\right)0\le {e}_{j}\le 1$$(6)$${g}_{j}=1-{e}_{j}$$(7)$${w}_{j}=\frac{{g}_{j}}{\sum_{j=1}^{m}{g}_{j}} j=\mathrm{1,2},\cdots ,m$$(8) -
(4)
gj refers to the coefficient of difference of the j-th indicator, and the weight of each indicator is determined by \({g}_{j}\).
-
(5)
The score of each province can be gained through the formula below.
$${S}_{i}=\sum_{j=1}^{m}{w}_{j}{\mathrm{}r}_{\mathrm{}ij}$$(9)

Control variables
To examine the other determinants of industrial structure, technical innovation, level of economic development, urbanization level, infrastructure level, human capital, and government scale are chosen as control variables. The definition of control variables is demonstrated in Table 2. Technical innovation (lnsinno) is expressed by the logarithm of the number of invention patents by each province. Economic development (pergdp) can be seen as the foundation of industry development, and policy guidance can optimize the industrial structure. This variable is calculated by the logarithm of the GDP per capita. Human capital level (human) is evaluated by the ratio of the number of enrolled students at colleges and universities to the total number of local people, which represents the impact of education on industrial structure. The government scale (gov) refers to the level of macro-control of local government, and it is calculated by the ratio of government fiscal expenditure to GDP. Because the infrastructure is also a core factor in the industrial structure, it (infra) is evaluated by the ratio of fixed asset investment to the GDP. Additionally, the urbanization level (urban) is measured by the percentage of urban population. It can reflect how material and human capital accumulates in the city, and these two factors are necessary for industrial development. To control the outliers disturbance, we winsorize the data.
The research methods
Spatial autocorrelation test
Before implementing the spatial panel regression, the spatial autocorrelation test should be applied to test whether it is suitable to apply the spatial econometric analysis. If there is an autocorrelation existing, the spatial panel regression should be used or vice versa. Moran’s I test is conducted to calculate the spatial autocorrelation index, and its value range is between [− 1, + 1]. There is a positive autocorrelation when the Moran’s I index is greater than zero, and there is a negative autocorrelation when the Moran’s I index is smaller than zero. Moreover, if the index equals 0, the spatial distribution is random, and there is no spatial correlation. Global Moran’s I Index test statistics and local Moran’s I test statistics demonstrate the aggregation of the spatial distribution of industrial reasonability. Meanwhile, they can investigate whether there is a spatial autocorrelation of industrial reasonability between each province or not. The local Moran’s I test can further explore the type of spatial correlation and divide the regions into four types (Fu and Liu 2013). The four quadrants constitute four clustering types: low-low (L-L), high-high (H–H), low–high (L–H), and high-low (H–L). The calculation formula of Moran’s I index is shown below.
\(I\) refers to the global Moran’s \(I\). \({S}^{2}\) represents the sample variance; the \({w}_{ij}\) denotes the spatial weight matrix. \({x}_{i}\) is the industrial structure of province \(i\), and \({x}_{j}\) is the industrial structure of province \(j\). \(n\) refers to the number of provinces.
Model selection
In terms of the selection of the econometric model, this essay predicts that there is a spatial correlation between green finance and industrial reasonability. The traditional panel data model does not take spatial heterogeneity and relevance into account, which will cause the regression results to be biased. There are three general spatial panel models: the spatial panel lag model (SPLM), the spatial panel error model (SPEM), and the spatial panel Durbin model (SPDM).
SPLM
The SPLM contains the spatial spillover effect of the dependent variables, which can examine the spatial spillover effect between regions. The formula is expressed as follows:
\({indust}_{it}\) represents the degree of industrial reasonability, \(g{f}_{it}\) refers to the green finance index, \(\rho\) denotes the spatial correlation coefficient, and \({w}_{ij}\) is the spatial weight matrix.
SPEM
The SPEM has a spatial error term, and it considers the spillover effect of omitted variables on the local independent variable from the perspective of the error term. The formula is expressed as follows:
\({indust}_{it}\) refers to the degree of industrial reasonability, \(g{f}_{it}\) represents the green finance index, \({\varepsilon }_{it}\) is the random error term and \(\lambda\) is the coefficient of spatial error.
SPDM
The SPDM contains the spatial lagged of dependent variables as well as the spatial lag of independent variables. Compared with the SPLM, it considers the marginal effects of independent variables from the surrounding regions. The formula is expressed as follows:
\({indust}_{it}\) refers to the degree of industrial reasonability. \({gf}_{it}\) represents the green finance index, and the coefficient \(\rho\) represents a parameter of spatial autoregressive that reflects the effect of industrial reasonability of adjacent spatial factors on local industrial reasonability. The error term (\(u\)) is assumed to be normally distributed at a zero mean value and constant variance (Elahi et al. 2020, 2021b).
According to LeSage and Pace (2009), the estimated coefficient of the SPDM model cannot demonstrate the partial regression coefficient efficiently. This is because after green finance has influenced the industrial structure, the industrial structure of adjacent regions will affect each other until reaching a new equilibrium. To solve this problem and further explore the impact of the variables, it should be converted into a vector form. With the consideration of the role of diagonal elements and non-diagonal elements, the model can be derived by converting the spatial weight matrix (Yu et al. 2013). By doing so, the average total effect, the average indirect effect, and the average direct effect of the descriptive variables can be estimated separately. The SPDM can be converted into the equation below:
\({I}_{n}\) represents an identity matrix with n dimensions. \(X\) denotes an \(n\times k\) dimensional matrix. \(\overline{M }\left(r\right)indirect\) represents the average indirect effect, \(\overline{M }\left(r\right)direct\) refers to the average direct effect, and \(\overline{M }\left(r\right)total\) is the average total effect.
A spatial weight matrix represents the features of spatial relationships in a dataset. There are three main spatial weight matrixes: geographical matrix, spatial weight matrix with the consideration of economic distance, and the adjacent matrix. Owing to the fact that the spatial spillover influence of green finance on industrial reasonability reflects more on geographical distance, the geographical matrix is more suitable and practical in terms of the research in this paper. The geographical matrix is calculated on the basis of the spatial geographical distance, and the spatial weight matrix was a 30 × 30 row-standardized with zero diagonal elements in this paper.
Results
Descriptive statistics
Table 3 shows the descriptive statistics of the main variables. The average value of industrial reasonability is 7.9580, but the minimum is 2.0897, and the maximum is 33.5352, demonstrating the large variations in industrial reasonability across China. The average value of green finance is 0.3249, with a minimum of 0.1662 and a maximum of 0.5984, showing that the green finance development of each province is quite different.
Spatial pattern of industrial reasonability
Figures 1 and 2 represent the spatial patterns of industry reasonability in China in 2009 and 2019. The degree of industry reasonability is classified into four categories by the quantile classification method. The figures demonstrate that the degree of industry reasonability keeps relatively constant spatial patterns over the past 11 years. The spatial pattern of industry reasonability in 2019 approximately presents as a diminishing spatial gradient distribution in east-central-west regions. The industry reasonability of Beijing, Shanghai, Zhejiang, and Heilongjiang are high, remaining in the leading position. The second range contains Hainan, Guangdong, Fujian, Jiangsu, and Jiangxi, which also demonstrates that the province with high industry reasonability is located near the east and central regions. Nevertheless, the industry reasonability of western provinces, which include Shanxi, Gansu, and Guizhou, still remains at a low level and still needs some improvements. Moreover, the figures also show that there has been an increasing trend of industry reasonability in most provinces over the past 11 years. In addition, with the implementation of rejuvenation and the support of industry in the northeast, the degree of industrial convergence and industrial coordination increases continuously, which leads to the industrial structure become more and more reasonable.

The spatial patterns of industry reasonability in China in 2009

The spatial patterns of industry reasonability in China in 2019
The results of spatial autocorrelation test
The global Moran’s I index of industrial reasonability is calculated over the period between 2009 and 2019 in this paper, and the results are presented in Table 4. The result demonstrates that the global Moran’s I index of industrial reasonability are all positive and pass the 1% significance level test from 2009 to 2019. This indicates that the industrial reasonability has a positive spatial correlation at the significance level of 1%. It also points out that there is strong aggregation of the spatial distribution of industrial reasonability. In detail, provinces with high industrial reasonability are surrounded by the province with high industrial reasonability (H–H), and the provinces with low industrial reasonability are surrounded by the province with low industrial reasonability (L-L). In terms of the time dimension, the global Moran’s I index of industrial reasonability increases from 0.074 to 0.108 over the period from 2009 to 2019, which implicates a growing tendency in the spatial correlation. To conduct further analysis, the local Moran’s I test is implemented as well, and the Moran scatterplot of the years 2009 and 2019 are shown in Figs. 3 and 4. It seems clear that the main aggregated types are the H–H and L-L between the regions. Both in 2009 and 2019, 20 provinces are located in quadrants I and III. However, the constitution of the province in quadrant I remains constant, while the constitution of the province in quadrant III changes from 2009 to 2019. Guangdong, Heilongjiang, and Hainan enhanced from L-L to H–L during the period. Meanwhile, Henan, Jiangxi, and Hubei dropped from L–H to L-L from 2009 to 2019. Even though the global Moran’s I index of industrial reasonability improved during the 11 years, the development of industrial reasonability in each province is not coincident.

Moran scatterplot of industrial reasonability index in 2009

Moran scatterplot of industrial reasonability index in 2019
The results of model selection
These three spatial panel models have different economic implications. Thus, it is necessary to select a spatial panel model with a higher degree of fit. Firstly, a standard panel model is estimated, and the results are expressed in Table 5. The results indicate that green finance has a significant influence on industrial reasonability. Meanwhile, the results from both the likelihood ratio (LR) test of the time effect and the LR test of the spatial impact pass the 1% significance level test, which implies that the time–space panel data model is more suitable in this study. Before estimating the panel data model, the Hausman test is conducted to make sure whether the fixed effect model or random effect model is more applicable. The value of statistics is 92.16, and it is significant at the 1% level. Hence, the null hypothesis that the model with a random effect is fully efficient can be rejected. Therefore, the fixed effects model is chosen in this paper.
Next, to select the most fitting model from among SPLM, SPEM, and SPDM, the Wald test and LR likelihood test are carried out. The null hypotheses of LR are \({H}_{0}:\theta =0\) and \({H}_{0}:\theta +\delta \beta =0\) (Elhorst 2010). The results demonstrate that Wald spatial lag and LR spatial lag values are significant at the 1% level hence reject the null hypothesis, reflecting that the SPDM cannot be simplified to the SPLM. What is more, both statistical values of Wald spatial error and LR spatial error pass the 1% significance level test, which means that the null hypothesis can be rejected and SPDM is superior to SPEM. Thus, SPDM is more applicable to estimate spillover effects.
To conclude, the tests implemented above indicate that the SPDM with fixed effects is the more adopted in this paper. This indicates that both the spatial impacts of dependent variables and explanatory variables should be taken into account in analyzing the influence of green finance on industrial reasonability. Because the SPDM includes the spatially lagged values of both the dependent and independent variables, it is more suitable for this paper (LeSage and Pace 2009). Elhorst (2010) agrees with this and points out that SPDM can explain the spatial interactions among both explanatory and dependent variables. Additionally, to overcome the endogeneity in this model, the maximum likelihood estimation (MLE) is applied in spatial panel data models.
The results of regression analysis
The SPDM is applied to conduct the regression model, and the results are shown in Table 6. First, the SPDM model is regressed by adding the control variables in turn, and then the SPDM model is regressed with all control variables to test the robustness of estimated results. The results demonstrate that the coefficient of the development of green finance is positive at the 5% level of significance. Meanwhile, the spillover effect of green finance is negative at significance level of 5% that reflects that green finance can promote industrial reasonability in this province, whereas it will restrain the degree of industrial reasonability in surrounding regions. Next, the control variables, which include government scale, infrastructure level, technical innovation, human capital level, economic development, and urbanization level, are added in sequence separately in column (2)–(7). By bringing in the control variables, the results interpret that the spatial spillover coefficient of industrial reasonability is negative and is significant at the level of 5%. This indicates that the spatial spillover effect between the industrial reasonability of provinces in China is obvious, and the correlation is negative in spatial dimensions. Furthermore, the spatial spillover impact coefficient of the core explanatory variable green finance is all negative, which is significant at the 5% level. This also demonstrates that the development of green finance is the main factor in determining the degree of industrial reasonability, and the results of this paper are robust to a certain extent.
Due to the fact that the parameter estimation of the independent variables of the SPDM cannot be interpreted as partial derivatives in regression’s usual sense, the theoretical framework to investigate the indirect and direct effects should be considered to make the result be unbiased (Elhorst 2010). The results of average total effect, direct effect, and indirect effect of the dependent variables are shown in Table 7.
Discussion
The coefficient of the direct effect of the green finance is positive and is statistically significant with industrial reasonability at the 1% level. This point out that green finance development is a key factor to determine the rationality of the industrial structure. Since green finance is essential to financial integration and resource allocation, it can guide the capital flow to the environmental protection industry and energy conservation industry rather than the high energy-consuming industry (Long and Chen 2018). For example, green finance can provide a more convenient and efficient path to get the financial capital for the new energy industry, which devotes to the further development of this kind of industry. Furthermore, the different interest rates set by the green credit also give more support to the development of the environmental protection industry and the high-tech industry through narrowing the range of credit and increasing the standard of gaining credit. Therefore, this kind of industry can achieve enough investment to focus on research and development, hence enhancing competitiveness among industries. This will also encourage the environmental protection industry in gradually becoming the dominant part of the economic structure. With the development of the green industry, upstream- and downstream-related industries in this province can also benefit, which will further promote the industry integration and lead to the industrial structure to be more rational ultimately (Hu et al. 2020). Also, the environmental protection industry predominantly belongs to the secondary industry, and the tertiary industry, which is also devoted to the industrial structure, becomes more rational. Besides, the implementation of green finance policy can better balance the distribution of the local labor force among the three industries, which is further dedicated to the industrial reasonability.
Regarding the indirect effect, the coefficient of the spatial spillover effect of the green finance is negative and statistically significant with industrial reasonability. This point out that green finance has a negative influence on industrial reasonability in neighboring regions. This might be caused by the fact that when the green finance policy carries out, local industry will follow the policy guidance. Once the development of green finance reaches the high level, the process and development of firms and industries with high pollution and high energy consumption will be limited owing to the high cost of sewage and environmental protection equipment. Therefore, it is possible for them to move to surrounding regions, which will generate a bad influence on the neighboring industrial structure. Even though the adjacent regions might have similar industrial structures and the local policies published will be considered a significant factor for decision-making, the negative spillover effects exceed the positive spillover effects of policy guidance and industrial aggregation.
Regarding the control variables, the direct effect of the government scale coefficient is positive, while the indirect effect of government scale coefficient is negative and insignificant, which demonstrates that government support is beneficial to industrial reasonability. However, too much government intervention might lead to the local protectionism which will affect the spatial spillover effects. Regarding the coefficient of infrastructure level, both the direct effect and the indirect effect of infrastructure level on industrial reasonability are positive, which means that infrastructure investment not only promotes the industrial reasonability of local provinces, but also can benefit the industrial structure of neighboring regions. Infrastructure investment can build a good transportation network, which ensures the flow of regional resources is more convenient and the allocation of production resources becomes more reasonable. This will further increase production efficiency and promote industrial reasonability. The direct and indirect effects of the technical innovation are both positive but insignificant.
The direct effect of human capital level on industrial structure is not obvious, while the indirect effect of human capital is positive and significant at the level of 5%. The direct and indirect effect coefficient of human capital is opposite, which points out that there is a competitive relationship between this province and the surrounding provinces. The movement of human capital among provinces is frequent. When the policy and employment opportunities of neighboring regions are more attractive, human capital will outflow. Furthermore, another possible reason for the positive indirect effect is that the matching degree between human capital and the industrial structures of adjacent provinces is higher than that of the local province.
The direct effect of economic development is positive at the 1% significance level. This is because economic development level is the foundation of industrial development. However, its spatial spillover effect is negative and insignificant. Additionally, the indirect effect of urbanization is significantly positive at the level of 1%. Urbanization continuously attracts more and more rural labor force transfers from agriculture to non-agricultural industries and shifts into cities. This is conducive to forming a more rational employment structure, which further promotes industrial reasonability. Besides, adjacent regions might have similar industrial structures and the local policies published, which demonstrates the positive spatial spillover effect.
Conclusions and policy recommendations
Based on the panel data of 30 provinces in China during the period from 2009 to 2019, this paper investigates the influence of green finance on industrial reasonability as well as its spatial spillover effect through the application of SPDM, used with the weight matrix and based on geographical distance. Moreover, this study also explores the level of industrial reasonability and green finance development by applying the Theil index and the entropy method separately. The results are demonstrated as follows. First, there is strong aggregation of the spatial distribution of industrial reasonability, and the spatial pattern remains relatively constant over the 11 years. The main aggregated types are H–H and L-L between the regions. From 2009 to 2019, the constitution of the province with the H–H type stays constant, while the constitution of the province with the L-L type has variations. Meanwhile, there is an increasing tendency in the spatial correlation of industrial reasonability among the provinces.
Furthermore, the development of green finance has a significant positive relationship on the industrial reasonability of local provinces. This is because green finance can guide the capital flow to the environmental protection industry and energy conservation industry rather than the high energy-consuming industry. Meanwhile, the upstream- and downstream-related industries in this province can be benefited gradually, which further leads to the industry integration and industrial structure being more rational ultimately. Nevertheless, the development of green finance has a significant negative spatial spillover effect, which means that green finance will impede the process of industrial reasonability in neighboring regions. The possible reason is that the local industry with high pollution will be restricted because of the high cost of sewage and environmental protection equipment under the situation green finance policy proposing. Therefore, they might decide to move to surrounding regions and generate a negative impact on the neighboring industrial reasonability.
Moreover, policy recommendations are suggested based on the results of the study. First, construct the green finance policy, which is under the adjustment of green finance. Since the development level is varied among the provinces in China, the government should implement differential strategies to promote the coordinated development between green finance and adjustment of industrial structure. Through considering the features and the resource endowment of each province, the corresponding green finance policies should be constructed respectively. What is more, the imbalanced development between industrial reasonability and green finance should also be taken into account. The regional linkage can guide the resource distribution rationally in surrounding areas, which can expand the green finance radiation regions and finally promote the joint achievement of industrial reasonability. Regional governments, financial institutions, and enterprises should cooperate to achieve the industrial transformation.
Second, the improvement of the environmental information disclosure system should be taken into consideration. With the development of green industry, investors focus more on the environmental information disclosure of enterprises. Through supervising the enterprises, the environmental information can be more transparent and opener, which will further improve the awareness of environmental protection of the enterprises as well as avoid the adverse selection problem or moral hazard problem. Furthermore, this can also attract more capital flow into green finance projects. Under this situation, an instant information sharing platform can be built between the government, financial institutions, and the enterprises to make sure all the information is supervised.
Additionally, it is essential to improve the green finance system as well. First, efforts should be made to improve the combination of green financial products and develop the innovation of the green financial products. Even though China has already issued a number of green finance instruments, the development still lacks experience and remains in the initial stage. Therefore, China should take the actual conditions into account and learn from the foreign development experience to formulate a green finance system that is suitable for our own development and improve the laws and regulations system related to green finance. Through establishing laws and regulations to clarify the rights and obligations of government, financial institutions, and enterprises, make sure the social and environmental protection responsibilities of all parties. Under this background, green finance development can better promote the industrial structure being rational, which further achieves the goal of sustainable development.
Limitations and prospects
This paper still has limitations that can be improved upon in future research. First, the measurement of the green finance index has deficiencies; because there is no official index for measuring green finance and data disclosure is neither transparent enough nor complete enough, the green finance index system is hard to construct. However, with the development of green finance, a growing body of relevant statistical data should become available. In future research, more factors might therefore be considered to improve the construction of the green finance index. Second, regional economic development is quite variable in China, which may result in different effects of green finance on industrial reasonability in different regions. This paper does not consider the influence of regional factors on this relationship, and such factors could be considered in future studies in order to conduct a more in-depth analysis.
Availability of data and materials
Data are available from the corresponding author on request.
References
Acemoglu D, Philippe A, Leonardo B, David H (2012) The environment and directed technical change. Am Econ Rev 102:131–166
Cowan E (1999) Topical issues in environmental finance. Research Paper was Commissioned by the Asia Branch of the Canadian International Development Agency (CIDA) 1:1–20
Dong XH, Fu Y (2018) Dynamic evolution and spatial pattern analysis of coupling development of green finance and green economy. J Ind Technol Econ 37:94–101
Elahi E, Khalid Z, Weijun C, Zhang H (2020) The public policy of agricultural land allotment to agrarians and its impact on crop productivity in Punjab province of Pakistan. Land Use Policy 90:104324
Elahi E, Khalid Z, Tauni MZ, Zhang H, Lirong X (2021a) Extreme weather events risk to crop-production and the adaptation of innovative management strategies to mitigate the risk: a retrospective survey of rural Punjab, Pakistan. Technovation 102255
Elahi E, Zhang H, Xing L, Khalid Z, Xu H (2021b) Understanding cognitive and socio-psychological factors determining farmers’ intentions to use improved grassland: implications of land use policy for sustainable pasture production. Land Use Policy 102:105250
Elhorst P (2010) Spatial panel data models. Spatial econometrics. Springer, Berlin
Fu C, Liu YS (2013) Coordinated development between land use change and population change in urbanizing China. Econ Geogr 33(3):47–51
Gan CH, Zheng GR, Yu DF (2011) The influence of industrial structure vicissitude on economic growth and fluctuation in China. Econ Res J 46:4–16
Gu B, Chen F, Zhang K (2021) The policy effect of green finance in promoting industrial transformation and upgrading efficiency in China: analysis from the perspective of government regulation and public environmental demands. Environ Sci Pollut Res 28:47474–47491
He DX, Yao ZQ (2008) Effects of China’s industrial structure adjustment, object of industrial optimization and policy supporting system. China Ind Econ 242:46–56
Höhne N, Khosla S, Fekete H, Gilbert A (2012) Mapping of green finance delivered by IDFC members in 2011. Ecofys, Cologne
Hoffmann WG (1958) Growth of Industrial Economics. Manchester University Press, Manchester
Hu W, Chen XD, Liu Z (2018) Regional characteristics and spatial pattern evolution of industrial structure change in China. Nanjing J Soc Sci 8:35–46
Hu Y, Jiang H, Zhong Z (2020) Impact of green credit on industrial structure in China: theoretical mechanism and empirical analysis. Environ Sci Pollut Res 27:10506–10519
Labatt S (2002) Environmental finance: a guide to environmental risk assessment and financial products. Transplant 66(8):405–409
LeSage JP, Pace RK (2009) Introduction to spatial econometrics. Taylor & Francis
Li XX, Xia G (2014) China green finance report. China Finance Publishing House, Beijing
Li J, Fu MJ, Wei P (2015) Industrial structure change and regional innovation capability: an empirical study based on provincial panel data in China. Hubei Soc Sci 12:72–78
Long YA, Chen GQ (2018) China’s green finance development and industrial structure optimization under the background of ‘beautiful China.’ Enterp Econ 37:11–18
Marelli E (2004) Evolution of employment structures and regional specialization in the EU. Econ Syst 28:35–59
Muhammad J, Fatima SG (2013) Energy consumption, financial development and CO2 emissions in Pakistan, MPRA Paper No. 48287
Peng B, Zheng C, Wei G, Elahi E (2020) The cultivation mechanism of green technology innovation in manufacturing industry: from the perspective of ecological niche. J Clean Prod 252:119711
Peng B, Yan W, Elahi E, Wan A (2022) Does the green credit policy affect the scale of corporate debt financing? Evidence from listed companies in heavy pollution industries in China. Environ Sci Pollut Res 29(1):755–767
Porter ME (2011) The competitive advantage of nations. Free Press, New York
Sachs J, Woo W T, Yoshino N, Taghizadeh-Hesary F (2019) Importance of green finance for achieving sustainable development goals and energy security. Handb Green Finance Energy Secur Sustain Dev
Salazar J (1998) Environmental finance: Linking two world. Financial Innovations for Biodiversity Bratislava
Salzmann AJ (2013) The integration of sustainability into the theory and practice of finance: an overview of the state of the art and outline of future developments. J Bus Econ 83(6):555–576
Scholtens B, Dam L (2007) Banking on the equator: are banks that adopted the equator principles different from non-adopters? World Dev 35(8):1307–1328
Schumpeter JA (1982) The theory of economic development: an inquiry into profits, capital, credit, interest, and the business cycle (1912/1934). Transaction Publishers–1982–January 1:244
Song ZY, Liu WD (2013) A study on industry structure optimization of western China under emission-reduction. China Popul Resour Environ 23:31–37
Su JJ, Xu ZY (2015) Research on industrial structure evolution and transformation development in western China. Soc Sci Ningxia 1:69–78
Tadesse SA (2005) Financial development and technology. Working Paper No. 749
Taghizadeh-Hesary F, Yoshino N (2019) The way to induce private participation in green finance and investment. Financ Res Lett 31:98–103
Tong MH, Li H, Zhang GJ (2021) Inner mechanism of financial structure affecting industrial structure change. Financ Trade Res 32:1–13
Wang F, Cai W, Elahi E (2021a) Do green finance and environmental regulation play a crucial role in the reduction of CO2 emissions? An empirical analysis of 126 Chinese cities. Sustainability 13(23):13014
Wang X, Zhao H, Bi K (2021b) The measurement of green finance index and the development forecast of green finance in China. Environ Ecol Stat 28:263–285
Xiao W, Pan JD, Liu LY (2018) China’s industrial structure upgrade in the ‘New Normal’: empirical test and determinants. Singap Econ Rev 63:1037–1058
Xu S, Zhao XX, Yao S (2018) Analysis on the effect of green credit on the upgrading of industrial structure. J Shanghai Univ Financ Econ 20:59–72
Yang Q, Qin WJ (2018) The spatial inequality and convergence of China’s industrial structure rationalization and optimization. J Quant Tech Econ 35:59–77
Yu N, De Jong M, Storm S, Mi J (2013) Spatial spillover effects of transport infrastructure: evidence from Chinese regions. J Transp Geogr 28:56–66
Zeng XW, Liu YQ, Man MJ, Shen QL (2014) Measurement analysis of China’s green finance development. China Yanan Cadre Coll 6:112–121
Zhao Y, Peng B, Elahi E, Wan A (2021) Does the extended producer responsibility system promote the green technological innovation of enterprises? An empirical study based on the difference-in-differences model. J Clean Prod 319:128631
Zheng J, Shao X, Liu W, Kong J, Zuo G (2021) The impact of the pilot program on industrial structure upgrading in low-carbon cities. J Clean Prod 290:125868
Acknowledgements
The authors acknowledge the support from the Major Program of the National Natural Science Foundation of China (No. 18ZDA004) and the National Natural Science Foundation of China (No. 15BKS079).
Author information
Authors and Affiliations
Contributions
Lintong Gao: conceptualization, data curation, formal analysis, methodology, validation, writing—original draft, and writing—review and editing. Qibo Tian: conceptualization, funding acquisition, and writing—review and editing. Fei Meng: conceptualization, data curation, formal analysis, and methodology.
Corresponding author
Ethics declarations
Ethics approval
Ethical approval is not required for this article because it does not address ethical issues.
Consent to participate
Not applicable.
Consent for publication
Not applicable.
Competing interests
The authors declare no competing interests.
Additional information
Responsible Editor: Nicholas Apergis
Publisher's Note
Springer Nature remains neutral with regard to jurisdictional claims in published maps and institutional affiliations.
Rights and permissions
About this article

Cite this article
Gao, L., Tian, Q. & Meng, F. The impact of green finance on industrial reasonability in China: empirical research based on the spatial panel Durbin model. Environ Sci Pollut Res 30, 61394–61410 (2023). https://doi.org/10.1007/s11356-022-18732-y
Received:
Accepted:
Published:
Issue Date:
DOI: https://doi.org/10.1007/s11356-022-18732-y