
Abstract
Recent years have witnessed the emergence of measurement models for analyzing action sequences in computer-based problem-solving interactive tasks. The cutting-edge psychometrics process models require pre-specification of the effectiveness of state transitions often simplifying them into dichotomous indicators. However, the dichotomous effectiveness becomes impractical when dealing with complex tasks that involve multiple optimal paths and numerous state transitions. Building on the concept of problem-solving, we introduce polytomous indicators to assess the effectiveness of problem states \(d_{s}\) and state-to-state transitions \({\mathrm {\Delta }d}_{\mathrm {s\rightarrow s'}}\). The three-step evaluation method for these two types of indicators is proposed and illustrated across two real problem-solving tasks. We further present a novel psychometrics process model, the sequential response model with polytomous effectiveness indicators (SRM-PEI), which is tailored to encompass a broader range of problem-solving tasks. Monte Carlo simulations indicated that SRM-PEI performed well in the estimation of latent ability and transition tendency parameters across different conditions. Empirical studies conducted on two real tasks supported the better fit of SRM-PEI over previous models such as SRM and SRMM, providing rational and interpretable estimates of latent abilities and transition tendencies through effectiveness indicators. The paper concludes by outlining potential avenues for the further application and enhancement of polytomous effectiveness indicators and SRM-PEI.


Data Availability
The data analyzed in the empirical example of this study are available on this project’s Open Science Framework (OSF) page: https://osf.io/fw82q/.
References
Anderson, J. R., Funke, J., & Plata, G. (Eds.). (2007). Cognitive psychologic (6 Aufl.). Spektrum Akademischer Verlag http://www.gbv.de/dms/bs/toc/529836963.pdf
Arieli-Attali, M., Ou, L., & Simmering, V. R. (2019). Understanding test takers’ choices in a self-adapted test: A hidden Markov modeling of process data. Frontiers in Psychology, 10, 83. https://doi.org/10.3389/fpsyg.2019.00083
Bergner, Y., & von Davier, A. A. (2019). Process data in NAEP: Past, present, and future. Journal of Educational and Behavioral Statistics, 44(6), 706–732.
Bock, R. D. (1972). Estimating item parameters and latent ability when responses are scored in two or more nominal categories. Psychometrika, 37(1), 29–51. https://doi.org/10.1007/BF02291411
Brooks, S. P., & Gelman, A. (1998). General methods for monitoring convergence of iterative simulations. Journal of Computational and Graphical Statistics, 7, 434–455.
Buchner, A., & Funke, J. (1993). Finite-state automata: Dynamic task environments in problem-solving research. The Quarterly Journal of Experimental Psychology, 46(1), 83–118.
Chen, Y. (2020). A continuous-time dynamic choice measurement model for problem-solving process data. Psychometrika, 85(4), 1052–1075. https://doi.org/10.1007/s11336-020-09734-1
Cormen, T. H., Leiserson, C. E., Rivest, R. L., & Stein, C. (2022). Introduction to algorithms (4th ed., pp. 563–572). Cambridge: MIT Press.
Fu, Y., Zhan, P., Chen, Q., & Jiao, H. (2023). Joint modeling of action sequences and action time in computer-based interactive tasks. Behav Res Methods. https://doi.org/10.3758/s13428-023-02178-2
Funke, J. (2001). Dynamic systems as tools for analysing human judgement. Think Reason, 7, 69–89.
Geisser, S., & Eddy, W. F. (1979). A predictive approach to model selection. J Am Stat Assoc, 74, 153–160.
Gelfand, A. E., & Dey, D. K. (1994). Bayesian model choice: Asymptotics and exact calculations. Journal of the Royal Statistical Society Series B, 56, 501–514.
Gelman, A., Carlin, J. B., Stern, H. S., Dunson, D. B., Vehtari, A., & Rubin, D. B. (2014). Bayesian data analysis (3rd ed.). Boca Raton: Chapman & Hall/CRC Press.
Gelman, A., Meng, X.-L., & Stern, H. (1996). Posterior predictive assessment of model fitness via realized discrepancies. Statistica Sinica, 6, 733–760.
Gelman, A., & Rubin, D. B. (1992). Inference from iterative simulation using multiple sequences. Statistical Science, 7(4), 457–472. https://doi.org/10.1214/ss/1177011136
Griffin, P., & Care, E. (2014). Assessment and teaching of 21st century skills: Methods and approach. New York, NY: Springer.
Guttman, I. (1967). The use of the concept of a future observation in goodness-of-fit problems. Journal of the Royal Statistical Society: Series B (Methodological), 29(1), 83–100. https://doi.org/10.1111/j.2517-6161.1967.tb00676.x
Han, Y., Liu, H., & Ji, F. (2022). A sequential response model for analyzing process data on technology-based problem-solving tasks. Multivariate Behavioral Research, 57(6), 960–977. https://doi.org/10.1080/00273171.2021.1932403
Han, Y., & Wilson, M. (2022). Analyzing student response processes to evaluate success on a technology-based problem-solving task. Applied Measurement in Education, 35(1), 33–45.
He, Q., & von Davier, M. (2015). Identifying feature sequences from process data in problem-solving items with n-grams. In L. A. van der Ark, D. M. Bolt, W.-C. Wang, J. A. Douglas, & S.-M. Chow (Eds.), Quantitative psychology research (pp. 173–190). Berlin: Springer. https://doi.org/10.1007/978-3-319-19977-1_13
He, Q., & von Davier, M. (2016). Analyzing process data from problem-solving items with N-Grams: Insights from a computer-based large-scale assessment. In Y. Rosen, S. Ferrara, & M. Mosharraf (Eds.), Handbook of research on technology tools for real-world skill development (pp. 750–777). Pennsylvania: IGI Global.
Koehler, E., Brown, E., & Haneuse, J. P. A. (2009). On the assessment of monte carlo error in simulation-based statistical analyses. The American Statistician, 63(2), 155–162. https://doi.org/10.1198/tast.2009.0030
LaMar, M. M. (2018). Markov decision process measurement model. Psychometrika, 83(1), 67–88. https://doi.org/10.1007/s11336-017-9570-0
Levy, R., & Mislevy, R. J. (2016). Bayesian psychometric modeling. Cambridge: CRC Press.
Li, M., Liu, H., Cai, M., & Yuan, J. (2023). Estimation of individuals’ collaborative problem solving ability in computer-based assessment. Education and Information Technologies. https://doi.org/10.1007/s10639-023-12271-w
Liu, H., Liu, Y., & Li, M. (2018). Analysis of process data of PISA 2012 computer-based problem solving: Application of the modified multilevel mixture IRT model. Frontiers in Psychology, 9, 1372.
Mayer, R. E., & Wittrock, M. C. (2006). Problem solving. In P. A. Alexander & P. H. Winne (Eds.), Handbook of educational psychology (2nd ed., pp. 287–304). Mahwah: Erlbaum.
Newell, A., & Simon, H. A. (1972). Human problem solving (Vol. 104). Englewood Cliffs: Prentice-Hall.
OECD (2014). PISA 2012 results: Creative problem solving: Students’ skills in tackling real-life problems (Vol. V). OECD.
OECD. (2016). PISA 2015 Assessment and analytical framework: Science. Reading, mathematic and financial literacy: PISA. OECD Publishing. https://doi.org/10.1787/9789264255425-en
OECD. (2018). The future of education and skills: Education 2030. Paris: OECD Publishing.
Patz, R. J., & Junker, B. W. (1999). Applications and extensions of MCMC in IRT: Multiple item types, missing data, and rated responses. Journal of Educational and Behavioral Statistics, 24(4), 342–366. https://doi.org/10.3102/10769986024004342
Patz, R. J., & Junker, B. W. (1999). A straightforward approach to Markov chain Monte Carlo methods for item response models. Journal of Educational and Behavioral Statistics, 24(2), 146–178. https://doi.org/10.3102/10769986024002146
Rubin, D. B. (1984). Bayesianly justifiable and relevant frequency calculations for the applies statistician. The Annals of Statistics, 12, 1151–1172. https://doi.org/10.2307/2240995
Shu, Z., Bergner, Y., Zhu, M., Hao, J., & von Davier, A. A. (2017). An item response theory analysis of problem-solving processes in scenario-based tasks. Psychological Test and Assessment Modeling, 59(1), 109–131.
Spiegelhalter, D. J., Best, N. G., Carlin, B. P., & Van der Linde, A. (1998). Bayesian deviance, the effective number of parameters, and the comparison of arbitrarily complex models. MRC Biostatistics Unit: Technical report.
Tang, X. (2023). A latent hidden Markov model for process data. Psychometrika. https://doi.org/10.1007/s11336-023-09938-1
Tang, X., Wang, Z., He, Q., Liu, J., & Ying, Z. (2020). Latent feature extraction for process data via multidimensional scaling. Psychometrika, 85(2), 378–397.
von Davier, A. A. (2017). Computational psychometrics in support of collaborative educational assessments. Journal of Educational Measurement, 54(1), 3–11.
Xiao, Y., He, Q., Veldkamp, B., & Liu, H. (2021). Exploring latent states of problem-solving competence using hidden Markov model on process data. Journal of Computer Assisted Learning, 37(5), 1232–1247.
Xiao, Y., & Liu, H. (2023). A state response measurement model for problem-solving process data. Behavior Research Methods, 1–20. https://doi.org/10.3758/s13428-022-02042-9
Yuan, J., Xiao, Y., & Liu, H. (2019). Assessment of collaborative problem solving based on process stream data: A new paradigm for extracting indicators and modeling dyad data. Frontiers in Psychology, 10, 369. https://doi.org/10.3389/fpsyg.2019.0036
Funding
No funding was received to assist with the preparation of this manuscript. The authors have no competing interests to declare that are relevant to the content of this article.
Author information
Authors and Affiliations
Corresponding author
Ethics declarations
Code Availability
The codes are available on this project’s Open Science Framework (OSF) page: https://osf.io/fw82q/.
Additional information
Publisher's Note
Springer Nature remains neutral with regard to jurisdictional claims in published maps and institutional affiliations.
Supplementary Information
Below is the link to the electronic supplementary material.
Appendix A. Algorithm for Automatically Calculating State Effectiveness in the Balance Beam Task
Appendix A. Algorithm for Automatically Calculating State Effectiveness in the Balance Beam Task

The interface of the initial state in the Chinese version of the Balance Beam task.
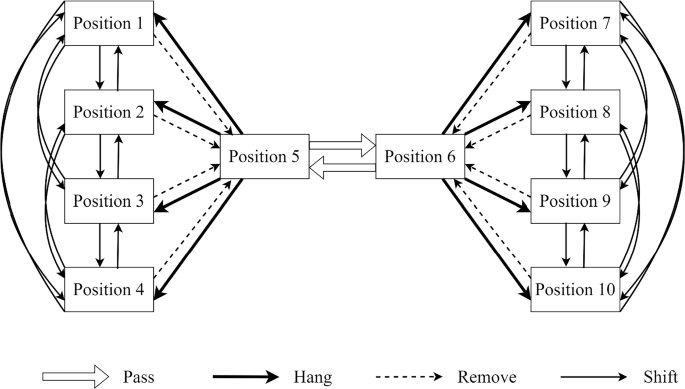
The diagram for the four types of transitions that can occur when a weight moves among ten possible positions in the Balance Beam task.
In the Balance Beam task, the ten potential positions for each weight are categorized into four groups: (1) Positions 1–4: Positioned on side A of the beam; (2) Position 5: Not suspended on side A; (3) Position 6: Not suspended on side B; (4) Positions 7–10: Positioned on side B of the beam. Figure 5 illustrates the transition of each weight among ten positions through four types of operations: (1) removing a weight from the beam; (2) hanging an unhung weight; (3) passing a weight to the other student; and (4) shifting the position of a weight on the same side. Each arrow represents an operation that can lead to a transition. Through this figure, we can easily find the minimum number of transitions between any two positions for one weight. Since an operation can only alter the position of one weight once, the shortest distance between states s and \(s'\) equals the sum of the minimum number of operations required for each of the four weights to change its position from state s to \(s'\). Then, we can quickly and accurately calculate the shortest distance \(d_{s}^{(k)}\) between a state s and the target state \(s_{target}^{(k)}\) using the state code and rules to change the position according to Fig. 6. Finally, we select the minimum distance \(d_{s}=\min \left( d_{s}^{(1)}, d_{s}^{(2)}, \ldots , d_{s}^{(k)}\right) \) as the effectiveness indicator \(d_{s}\) of the state s
During the process of programming the calculations mentioned above, the position of each weight can be assigned a unique number from one to ten. Therefore, any given state in the Balance Beam task can be encoded by a sequence of four numbers, a representation we refer to as the state code. For one weight, calculating the shortest distance between any two positions can be simplified by several rules. The R code for evaluating the effectiveness of states for the Balance Beam task that requires the use of two weights to achieve balance is available at https://osf.io/fw82q/.
In the example of the code, the four positions for hanging weights on the balance beam on student A’s side are coded as 1 to 4, and the four positions on student B’s side are coded as \(-1\) to \(-4\). The unhung weights are coded as 0.5 when in student A’s hand and \(-\)0.5 when in student B’s hand. In the initial state, all four weights are in the hand of A, and the state code is (0.5, 0.5, 0.5, 0.5). The effectiveness of the initial state is equal to 3, which means that the balance state using two weights can be achieved after a minimum of three transitions. Another example is that Student B holds the 50 g and 100 g weights and Student A has hung the 300 g weight at position 1 and the 500 g weight at position 2. This state is at a minimum distance of 2 from the balance state.
Rights and permissions
Springer Nature or its licensor (e.g. a society or other partner) holds exclusive rights to this article under a publishing agreement with the author(s) or other rightsholder(s); author self-archiving of the accepted manuscript version of this article is solely governed by the terms of such publishing agreement and applicable law.
About this article

Cite this article
Wang, P., Liu, H. Polytomous Effectiveness Indicators in Complex Problem-Solving Tasks and Their Applications in Developing Measurement Model. Psychometrika (2024). https://doi.org/10.1007/s11336-024-09963-8
Received:
Published:
DOI: https://doi.org/10.1007/s11336-024-09963-8