
Abstract
Lumpy skin disease virus (LSDV) causes an infectious disease in cattle. Due to its direct relationship with the survival of arthropod vectors, geospatial and climatic features play a vital role in the epidemiology of the disease. The objective of this study was to assess the ability of some machine learning algorithms to forecast the occurrence of LSDV infection based on meteorological and geological attributes. Initially, ExtraTreesClassifier algorithm was used to select the important predictive features in forecasting the disease occurrence in unseen (test) data among meteorological, animal population density, dominant land cover, and elevation attributes. Some machine learning techniques revealed high accuracy in predicting the LSDV occurrence in test data (up to 97%). In terms of area under curve (AUC) and F1 performance metric scores, the artificial neural network (ANN) algorithm outperformed other machine learning methods in predicting the occurrence of LSDV infection in unseen data with the corresponding values of 0.97 and 0.94, respectively. Using this algorithm, the model consisted of all predictive features and the one which only included meteorological attributes as important features showed similar predictive performance. According to the findings of this research, ANN can be used to forecast the occurrence of LSDV infection with high precision using geospatial and meteorological parameters. Applying the forecasting power of these methods could be a great help in conducting screening and awareness programs, as well as taking preventive measures like vaccination in areas where the occurrence of LSDV infection is a high risk.
Introduction
Lumpy skin disease virus (LSDV) infection is a major challenge to cattle production, causing acute or subacute disease in cattle and water buffalo population. Cattle of all breeds can become infected, and cows that are around the peak of milk production and calves are particularly susceptible to LSDV infection (Namazi and Khodakaram Tafti 2021).
The LSDV is a double-stranded DNA virus belonging to the Capripoxvirus genus. Fever, inappetence, a significant drop in milk production, swollen lymph nodes, and the appearance of hard, slightly elevated skin nodules quickly after the onset of fever are the main clinical signs of the infection. Despite the availability of a variety of diagnostic tests, the diagnosis is generally confirmed using a traditional or real-time PCR (polymerase chain reaction) approach (Namazi and Khodakaram Tafti 2021).
In 1929, the first case of LSDV infection was recorded in Zambia (Von Backstrom 1945). LSDV has gradually expanded through Africa, the Middle East, Southeastern Europe, Central Asia, and, most recently, South Asia and China. The disease is now endemic in many African countries, as well as areas of the Middle East (Iraq, Saudi Arabia, and the Syrian Arab Republic) and Turkey (Roche et al. 2020). The disease has resulted in major economic losses in the affected countries. Due to high fever and secondary mastitis, it causes a substantial drop in milk production. Other consequences of the disease include damaged skin, a reduction in the growth rate of beef cattle, transient or lifelong infertility, abortion, treatment and vaccination costs, and the mortality in infected animals (Alemayehu et al. 2013; Namazi and Khodakaram Tafti 2021).
LSDV is transmitted by insects, in particular blood-sucking arthropods, contaminated food and drink, and at the later stages of the disease through saliva, nasal secretions, and semen (Sprygin et al. 2018; Tuppurainen et al. 2017). Due to its direct relationship with the survival of vectors, climatic conditions play an important role in the epidemiology of the disease. A warm and humid climate, environmental conditions that support an influx of vector populations, such as those seen during seasonal rains, and the introduction of new animals to a herd are all risk factors for the spread of LSDV. Furthermore, the wind’s direction and intensity may play a role in the spread of the virus (Chihota et al. 2003).
The association between LSDV infection and meteorological and geospatial factors has been studied in many studies, and they have discovered that factors like temperature, precipitation, land cover, humidity, and wind speed can predict or influence the occurrence of the disease (Alkhamis and VanderWaal 2016; Allepuz et al. 2019; Machado et al. 2019; Molla et al. 2017; Sprygin et al. 2018; Tuppurainen and Oura 2012).
Due to the introduction of new technologies and analytical techniques such as big data, remote sensing, and Earth observation, many digital Earth researches are now employing big spatiotemporal data to track and define the dynamic Earth climate system, (Kovacs-Györi et al. 2020; Yang et al. 2017).
Nowadays, machine learning (ML) offers highly valuable resources for intelligent geospatial and environmental data analysis, synthesis, and visualization. ML methods, particularly deep learning approaches, have become more common as the availability of more and different types of big data has grown (Xu and Jackson 2019). These techniques use general purpose learning algorithms to look for similarities in often complex and unwieldy data (Bzdok et al. 2018). In general, they can be used effectively at all levels of environmental data mining: exploratory spatial data processing, identification and modeling of spatial–temporal patterns, and decision-driven mapping. Traditional geostatistical methods have been replaced greatly by machine learning techniques especially in big data analyses (Kanevski et al. 2008). However, ML techniques should be implemented accurately and effectively from pre-processing data to analysis and justification of the findings (Kanevski et al. 2008).
ML techniques have been evaluated in several studies for predicting the occurrence of infectious diseases in human or animals using various climatic and geospatial features.
Wang et al. (2015) developed a feed-forward back-propagation neural network model to predict the weekly number of human cases of infectious diarrhea in China (Shanghai) using meteorological factors as predictive features. Non-linear models including neural networks, support vector regression, and random forests regression showed better performance than multiple linear regression. Neural networks showed most satisfactory results when all performance evaluation criteria were considered simultaneously.
Malki et al. (2020) explored various regressor machine learning models to predict confirmed and death cases of COVID-19 in various countries. In forecasting the COVID-19 confirmed cases, the highest performance was obtained by the KNN (K-nearest neighbors) regressor. Decision tree algorithm showed best performance in predicting the rate of COVID-19 mortality. Weather variables such as temperature and humidity were more important in predicting the mortality rate when compared to the other census variables such as population, age, and urbanization.
Golden et al. (2019) collected soil and feces samples from 11 pastured poultry farms from 2014 to 2017 in the USA. They generated random forest and gradient boosting machine predictive models to predict Listeria spp. prevalence in samples based on meteorological factors such as temperature, wind speed, gust speed, humidity, and precipitation at the farming location. AUC performance metric for the random forest and gradient boosting machine models of fecal samples was 0.905 and 0.855, respectively. The soil gradient boosting machine model outperformed the random forest model with AUCs of 0.873 and 0.700, respectively.
Liang et al. (2020) used machine learning methods to forecast African swine fever outbreaks around the world using bio-climatic variables. The random forest algorithm outperformed other techniques with 80.4% accuracy in the dataset containing all predictive variables, and the support vector machine algorithm showed the best accuracy in the subset dataset containing only important climatic features (76.02%).
The accuracy score of prediction varied between 47.8 and 99.6% in the study by Niu et al. (2020), which used various machine learning algorithms to forecast Peste des Petits ruminants (PPR) outbreaks based on certain bio-climatic variables and altitude data. The random forest algorithm performed best in a test dataset consisting of data from three countries that were not included in the training process.
To the best of the author’s knowledge, no related research has been undertaken in terms of evaluating ML techniques in building models to forecast the incidence of LSDV infection using meteorological and/or geospatial attributes.
Because of the importance of insects in LSDV transmission and their reliance on climatic and geographical features, the key objective of this research was to develop predictive models using some robust ML algorithms based on meteorological and geospatial features to predict the incidence of LSDV infection in countries with a prior history of disease outbreak reported between 2011 and 2021.
Materials and methods
Figure 1 depicts the summary of steps taken in the materials and methods, and the details of each step are explained in the following sections.
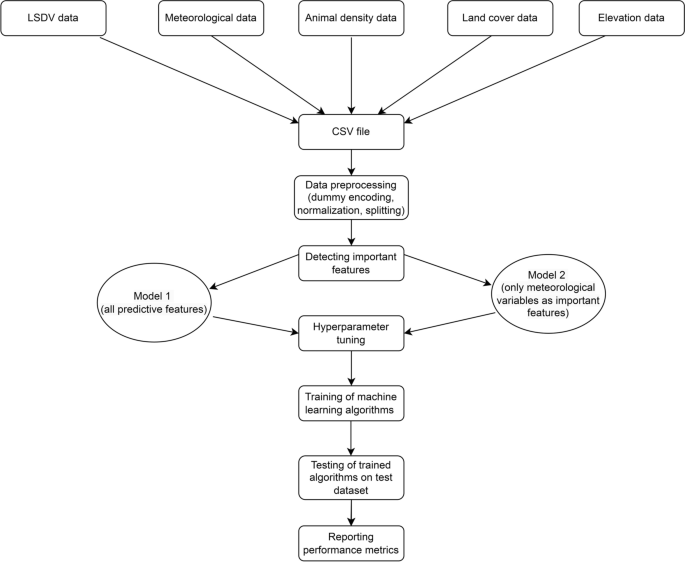
Summary of steps taken in the materials and methods section
Data sources
Lumpy skin disease outbreak data
Geographic coordinates of Lumpy Skin Disease outbreaks were obtained from Global Animal Disease Information System of FAO (Food and Agriculture Organization) (https://empres-i.review.fao.org//). Relevant information between January 2011 and March 2021 including the specific time of the outbreak and the longitude and latitude of the outbreak point were downloaded.
Meteorological data
Monthly cloud cover (percentage), diurnal temperature range (degrees Celsius), frost day frequency (days per month), wet day frequency (days), potential evapotranspiration (millimeters per day), precipitation (millimeters per months), daily mean temperature (degrees Celsius), monthly average maximum and minimum temperature (degrees Celsius), and vapor pressure (hectopascal) data for the period January 2011–December 2019 were obtained from the University of East Anglia’s Climatic Research Unit (CRU TS4.04) (Harris et al. 2020).
Animal density data
Cattle and buffalo population density data were obtained from Gridded Livestock of the World (GLW 3) database (Gilbert et al. 2018).
Land cover data
GLC-SHARE Beta-Release v1.0 (Latham et al. 2014) was used to extract global land cover data (spatial information on various forms of physical covering of the Earth’s surface) including artificial surfaces, cropland, grassland, tree covered areas, shrubs covered areas, herbaceous vegetation, aquatic or regularly flooded areas, mangroves, sparse vegetation, bare soil, snow and glaciers, and waterbodies coverage.
Elevation data
Global geospatial elevation dataset (GRAY_50M_SR.VERSION 2.1.0) was downloaded from Natural Earth database (free vector and raster map data @ naturalearthdata.com).
Data preprocessing
Only data in countries which reported the LSDV infection during the study time period (2011–2021) were extracted in all downloaded data and map files. In order to prepare data values to be used by ML algorithms, categorical variables were converted to numeric values using one-hot encoding technique. Moreover, the values of different predictive features were normalized using min–max scaling. Finally, the dataset was split into train and test sets using train_test_split class from scikit-learn library (Pedregosa et al. 2011). The training dataset which was used during model development and the test set which was not seen by the model were used for validation. Repeated stratified K-Fold cross-validation using 3 splits and 2 repeats was also used to validate the machine learning models during training step.
Selecting of features based on importance
The Scikit-learn module’s ExtraTreesClassifier and SelectFromModel classes were used to select features that are most useful for prediction. The ExtraTreesClassifier class implements a meta estimator that employs averaging to control over-fitting by fitting a number of randomized decision trees (extra-trees) on different sub-samples of the dataset (Geurts et al. 2006). SelectFromModel class is a meta-transformer for selecting features based on importance weights. SelectFromModel accepts a threshold parameter and will select the features whose importance (defined by the coefficients) are above this threshold. SelectFromModel requires the underlying estimator to expose a coef_ attribute or a feature_importances_ attribute which in this case was provided by ExtraTreesClassifier class. The net results of the cooperation of these two classes are choosing the important predictive features among all predictive variables.
Hyperparameter tuning
To choose a set of optimal parameters for each machine learning techniques, RandomizedSearchCV method from the scikit-learn library was used. This method can test a given number of candidates from a parameter set with a specified distribution.
Machine learning algorithms used in training and testing phases
Logistic regression
Logistic regression is one of the machine learning classification techniques, which is utilized for anticipating the categorical dependent variable employing a given set of dependent variables and gives the probabilistic values which lie between 0 and 1 (Cox 1958).
Support vector machine
Support vector machines (SVMs) are a group of supervised learning techniques which are effective in high dimensional spaces. It creates the best decision boundary to separate multi-dimensional space into subclasses using the extreme cases which are called support vectors (Scholkopf 1998).
Decision tree
A decision tree classifier is a tree-like structure that creates a training model to predict the target class through learning simple decision rules inferred from prior data (training data). Internal nodes represent features (or attributes), the branches represent decision rules, and each leaf node represents the outcome (Safavian and Landgrebe 1991).
Random forest
Random forest is an ensemble decision tree-based classification method that acts through building a number of trees and each tree is dependent on the values of an independently sampled random vector with the same distribution for all trees within the forest (Breiman 2001).
AdaBoost
AdaBoost is an ensemble algorithm in which subsequent weak learners are adjusted adaptively in favor of those instances misclassified by previous classifiers (Freund and Schapire 1997).
Bagging
As another ensemble method, bagging (short for bootstrap aggregating) uses the same training algorithm for every predictor and train them on different random subsets of the training set with replacement (Breiman 1996).
XGBoost
XGBoost is a popular and efficient open-source implementation of the gradient boosted trees algorithm (Chen and Guestrin 2016). XGBoost stands for extreme gradient boosting, which uses decision trees as base learners, merging several weak learners to create a more powerful learner. Therefore, it is referred to as an ensemble learning algorithm since the final prediction incorporates the output of several models.
Artificial neural network (multilayer perceptron)
A simple form of artificial neural network (ANN) is the multilayer perceptron (MLP). In most cases, it has three layers: input, output, and a hidden layer. The input layer is where the data to be processed is received. The output layer is in charge of classification. The true computational engine of the MLP is an arbitrary number of hidden layers located between the input and output layers (Chollet 2018).
Evaluating the performance of predictive models
Accuracy score, precision, recall, F1 score, and area under curve (AUC) were used as performance metrics to measure the power of different classifiers in predicting unseen data (test set) (Géron 2019).
Accuracy score is one of the common performance metrics which is calculated by dividing the number of correct predictions by total number of predictions.
Another useful metric is precision, or the accuracy of the positive predictions:
Recall is the ratio of positive instances that are correctly detected by the classifier:
F1 score is the harmonic mean of precision and recall which gives much more weight to low values:
Receiver operating characteristic (ROC) curve plots the true positive rate (recall) against the false positive rate. The area under curve (AUC) of ROC curves used as its summary and assesses a classifier’s ability to discriminate between classes.
Analysis tools
QGIS software (version 3.16 – Hannover) was applied to analyze and edit spatial data files. Machine learning techniques were implemented using the Python programming language (version 3.8) and the Anaconda navigator platform (as a package manager; version 1.10.0). Scikit-learn 0.24.1 (Pedregosa et al. 2011) was used to implement logistic regression, SVM, decision tree, random forest, AdaBoost, and bagging algorithms. The XGBoost library was utilized to run the XGBoost technique (Chen and Guestrin 2016). Keras API (Chollet 2018) running as an abstraction layer on top of TensorFlow 2 framework (Abadi et al. 2016) was used for building multilayer perceptron (ANN).
Results
Distribution of outbreaks points
Between January 2011 and March 2021, 3039 LSDV infection outbreaks were recorded across Africa, Asia, and Europe. Figure 2 indicates the distribution of outbreaks points along with 21,757 free points.

The distribution of reported LSDV infection points during 2011–2021
The highest incidence of the disease during the study period was reported in Europe (2172 outbreaks), Asia (777 outbreaks), and Africa (90 outbreaks), respectively.
The highest incidence of the disease was recorded in 2016 (Fig. 3).

Reported LSDV infection outbreaks in each year during 2011–2021
Important features
Based on the results of applying ExtraTreesClassifier and SelectFromModel algorithms on the dataset, only meteorological variables were considered as important features. Therefore, two independent analyses were carried out: one involving all predictive variables including all meteorological, elevation, animal population density, and land cover features (model 1) and the other consisting of only meteorological features (model 2).
Tuned parameters of algorithms
In Tables 1 and 2, some of the most important tuned parameters in each algorithms in model 1 and 2 are shown, respectively.
The predictive ability of various machine learning algorithms
Depending on the type of ML algorithm and performance metric used, the predictive ability of techniques using two subsets of features was different (Table 3).
AUC metric ranged between 0.53% to 0.97% and 0.63% to 0.97% in model 1 and model 2, respectively. In both models, ANN algorithm outperformed other algorithms in terms of AUC and F1 score. ROC curves of different ML algorithms for model 1 and model 2 are shown in Figs. 4 and 5, respectively.

Receiver operating characteristic (ROC) curves of various machine learning algorithms for model 1 (including all predictors)

Receiver operating characteristic (ROC) curves of various machine learning algorithms for model 2 (including only predictive meteorological variables)
Discussion
The findings of current study demonstrated that by applying machine learning methods and using climatic and geospatial features as predictive variables, the occurrence of LSDV infection could be predicted in test set (unseen data) with high accuracy. For instance, ANN algorithm indicated 97% accuracy score. However, the accuracy score is not the preferred performance measure for classifiers, particularly where certain classes are more frequent than others (Géron 2019). As a result, when assessing the predictive power of algorithms, it makes more sense to consider performance metrics such as precision, recall, F1 score, and AUC. Regarding AUC metric and by incorporating all predictive variables in the model or using only meteorological variables as predictors, the highest performance was associated with ANN algorithm (97% in both models) (Table 3).
Artificial neural networks have been widely used in different fields including medical and health field, such as medical diagnosis and disease prediction and obtained the very good prediction results (Abbass 2002; Al-Shayea 2011; Baxt 1995; Fang et al. 2014; Flores-Fernández et al. 2012; Kara and Dirgenali 2007; Kia et al. 2013; Ma and Wang 2010; Wang and Gupta 2013; Wang et al. 2001; Zhu and Wang 2010).
The reason for better performance of ANN could be attributed to the fact that this algorithm is a universal approximator which can approximate a large class of functions with a high degree of accuracy (Y. Wang et al. 2015).
The predictive performance of ANN was almost the same in both models (using all predictor variables vs only climatic predictive variables) with AUC of 0.97. The literature shows that feature selection can boost the classifier’s prediction accuracy, scalability, and generalization capability. This technique is critical in information discovery because it reduces computational complexity, storage, and cost (Gutkin et al. 2009). It should be noted, however, that any predictive feature may be irrelevant individually, but when combined with others, it becomes relevant (Gheyas and Smith 2010). As a result, feature selection does not always imply improved results, and in some cases, eliminating features could be detrimental (Guyon et al. 2008).
To the best of the author’s knowledge, no other study has used machine learning algorithms to forecast the incidence of LSDV infection using geospatial and meteorological predictive parameters. However, some similar studies utilized machine learning methods to predict the occurrence of some viral livestock diseases based on climatic data.
Liang et al. (2020) used machine learning methods to forecast African swine fever outbreaks around the world using bio-climatic variables, and Niu et al. (2020) applied various machine learning algorithms to forecast Peste des Petits ruminants (PPR) outbreaks based on certain bio-climatic variables and altitude data. Nevertheless, the time frame during which climate data (WordClim database which contains data for 1970–2000) used in these studies was before the time period during which disease outbreaks data utilized and this could be a potential source of bias. In contrast, in the present study, meteorological data were downloaded for the period 2011–2019 from CRU TS4.04 database (Harris et al. 2020) to provide better time concordance with event data of LSDV infection.
According to the feature selection algorithm, out of meteorological, animal density, land cover, and elevation data, only meteorological variables were chosen as significant predictive factors in the present study. Similarly, wet and warm climates which are prime habitat for blood-feeding arthropods have been linked to the occurrence of LSDV infection previously (Alkhamis and VanderWaal 2016; Chihota et al. 2003; Weiss 1968). Some studies which used statistical methods have found a connection between land cover characteristics and/or animal density and disease incidence. For instance, Alkhamis and VanderWaal (2016) examined LSDV outbreak records in the Middle East between 2012 and 2015. The most important environmental predictors that contributed to the ecological niche of LSDV were annual precipitation, land cover, mean diurnal range, type of livestock production system, and global livestock densities, according to ecological niche modeling. Allepuz et al. (2019) investigated the relationship between confirmed LSDV infection outbreaks and climatic factors, land cover, and cattle density in the Balkans, Caucasus, and Middle East between 2012 and 2018. The findings revealed that the likelihood of disease incidence was considerably higher in areas dominated by croplands, grassland, or shrub land. Higher cattle populations, as well as regions with a higher annual mean temperature and a larger diurnal temperature range, increased the odds. In contrast to areas covered mostly by forest, areas with sparse vegetation have a lower risk of infection.
Gari et al. (2010) conducted a questionnaire survey to perform a cross-sectional analysis to assess the distribution of LSDV infection and related risk factors in Ethiopia’s three major agro-climatic areas. Across agro-climate zones, herd-level prevalence of LSDV infection was slightly higher in the midland agro-climate than in the highland and lowland agro-climate zones. The odds ratio of LSDV infection incidence was 3.86 (95% confidence interval: 2.61–5.11) in the midland vs. highland region and 4.85 (95% confidence interval: 2.59–7.1) in the lowland vs. highland zone. The introduction of new animal, as well as communal grazing and watering management, was correlated with a significantly increased risk of LSDV infection incidence.
Molla et al. (2017) conducted a research between 2000 and 2015 with the goals of determining the geographical and temporal spread of LSDV infection outbreaks and forecasting the possible outbreaks in Ethiopia. The incidence varied by region, with the lowest in hot dry lowlands and the highest in wet moist highlands. They discovered that outbreaks were seasonal, occurring most often in the months after a long rainy season.
All the mentioned researches used statistical methods which are designed for inference about the relationships between variables and not making predictions. On the contrary, prediction made by machine learning algorithms aims at forecasting unobserved outcomes (Bzdok et al. 2018) which is what has been used in the present study. In addition to the different methods used, discrepancies in the results of similar researches could also be caused by the use of different independent variables (risk factors) and different study locations.
Howerver, it is worth mentioning that the LSDV outbreak data used in the present study were mainly passive accounts from veterinary facilities in various countries. There are some drawbacks of using passive monitoring data that should be addressed when analyzing the findings. The presence or quality of compensation schemes, the capability and transparency of veterinary facilities, the remoteness of some regions, and farmer visibility all impede reporting in some countries. Nevertheless, the lack of LSDV reports in some areas of the surveyed countries could be attributed to a lack of suitable environmental conditions for the dissemination of the disease in the area.
Other limitations of the current study include the small amount of data used, the small number of predictor variables used, and the possibility that the disease has spread to other regions of the studied countries with different climatic and geographical conditions since conducting this research.
In conclusion, some machine learning algorithms like ANN could be potentially used to accurately forecast the occurrence of LSDV infection based on some geospatial and meteorological parameters. Using this approach could be extremely beneficial to implement monitoring and awareness schemes, as well as preventive measures such as vaccine campaigns in areas where LSDV infection is a high risk.
Data availability
The datasets generated during and/or analyzed during the current study are available in the Mendeley repository, https://data.mendeley.com/datasets/7pyhbzb2n9/1.
References
Abadi, M., Agarwal, A., Barham, P., Brevdo, E., Chen, Z., Citro, C., . . . Devin, M. (2016). Tensorflow: Large-scale machine learning on heterogeneous distributed systems. arXiv preprint arXiv:1603.04467.
Abbass, H. A. (2002). An evolutionary artificial neural networks approach for breast cancer diagnosis. Artificial intelligence in Medicine, 25(3), 265-281.
Alemayehu, G., Zewde, G., & Admassu, B. (2013). Risk assessments of lumpy skin diseases in Borena bull market chain and its implication for livelihoods and international trade. Tropical Animal Health and Production, 45(5), 1153–1159. https://doi.org/10.1007/s11250-012-0340-9
Alkhamis, M. A., & VanderWaal, K. (2016). Spatial and temporal epidemiology of lumpy skin disease in the Middle East, 2012–2015. Frontiers in veterinary science, 3, 19. https://doi.org/10.3389/fvets.2016.00019
Allepuz, A., Casal, J., & Beltrán‐Alcrudo, D. (2019). Spatial analysis of lumpy skin disease in Eurasia—Predicting areas at risk for further spread within the region. Transboundary and emerging diseases, 66(2), 813-822. https://doi.org/10.1111/tbed.13090
Al-Shayea, Q. K. (2011). Artificial neural networks in medical diagnosis. International Journal of Computer Science Issues, 8(2), 150-154.
Von Backstrom, U. (1945). Ngamiland cattle disease: preliminary report on a new disease, the etiological agent being probably of an infectious nature. Journal of the South African Veterinary Association, 16(1), 29–35. https://hdl.handle.net/10520/AJA00382809_377
Baxt, W. G. (1995). Application of artificial neural networks to clinical medicine. The lancet, 346(8983), 1135-1138.
Breiman, L. (1996). Bagging predictors. Machine learning, 24(2), 123-140.https://doi.org/10.1023/A:1018054314350
Breiman, L. (2001). Random forests. Machine learning, 45(1), 5-32.https://doi.org/10.1023/A:1010933404324
Bzdok, D., Altman, N., & Krzywinski, M. (2018). Points of significance: statistics versus machine learning. In: Nature Publishing Group.
Chen, T., & Guestrin, C. (2016). Xgboost: A scalable tree boosting system. Paper presented at the Proceedings of the 22nd acm sigkdd international conference on knowledge discovery and data mining.
Chihota, C., Rennie, L., Kitching, R., & Mellor, P. (2003). Attempted mechanical transmission of lumpy skin disease virus by biting insects. Medical and Veterinary Entomology, 17(3), 294-300. https://doi.org/10.1046/j.1365-2915.2003.00445.x
Chollet, F. (2018). Deep learning with Python (Vol. 361): Manning New York.
Cox, D. R. (1958). The regression analysis of binary sequences. Journal of the Royal Statistical Society: Series B (Methodological), 20(2), 215-232. https://doi.org/10.1111/j.2517-6161.1958.tb00292.x
Fang, Y., Fataliyev, K., Wang, L., Fu, X., & Wang, Y. (2014). Improving the genetic-algorithm-optimized wavelet neural network for stock market prediction. Paper presented at the 2014 International Joint Conference on Neural Networks (IJCNN).
Flores-Fernández, J. M., Herrera-López, E. J., Sánchez-Llamas, F., Rojas-Calvillo, A., Cabrera-Galeana, P. A., Leal-Pacheco, G., . . . Martínez-Velázquez, M. (2012). Development of an optimized multi-biomarker panel for the detection of lung cancer based on principal component analysis and artificial neural network modeling. Expert Systems with Applications, 39(12), 10851-10856.
Freund, Y., & Schapire, R. E. (1997). A decision-theoretic generalization of on-line learning and an application to boosting. Journal of computer and system sciences, 55(1), 119-139. https://doi.org/10.1006/jcss.1997.1504
Gari, G., Waret-Szkuta, A., Grosbois, V., Jacquiet, P., & Roger, F. (2010). Risk factors associated with observed clinical lumpy skin disease in Ethiopia. Epidemiology & Infection, 138(11), 1657-1666. https://doi.org/10.1017/s0950268810000506
Géron, A. (2019). Hands-on machine learning with Scikit-Learn, Keras, and TensorFlow: Concepts, tools, and techniques to build intelligent systems: O'Reilly Media.
Geurts, P., Ernst, D., & Wehenkel, L. (2006). Extremely randomized trees. Machine learning, 63(1), 3-42.
Gheyas, I. A., & Smith, L. S. (2010). Feature subset selection in large dimensionality domains. Pattern recognition, 43(1), 5-13. https://doi.org/10.1016/j.patcog.2009.06.009
Gilbert, M., Nicolas, G., Cinardi, G., Van Boeckel, T. P., Vanwambeke, S. O., Wint, G. W., & Robinson, T. P. (2018). Global distribution data for cattle, buffaloes, horses, sheep, goats, pigs, chickens and ducks in 2010. Scientific data, 5(1), 1-11. https://doi.org/10.1038/sdata.2018.227
Golden, C. E., Rothrock Jr, M. J., & Mishra, A. (2019). Comparison between random forest and gradient boosting machine methods for predicting Listeria spp. prevalence in the environment of pastured poultry farms. Food research international, 122, 47-55.
Gutkin, M., Shamir, R., & Dror, G. (2009). SlimPLS: a method for feature selection in gene expression-based disease classification. PloS one, 4(7), e6416. https://doi.org/10.1371/journal.pone.0006416
Guyon, I., Gunn, S., Nikravesh, M., & Zadeh, L. A. (2008). Feature extraction: foundations and applications (Vol. 207): Springer.
Harris, I., Osborn, T. J., Jones, P., & Lister, D. (2020). Version 4 of the CRU TS monthly high-resolution gridded multivariate climate dataset. Scientific data, 7(1), 1-18. https://doi.org/10.6084/m9.figshare.11980500
Kanevski, M., Pozdnukhov, A., & Timonin, V. (2008). Machine learning algorithms for geospatial data. Applications and software tools.
Kara, S., & Dirgenali, F. (2007). A system to diagnose atherosclerosis via wavelet transforms, principal component analysis and artificial neural networks. Expert Systems with Applications, 32(2), 632-640.
Kia, S., Setayeshi, S., Shamsaei, M., & Kia, M. (2013). Computer-aided diagnosis (CAD) of the skin disease based on an intelligent classification of sonogram using neural network. Neural Computing and Applications, 22(6), 1049-1062.
Kovacs-Györi, A., Ristea, A., Havas, C., Mehaffy, M., Hochmair, H. H., Resch, B., . . . Blaschke, T. (2020). Opportunities and Challenges of Geospatial Analysis for Promoting Urban Livability in the Era of Big Data and Machine Learning. ISPRS International Journal of Geo-Information, 9(12), 752.https://doi.org/10.3390/ijgi9120752
Latham, J., Cumani, R., Rosati, I., & Bloise, M. (2014). Global land cover share (GLC-SHARE) database beta-release version 1.0–2014. FAO: Rome, Italy.
Liang, R., Lu, Y., Qu, X., Su, Q., Li, C., Xia, S., . . . Chen, Q. (2020). Prediction for global African swine fever outbreaks based on a combination of random forest algorithms and meteorological data. Transboundary and emerging diseases, 67(2), 935-946.https://doi.org/10.1111/tbed.13424
Ma, Y.-x., & Wang, S.-g. (2010). The application of artificial neural network in the forecasting on incidence of a disease. Paper presented at the 2010 3rd International Conference on Biomedical Engineering and Informatics.
Machado, G., Korennoy, F., Alvarez, J., Picasso‐Risso, C., Perez, A., & VanderWaal, K. (2019). Mapping changes in the spatiotemporal distribution of lumpy skin disease virus. Transboundary and emerging diseases, 66(5), 2045-2057. https://doi.org/10.1111/tbed.13253
Malki, Z., Atlam, E.-S., Hassanien, A. E., Dagnew, G., Elhosseini, M. A., & Gad, I. (2020). Association between weather data and COVID-19 pandemic predicting mortality rate: Machine learning approaches. Chaos, Solitons & Fractals, 138, 110137.
Molla, W., de Jong, M., & Frankena, K. (2017). Temporal and spatial distribution of lumpy skin disease outbreaks in Ethiopia in the period 2000 to 2015. BMC veterinary research, 13(1), 1-9. https://doi.org/10.1186/s12917-017-1247-5
Namazi, F., & Khodakaram Tafti, A. (2021). Lumpy skin disease, an emerging transboundary viral disease: A review. Veterinary Medicine and Science. https://doi.org/10.1002/vms3.434
Niu, B., Liang, R., Zhou, G., Zhang, Q., Su, Q., Qu, X., & Chen, Q. (2020). Prediction for global Peste des petits ruminants outbreaks based on a combination of random forest algorithms and meteorological data. Frontiers in veterinary science, 7.https://doi.org/10.3389/fvets.2020.570829
Pedregosa, F., Varoquaux, G., Gramfort, A., Michel, V., Thirion, B., Grisel, O., . . . Dubourg, V. (2011). Scikit-learn: Machine learning in Python. the Journal of machine Learning research, 12, 2825–2830.
Roche, X., Rozstalnyy, A., TagoPacheco, D., Pittiglio, C., Kamata, A., Beltran Alcrudo, D., . . . Larfaoui, F. (2020). Introduction and spread of lumpy skin disease in South, East and Southeast Asia: Qualitative risk assessment and management: Food & Agriculture Org.
Safavian, S. R., & Landgrebe, D. (1991). A survey of decision tree classifier methodology. IEEE transactions on systems, man, and cybernetics, 21(3), 660-674. https://doi.org/10.1109/21.97458
Scholkopf, B. (1998). Support vector machines: a practical consequence of learning theory. IEEE Intelligent systems, 13.https://doi.org/10.1041/X4018s-1998
Sprygin, A., Artyuchova, E., Babin, Y., Prutnikov, P., Kostrova, E., Byadovskaya, O., & Kononov, A. (2018). Epidemiological characterization of lumpy skin disease outbreaks in Russia in 2016. Transboundary and emerging diseases, 65(6), 1514-1521. https://doi.org/10.1111/tbed.12889
Tuppurainen, E., Venter, E. H., Shisler, J., Gari, G., Mekonnen, G., Juleff, N., . . . Bowden, T. (2017). Capripoxvirus diseases: current status and opportunities for control. Transboundary and emerging diseases, 64(3), 729–745. https://doi.org/10.1111/tbed.12444
Tuppurainen, E., & Oura, C. (2012). lumpy skin disease: an emerging threat to Europe, the Middle East and Asia. Transboundary and emerging diseases, 59(1), 40-48. https://doi.org/10.1111/j.1865-1682.2011.01242.x
Wang, Y., Li, J., Gu, J., Zhou, Z., & Wang, Z. (2015). Artificial neural networks for infectious diarrhea prediction using meteorological factors in Shanghai (China). Applied Soft Computing, 35, 280-290.
Wang, L., & Gupta, S. (2013). Neural networks and wavelet de-noising for stock trading and prediction. In Time Series Analysis, Modeling and Applications (pp. 229–247): Springer.
Wang, L., Teo, K. K., & Lin, Z. (2001). Predicting time series with wavelet packet neural networks. Paper presented at the IJCNN'01. International Joint Conference on Neural Networks. Proceedings (Cat. No. 01CH37222).
Weiss, K. (1968). Lumpy skin disease virus. In Cytomegaloviruses. Rinderpest Virus. Lumpy Skin Disease Virus (pp. 111–131): Springer.
Xu, C., & Jackson, S. A. (2019). Machine learning and complex biological data. In: Springer.
Yang, C., Huang, Q., Li, Z., Liu, K., & Hu, F. (2017). Big Data and cloud computing: innovation opportunities and challenges. International Journal of Digital Earth, 10(1), 13-53. https://doi.org/10.1080/17538947.2016.1239771
Zhu, M., & Wang, L. (2010). Intelligent trading using support vector regression and multilayer perceptrons optimized with genetic algorithms. Paper presented at the The 2010 International Joint Conference on Neural Networks (IJCNN).
Author information
Authors and Affiliations
Contributions
Study conception and design, material preparation, data collection and analysis, and writing the manuscript were all performed by E.A.S.. E.A.S. read and approved the final manuscript.
Corresponding author
Ethics declarations
Ethics approval
The manuscript does not contain clinical studies or patient data.
Conflict of interest
The authors declare no competing interests.
Additional information
Publisher's note
Springer Nature remains neutral with regard to jurisdictional claims in published maps and institutional affiliations.
Supplementary Information
Below is the link to the electronic supplementary material.
Rights and permissions
About this article

Cite this article
Afshari Safavi, E. Assessing machine learning techniques in forecasting lumpy skin disease occurrence based on meteorological and geospatial features. Trop Anim Health Prod 54, 55 (2022). https://doi.org/10.1007/s11250-022-03073-2
Received:
Accepted:
Published:
DOI: https://doi.org/10.1007/s11250-022-03073-2