
Abstract
NASA’s Dawn mission visited the large main-belt asteroids Ceres and Vesta, returning a rich data set. Its science and navigation cameras, Framing Cameras 1 and 2, provided more than 100,000 surface images in total of both targets with seven colour and one panchromatic channels. This paper summarizes the scientific calibration of the Framing Camera images, combining information from on-ground and in-flight calibration campaigns. We describe the calibration methods, algorithms, and parameters that led to the final level 1c data product, including correcting stray light sources. In addition, we detail the performance and stability of both instruments.
1 Introduction
NASA’s discovery mission Dawn orbited the large main-belt asteroids Vesta and Ceres from 2011 to 2012 and from 2015 to 2018, respectively (Russell and Raymond 2011). The onboard Framing Camera (FC) system (Sierks et al. 2011) returned, in total, 105,000 frames, including 31,408 Vesta and 70,819 Ceres images. The instant scientific objectives of the FCs were the support of spacecraft navigation and the determination of several basic target parameters, such as body shape, spin axis orientation, and density. These images are the basis for a detailed characterization of the mission targets, their formation, and evolution, which belong to the top-level scientific goals of the mission.
The scientific mission carried two identical and physically separated FC instruments for redundancy. The cameras covered the visible and the near IR wavelength range between 0.4 and 1.0 μm. The FCs (Fig. 1) were built and tested by the Max Planck Institute for Solar System Research (MPS, Göttingen) with hardware contributions by DLR PF Berlin (detector and front-end electronics) and IDA Braunschweig (digital electronics).

The Dawn FC During integration at MPS
The paper summarizes the previous calibrations of the FCs, derived from data obtained during the on-ground campaigns in 2005–2007, as well as in-flight calibration campaigns in 2007–2018, including the final radiometric calibration at the mission’s end. Compared to previous calibration reports, this paper combines the results of all FC calibration campaigns and details the generation of the level 1c image data, which is the highest corrected scientific image data product. Thus, the manuscript also serves as a guide through the processing of the level 1b data to reach level 1c, which will be stored at the NASA Planetary Data System (PDS).
2 The Dawn Framing Camera
The FC system comprises two identical high spatial resolution optical imaging devices: FC1 and FC2. The optical parameters of the cameras are summarized in Fig. 2 and Table 1, further details about the camera system can be found in (Sierks et al. 2011). The camera optics were built as a telecentric lens system. This design ensures that the principal ray leaving the last lens of the surface is perpendicular to the filters and the CCD, such that the transmission bands of the dichroic layers of the filters are independent of the field position. This design has the advantage of very low geometric distortion, as required for the optical navigation of the spacecraft. The optical system is built from radiation-resistant glasses and is corrected to near-diffraction-limited performance. The FC (with the clear filter F1) has a wide spectral bandwidth (400-1050 nm), which provides good sensitivity but also has significant chromatic aberrations. In the case of the bandpass filters (F2-F8), the different filter thicknesses are utilized to reduce the colour aberrations and improve the resolution (PSF). This results in slight variations in the focal distances for the different filters.

The Dawn FC optical system comprising four lenses (L1-L4), and a selectable band-pass filter
The FC is equipped with a baffle system and internal stops that act as light traps to reduce the amount of stray light from sources located outside the camera’s field of view. Both cameras are mounted on the spacecraft’s X-deck such that the optical axes are parallel to the spacecraft’s Z-axis [2]. Each camera is equipped with one broad-band (clear) filter and seven narrow-band filters (see Table 1).
The cameras utilize a TH7888 1024x1024 pixel front illuminated frame transfer CCD detector, sensitive in the 400-1050 nm wavelength range. The frame transfer detector has the advantage of operating without a mechanical shutter and thus does not require moving components. The chip minimizes the readout smear effect: each exposed image is transferred to a storage area on the chip by a fast (1.32 ms) line-by-line shift operation (Sierks et al. 2011). The residual readout smear (especially for short exposures) is removed during the image calibration process (Ruyten 1999).
The CCD has a large full-well capacity (320 ke-), providing a wide dynamic range. The front-lit CCD has a relatively low (appr. 40%) fill factor (the ratio of light-sensitive area to total pixel size) due to the CCD structures and conductors built on top of the light-sensitive pixel area. Since the device contains no micro-lenses or reflection-reducing surface coatings, the quantum efficiency of the detector is rather low (18% max.) (Thomson-CFS 1999). The light sensitivity of a single pixel is not uniform across the full 14x14 μm pixel area. This specific design of the CCD has a positive effect on the pixel-crosstalk and the overall spatial resolution but makes point source radiometry challenging. An accurate calibration by using stars is difficult because the quasi-point sources (the star’s point spread functions, PSF) do not always illuminate the light-sensitive area of a pixel completely, causing a large standard deviation of the integrated flux response. However, asteroid surfaces are extended targets and thus are unaffected by this radiometric uncertainty.
The detector surface is not optically coated, and thus, its high reflectivity causes Narcissus ghost reflections inside the camera, which, in combination with the colour filters, create significant stray light that needs to be corrected before the images can be used for scientific purposes (see Sect. 3.2) (Kovacs et al. 2013).
The front-end electronics contain a 14-bit A/D converter with about 18 e-/DN gain, providing low photon noise and a high S/N ratio. The CCD saturation level is above the A/D conversion limit. This results in a uniform 16383DN saturation limit across the full image.
A total of four FC units were built for Dawn: two flight units (FC1, FC2) and two spare units (FM1, FS2). In this paper, we concentrate on the calibration of the FC1 and FC2 units mounted onboard the spacecraft, which returned images from Vesta and Ceres. However, in some cases, we also refer to the spare cameras to validate the calibration procedures. The two spare units were used on the ground to understand better and characterize the parasitic light termed “in-field stray light” of the cameras The flight units were characterized in detail at the MPS ground test facility before launch and during the delta-calibration in-flight campaigns. Due to the failure of Dawn’s reaction wheels, the number of in-flight delta calibration campaigns was reduced after the Vesta phase. Table 2 summarizes the on-ground and in-flight calibration campaigns that were used for the present analysis.
3 On-Ground Calibration Campaigns
3.1 Pre-Flight Calibrations
Prior to launch, the FC1 and FC2 units, as well as the FM1 spare unit, were extensively characterised at MPS in 2005 and 2006 (see Table 2). These tests validated the design and integration of the instruments and also provided the first set of calibration parameters. These characterisations included:
-
Software and hardware tests: readout, coding, compression, door, and filter wheel behaviour.
-
Basic operational parameter validation: quantum efficiency and instrument radiometric response, readout noise, bias, and dark current measurements.
-
Imaging tests: flat field response, spatial resolution tests with PSF and contrast response measurements, distortion test.
The ground calibration results agreed with the design parameters. The electronics operated within the expected ranges. The dark charge generation was characterised at different temperatures. The evolution of the dark current and the hot pixels were continuously monitored during the mission, and the parameters were adjusted to the actual flight data (Sierks et al. 2011).
The camera optical resolution and the focus positions of each filter were measured at ambient and operational temperatures in a thermo-vacuum chamber. The PSF was tested by a collimator and pinhole target system for all cameras, and the resulting images were fitted by the two-dimensional Gaussian method. The measured point source responses were in the order of the expected one-pixel size for all cameras and bands. The best PSF was measured with the F2 (Green) filter (Fig. 3). However, the expected filter-by-filter variation was not always conclusive due to the small spot aliasing effects and the low pixel fill factor. Results are affected by how the projected image point was located with respect to the structured sensitive area of the CCD.

Typical on-ground PSF images of the FC1 unit with filters F1 - clear (top left), F2 - 550 nm (top right) and FC2 unit with filters F1 (bottom left) and F2 (bottom right)
The Modulation Transfer Function (MTF) was measured only on the FC1 unit, but the similar PSF results suggest comparable MTF for all cameras (Fig. 4). This was later supported by analysing star-field images. The test utilised a collimated USAF test target in several shifted positions to minimise the aliasing effect. In the case of each resolution step, the highest contrast image was used for the calculation. The contrast values were measured at three field points, and the horizontal and vertical values were averaged.

Average measured MTF of the FC1 for the individual band-pass filters
The F1 (clear) filter showed a significantly lower contrast response, compared to the F2 filter due to its higher chromatic aberration. This result agreed with the optical raytracing simulations. The radiometric response was measured from 400–1000 nm in 2 nm steps by a collimator with a monochromatic light source in its focus. Due to the required duration of more than 24 hours for the full test, the stability of the equipment was not as good as expected, leading to several per cent of uncertainty. In addition, the broad-band filter response was measured by using an integrating sphere (Fig. 5). The results of these measurements were used to calculate the absolute calibration factors, which were significantly improved in 2008 (Schröder et al. 2013) and revised further in 2019 (presented in this paper), compared to pre-launch measurements.

DAWN FC1 detector response functions of all filters as measured during the ground calibration in 2006
The FC flat field calibration campaign used the same integrating sphere and vacuum chamber setup as the Rosetta OSIRIS cameras (Fig. 6). The sphere illumination used 2800 K tungsten halogen light sources. The surface radiance was set to 1.038 and 6.788 mW/m2 /sr/nm @ 555 nm.

The OSIRIS integrating sphere at the MPS laboratory (left) and the radiance of the internal surface (right)
The flat field images were acquired for all filters at 20%, 40%, 60%, and 80% of the saturation exposure. For the first generation of the flats, the 60% saturation images were used. The images were processed by removing the bias and the smearing effects and normalized to 1.0 in the centre region of the images (see Sect. 5). The resulting corrected images (Fig. 7) exhibited unexpectedly high standard deviations of the intensities: most of the high spatial frequency artefacts were low in intensity. These were caused by the CCD structure and dust particles on both sides of the filters. The stronger, high-intensity artefacts appearing on all filter images are contamination on the detector surface. However, the low spatial frequency artefacts were dominated by a strong drop in intensity towards the edges. This kind of effect is usually caused by vignetting or internal stray light effects. Since the F1 filter was practically free of this effect, it indicated a ghost reflection by the dichroic filter surfaces.

Original ground calibration flat images of the Dawn FC1 in the 0.9-1.1 range
3.2 FM1 Stray Light Investigation
The ground calibration of the flight units indicated that the flat field and radiometric measurements were affected by Narcissus ghost reflections (see also Sect. 5.7.1). In order to investigate these effects, a dedicated stray light measurement was performed on the FM1 (spare) unit in June 2007 at MPS’s optical laboratory. The test revealed that several in-field stray light reflection paths are creating parasitic reflections inside the camera. The most prominent is the reflection between the CCD detector and the band-pass filters. The estimated reflected energy is shown in Fig. 8.

Estimated reflected ghost flux at 550 nm (F2). The calculation considers the perpendicular reflectivity of the filter and the CCD surfaces
The test setup used a strong point source in front of the camera (FM1), and the images were acquired with increasing exposure times. The point source was generated by an optical fiber in the focal plane of a collimator. A set of images was exposed without saturating the pixels. The increasing exposure time saturated more and more of the directly illuminated pixels but gradually revealed the different ghost reflections of the CCD image point (Fig. 9). The reflected ghost pattern is complex due to reflections from both sides of the band-pass filters, and the CCD not behaving like a simple mirror surface but as a 2-dimensional diffraction grating. This behaviour was confirmed by calculating the angular separation between the diffraction orders from the general grating equation (1) with the pixel pitch of the CCD and the band-pass wavelength:
where: m is the diffraction order, d is the grating period, and \(\lambda \) is the central wavelength of the band-pass filter.

Narcissus ghost reflections of a bright point source with 10 ms (upper left), 1 s (upper right), and 10 s (lower left) exposure, with the central part enlarged (lower right)
For all filters, the pixel distances of the neighbouring circular artefacts on the images match the calculated angles and the CCD filter distances. The most prominent microelectronic structures of the CCD (the phase conductors; Thomson-CFS 1999) create a 7 μm period (142.9 line-pairs/mm) in the column and 14 μm (71.43 line-pairs/mm) in the row direction. Due to the complex surface structure under the conductors, the different reflected orders have different flux content. The reflected energy is further increased in the higher diffraction orders because the dichroic layers reflect more of the oblique beams.
The effect was also observed for the first images during the Vesta approach phase. Since it is a complex scene-dependent effect, the ghost flux on a given pixel depends on the illumination of all other pixels of the CCD area. Thus, local pixel correction methods, like those presented in (Schröder et al. 2014), can only provide a first-order correction, which is insufficient if colour spectra are needed for mineralogically motivated analyses. The ghost reflection is generated by each small image area in the same way, and the complete straylight artefact can be modelled as a convolution effect, similar to the image formation itself. The lab data were used to create the first stray light removal algorithm for the FC exhibiting high accuracy (Kovacs et al. 2013).
4 Flight Calibration Campaigns
4.1 Functional Tests After Launch
After launch, the first in-flight verifications took place during the initial checkout (ICO) campaign in 2007 and consisted of functional, performance, and calibration tests. In addition, during the cruise phase to Vesta, “semi-annual checkouts” were performed to monitor the camera status: bias stability, dark current, and temperature behaviour. The pointed observations during these semi-annual checkouts were limited after the Vesta phase due to the failure of the spacecraft’s reaction wheels.
The ICO tests were thoroughly analyzed by the MPS team (Schröder et al. 2013), and based on the star calibrations, which improved the radiometric accuracy of the system. The optical resolution and other system parameters were in line with the design expectations and the ground calibration results. The Vega images were in agreement with the expected 1-1.5 pixel PSF size (Fig. 10).

Typical Vega Level 1A flight images of the FC1 unit, shown from left to right with filters: F1 (clear), F2 (550 nm), and FC2 unit filters: F1 and F2
The FC1 and FC2 were very similar in PSF size, measured with the 2-dimensional Gaussian fit (image shows different exposure times).
4.2 Geometric Distortion
The primary scientific objective of the FC was asteroid surface mapping, which requires distortion-free images. The telecentric optical design ensures a very low geometric distortion across the full field of view. The maximum theoretical distortion at the image corners (by design) is less than 3 μm, i.e. significantly lower than the pixel size, and thus no specific distortion correction algorithm has been applied in the FC calibration pipeline. An earlier analysis of in-flight images suggested a larger geometric distortion and a focal length variation due to chromatic aberration (Schröder et al. 2013). To validate the expected low distortion, an analysis of star-field images obtained during the ICO mission phase was performed. In the case of this analysis, we calculated with a distortion-free system and measured the effective focal length and the star position errors. This calculation confirmed a slight focal length variation in agreement with the design data (Fig. 11), with distortion values less than a fraction of a pixel across the FOV for all filters (Table 3).

Designed (Fdes) and measured chromatic focal shift of the FC1 (F\(_{\mathrm{FC1}}\)) and FC2 (F\(_{\mathrm{FC2}}\))
In order to measure the actual distortion, each star-field image was pattern-searched for small-size, symmetrical artefacts with increased intensities (potential stars). A two-dimensional Gaussian fit was applied on an 11x11 pixel wide area surrounding the highest intensity pixel to derive an estimation of the stars’ point spread function. Obvious cosmic hits and hot pixels were filtered out by their specific shape. If the standard deviation parameter of the fit in the horizontal and vertical direction was smaller than 3 pixels and the maximum intensity was at least 5% of the saturation limit (820 DN), the feature was considered to be a star, and its parameters (position on CCD) were recorded. In order to compare the detected and the real geometry, star positions of the imaged FOV were extracted from the Tycho2 star catalogue (Høg et al. 2000) and corrected for proper motion. The angular positions derived from the catalogue were projected onto the camera image plane by gnomonic projection using the camera parameters and spacecraft pointing. The matching star and detected PSF positions were paired, while potential detections of stars with no matching catalogue stars were ignored (possible noise, missed cosmics, etc.). The camera pointing parameters (Right Ascension, Declination, North Azimuth, and camera focus) were optimized to obtain the smallest deviation of the positions. The average and the maximum of the position errors were calculated (Table 3).
Considering the uncertainty of the PSF fitting due to the pixels’ low fill factor and detector sensitivity area, the results are in accordance with the optical design:
-
The focal length variation shows the expected chromatic shift effect (Table 4).
Table 4 Designed (Fdes) and measured chromatic focal shift of the FC1 (F\(_{\mathrm{FC1}}\)) and FC2 (F\(_{\mathrm{FC2}}\)) -
The average geometrical distortion is less than 0.25% of the size of a pixel across the full field of view.
The results confirm that no distortion correction is required in the calibration pipeline, especially since a correction resampling would cause higher errors than without. The maximum image size variation at the corners (due to the chromatic focal length change) is smaller than 0.5 pixels for all filters, except for F8, which is slightly over one pixel.
4.3 Residual Charge Effect
An in-depth analysis of the pre-launch images revealed that the FC1 CCD is not completely cleared prior to the next image acquisition. This means that certain pixels of the new image contain charges created by the previous illumination. The effect was also examined during the Vesta approach phase (Schröder et al. 2013) and later during the Ceres calibration observations (CTL). The effect is apparent in 0 ms exposure images, on top of the illumination ramp created by the readout smear. At first glance, the artefact appears as a “random noise” pattern towards the bottom right (1024,1024) image corner (see Fig. 12). The full mission tests revealed that the effect is becoming stronger with the illumination intensity and can reach up to 10-15% additional DNs for certain pixels or areas on the detector. This is not a random effect but repeated very consistently during the mission. The flight tests also revealed that the FC2 unit was not affected at all by this issue.

The FC1 residual charge effect demonstrated on two example images. Vesta F1 original image 0-4000DNs (upper left), residual image content 0-400DNs (upper right), Ceres F2 original image 0-600DNs (lower left), residual image content 0-60DNs (lower right)
During the Vesta approach phase, an onboard hardware/software solution (called “pre-clear”) was introduced to minimize the effect on the FC1. In the case of colour images, during the Ceres imaging, the average residual charge error was less than 1%, with a few pixels reaching a 10% maximum. However, since the FC2 has been used during the entire mission as the prime camera, the residual charge does not have any influence on the science return.
4.4 Star Calibration at Mission End
At the end of the DAWN mission (C2E phase), a final star calibration sequence was executed for both cameras. Vega (\(\alpha \) LYR) images were acquired with all filters. The exposure times were set to normal (unsaturated) and ten times overexposure. A large number of repeated measurements, together with the previous Vega observations, served as the basis of the improved radiometric calibration. The aperture photometry of the Vega images showed a relatively high standard deviation due to the low fill factor of the detector pixels (Table 5). However, the large number of measurements provided a more accurate approximation of the average radiometric values.
5 Revised Image Calibration
5.1 MPS Calibration Pipeline
Dawn FC science images are stored in different data levels, which correspond to the levels of correction:
-
Level 1A product: calibrated image header with raw (16-bit integer) image content.
-
Level 1B product: calibrated image header with radiometrically calibrated (32-bit float) image content.
-
Level 1C product: calibrated image header with radiometrically calibrated (32-bit float) image content and stray light correction.
The calibration steps are applied sequentially to the image data. The description of each step and the calculation parameters are stored in the HISTORY section of the PDS image header (see Fig. 13). In the following sections, we describe
-
Each calibration step applied to the individual data levels
-
The method used to calibrate the data
-
The parameters used for the correction and, whenever applicable
-
The stability of these parameters over the mission duration

The DAWN FC calibration pipeline structure
The revised calibration pipeline summarizes the findings of all the previously listed ground and flight calibration campaigns. In comparison with the earlier pipeline versions, the improved radiometric results are achieved by re-working the flat field, the absolute radiometric scaling, and the stray light correction. The parameters and procedures of these three steps are strongly cross-related and must be determined together.
5.2 Bias Removal
The bias is a pre-adjusted offset of the readout electronics to avoid losing information due to noise effects at the analogue-digital converter (ADC). The bias needs to be subtracted from the science image. The FC has a specific commanding mode to acquire bias frames, which are images of 0.0 s exposure time, dedicated to measuring and monitoring the electronic bias offset level. To avoid any illumination during the bias acquisition, and especially during the readout process, the door of the instrument was closed when taking bias frames. Bias frames were collected regularly during ground campaigns and flight. Our analysis of all bias frames indicates that the bias value is constant throughout the readout and does not show a structure or significant pixel-to-pixel variations (standard deviation is less than 2 DNs). It is therefore removed by subtracting a constant (average) value from all pixels of a given image. In addition, the analysis of the bias frames during flight showed that the bias average values exhibited a slight temperature dependence for both flight instruments (about 1.1 DN/K for FC1 and 1.2 DN/K for FC2). Since the FC electronics did not contain a dedicated temperature sensor at the AD converter (only at the CCD), detailed analysis and precise correction of this effect are not feasible. Fortunately, the bias can also be estimated from the “full-full frame” image pre-scan area average. The procedure of bias determination was as follows: at the beginning of each observation phase, “full-full frame” test images were acquired (images with all CCD pixels including dark and pre-scan area). In these cases, the actual bias was calculated from the “pre-scan” image segment. In the case of regular science images, the transmitted pre-scan averages are invalid due to a compression software bug and were replaced on the ground by a predetermined bias value (based on the previously acquired “full-full frame” images). We found that the full frame bias standard deviation for both cameras was less than 1.5 DN during the entire mission, which is also an indication of the low readout noise. The temperature stability of the instrument was also high: For 95% of the images, the CCD temperature was:
-
222.4 ± 7 K for FC1
-
217.7 ± 4 K for FC2
Since the bias removal value was determined for each mission phase separately, the temperature variation during the full mission duration did not affect the accuracy of the bias correction.
5.3 Dark Current Correction
The dark current generation of both CCDs was extensively characterized during the pre-launch calibration and in-flight campaigns. At the beginning of each observation phase, nine dark images were acquired. The darks were bias-corrected, median averaged, stored, and used as the dark baseline reference for the following mission period. The dark correction of each science image was conducted by subtracting the estimated dark frame from the bias-corrected image. For each individual science image, a synthetic dark frame was computed by scaling the dark reference frame to the actual CCD temperature and exposure time. The dark current D in (DN/sec) of a typical pixel is assumed to follow the formula below:
Where: A and B are instrument-specific constants, T is the CCD temperature in [K] and kB is the Boltzmann constant. The B constant was determined during the ground calibration to B = 1.018⋅10−19, adopted for all dark current frames. For FC1 we found A = 8.91⋅1012 (pre-launch) and 1.35⋅1013 (post-launch), and for FC2 we found A = 1.26⋅1013 (pre-launch) and 2.03⋅1013 (post-launch) (Schröder et al. 2013). The scaling factor for the reference dark frame is, therefore:
Where: texp is the exposure time of the actual frame and, texpDark is the exposure time of the dark frame, TCCD is the detector temperature [K] of the actual frame and, Tdark is the detector temperature [K] of the dark frame.
During the flight, reference dark frames were acquired before each mission phase, and the scaling was using these data, consequently, the A constant was cancelled out in the calculations. Moreover, the FC detector temperature was kept low (around 220 K) and the exposure times were also kept low to avoid motion smearing during science image acquisition, and the level of the dark noise amounts to less than 0.1 DN/s during the full mission (Fig. 14, 15). Although the dark current did not significantly affect most of the science images, the dark charge evolution was a major indicator of the FC system stability. Both the median dark current generation, and the number of hot pixels increased significantly during the full mission, but the effect was still low at the end of the Ceres phase.

The FC1 dark evolution at different mission phases

The FC2 dark evolution at different mission phases
5.4 Read-Out Smear
After the acquisition, the image data is transferred from the exposed region of the CCD into the (covered) storage area for read-out (for details, see Thomson-CFS 1999). During this fast (1.32 ms) transfer, the image continues to be exposed by the illuminated surface. Hence, the bottom rows will enter the storage area immediately, but the top rows will accumulate additional charges while shifted down to the CCD’s storage area, which introduces a gradient (excess of light of up to 1.32 ms) from the top to the bottom of an image. This is known as the “electronic shutter effect”. If the exposure times are in the order of the shift duration (1 ms - 1 s), the effect is significant, and the images need to be corrected for this smear. The applied correction algorithm calculates the smear from the image content, which assumes that the scene witnessed during the transfer is precisely that captured by the image. It starts with the known 1.32 ms transfer time of the full image, which contains 1056 rows to the storage area of the CCD. The shift time per row is t\(_{shift}\) = 1.25 μs. Only 1024 rows (active area) are actually exposed for a time t\(_{exp}\) (s). It iteratively subtracts the image smear by calculating the smear contribution si for row ri. The method is described in (Ruyten 1999).
5.5 Flat Field Correction
The flat calibration of the FC has been performed in the MPS optical laboratory in February 2006 for the FC1, and in August 2005 for the FC2. The measurements used a 1.2 m integrating sphere illuminated by halogen lamps (see Fig. 6). The resulting flat images showed an unexpectedly high-intensity variation, especially for the band-pass filters (see Fig. 7), for which the following primary sources were identified:
-
Ghost reflections between the detector surface and the band-pass filters (Sect. 3.2).
-
Inhomogeneity of the radiance of the integrating sphere.
-
Stray light reflections from the optical setup (e.g.: vacuum chamber window, and flanges).
If the original flat frames would have been used for the science image calibration, it would have resulted in improper correction (Schröder et al. 2014). In order to avoid this, the original laboratory flat images underwent additional processing. In the first step, we split the flat frames into two parts:
-
A low spatial frequency frame, which comprises the effect of the camera in-field stray light, target radiance spatial variation, and the parasitic light from the measurement setup. These effects show a highly blurred, large-scale intensity variation in the range of a few hundred (or more) pixels (Fig. 16).
Fig. 16 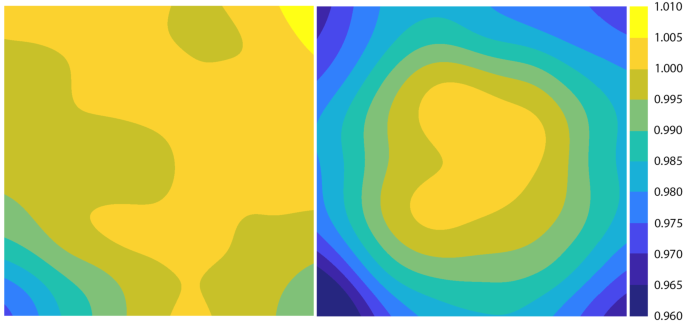
The FC2 F1 and F2 “flat low” image, Px(0,0) is top left. The colour bar shows the deviation from the normalized value (1.0)
-
A high spatial frequency frame, which contains the effect of the detector pixel-to-pixel sensitivity variations, dust particles and other contamination on the CCD, dust particles on the colour filters, as well as coating non-uniformities. These artefacts appear as 1–100 pixel size intensity variations (Fig. 17).
Fig. 17 
The FC2 F1 and F2 “flat Hi” image, Px(0,0) is top left. The colour bar shows the deviation from the normalized value (1.0)


The flat correction step of our calibration pipeline uses only the high spatial frequency component, removing the most prominent (filter-dependent) non-uniformity variations, while the residual low-frequency flat removal is part of the stray light removal step (see Sect. 5.1). The final “flat high” frames are created from the original laboratory flat frames, dividing them by the low spatial frequency flat frames (“flat low”). The “flat low” frames are also calculated from the laboratory flat frames, by applying a 200-pixel Gaussian filter on them. The original laboratory flat frames are assembled as the average of the individual laboratory flat images after the following processing steps:
-
The bias was subtracted by the pre-scan CCD area (Sierks et al. 2011) similarly to the science images (see Sect. 5.2).
-
Removal of dark current (see Sect. 5.3).
-
Removal of the readout smear (Sect. 5.3).
-
Removal of in-field stray light (see Sect. 5.7).
-
Normalization of the average intensity to 1.0.
Figure 16 and Fig. 17 show, as an example, the resulting flat low and flat high images for the clear (F1) and the green (F2) filters.
5.6 Exposure Time Correction
This calibration step normalizes the image to 1.0 s exposure time, dividing each pixel value by the commanded exposure time. After this procedure, the resulting calibrated images become independent of the applied exposure duration and show only the true radiance effect.
5.7 In-Field Stray Light Removal
The in-field stray light is an additional undesirable signal caused by multiple reflections of the incoming image-forming light within the optical system (see Sect. 3.2; Kovacs et al. 2013; and Schröder et al. 2014). It is strongly scene-dependent and decreases the radiometric accuracy of the band-pass filters. The effect can increase the detected radiance of extended targets by several per cent (see Table 6). This correction was applied to create level 1C from their corresponding 1B images, including the clear filter data. However, the Narcissus ghost correction part was applied only to the narrow-band filter images since the clear filter images are essentially free of this effect due to the low surface reflectivity of the F1 filter.
The primary sources of in-field stray light are the components near the image plane of the cameras: the CDD detector, the band-pass filters, the last lens L4 (closer to the CCD), and the last aperture flange in front of the filter wheel. The previous correction method, developed after the Vesta approach (Kovacs et al. 2013), handled only the Narcissus ghost reflected by the filter surfaces. The current method addresses other stray light sources too.
5.7.1 Narcissus Ghost
The Narcissus ghost (Fig. 9 and Fig. 18) is the strongest stray light effect of the FC, responsible for about 70–80% of the detected additional flux. A correction method for this ghost was already suggested before reaching Vesta (Kovacs et al. 2013). The correction method was developed using the results of the 2007 ground calibration campaign (on the flight spare FM1), and the in-flight stray light tests in 2012. The method and the parameters are refined in this paper.

Ghost pattern of an overexposed point source on the bottom right corner of the CCD with each filter, and a correctly exposed F1 image (bottom right image)
The Narcissus ghost is caused by the CCD, reflecting the light of the illuminated image area back towards the band-pass filter surfaces, which reflects back again to the CCD (see also 8). This Narcissus effect is accompanied by a two-dimensional grating behaviour of the detector, creating a grid of multiple reflected spots from each illuminated pixel (Fig. 18). In order to calibrate the Narcissus ghost, laboratory images were obtained by using an illuminated point source in front of the flight spare camera FM1. To reveal the fine structure of the ghost pattern, highly overexposed images of the point source were acquired, such that the ghost pattern became clearly visible. Due to the camera’s telecentric design and the microstructure of the CCD, which is identical across the entire image, the ghost pattern around a point source image is always identical for a given band-pass filter, regardless of the field angle. However, the pattern is strongly filter-dependent (Fig. 18). The diffraction pattern is dominated by the 7 μm horizontal and the 14 μm vertical conductor structures of the CCD pixels Thomson-CFS (1999). Using the grating formula (1), the pattern geometry can be reconstructed.
Based on the laboratory ghost measurements in 2011 and 2014 ghost (18), we computed synthetic ghost patterns for each filter (19). The (2048x2048 pixel) pattern represents the ghost contribution of a unit intensity point source target. The pattern geometry, the diffraction spot locations, and sizes were created using the grating equations and the optical design data of the camera. The intensity ratio of the diffraction orders was measured on the laboratory images.

F6 Synthetic ghost pattern extended to double frame size (2048x2048 pixel)
The (synthetic) Narcissus ghost contribution of a science image is calculated by the convolution method (Kovacs et al. 2013). The method assumes that the detected image (I\(_{det}\)) can be expressed as the sum of a series of images, where the first term (I0) is the expected ghost-free image, followed by the first-order ghost (I\(_{R1}\)) and the multiple reflection images (I\(_{Rn}\)):
Since the intensity of the ghost is much smaller than the ghost-free image, the second and higher-order reflected images are negligible compared to the first two terms, and the ghost-free image can be calculated by subtracting the first-order ghost contribution from the detected image. The ghost effect computation method is based on the fact that each small detector area, illuminated by a point source, produces similar reflected light intensity distributions and these light intensity distributions are a linear function of the illumination flux of the source. In this case, the first-order ghost image is formed as the convolution of the ghost-free image and the point source stray light function, i.e., the stray light image generated by a point source.
Each illuminated pixel generates an identical reflected intensity distribution (PS point source stray light function) scaled by the pixel flux. These partial reflection images add up and form the first reflection image: I\(_{R1}\)(I0). Since the stray light energy content is relatively low compared to the ghost-free image, as a first approximation, we can use the detected image as the first estimate of the ghost-free image in the convolution.
The accuracy is further improved by a second iteration, using the I0 result of the first calculation. The accuracy of our applied method depends on the accurate description of the Ps point source stray light function. In our calibration pipeline, the synthetic ghost pattern is used as the Ps ghost convolution kernel. The calibration step is implemented as a two-dimensional numerical convolution of the original image and the convolution kernel (synthetic ghost kernel). The result of the convolution is the ghost image, which contains only the ghost contribution, and that is subsequently subtracted from the original image. By using the method described above, science colour images of the FC can be corrected for parasitic light.
5.7.2 Lens Reflection Ghost
The analysis of the Vesta images revealed that besides the Narcissus ghost, other but weaker stray light effects are also present in the optical system. A part of the image-forming light is reflected from the front and rear surfaces of the band-pass filter back towards the last lens element (Fig. 2). The back surface of the lens acts as a convex mirror, causing a widespread, low stray light contribution, but the front surface performs as a concave mirror collecting the reflected light on the CCD detector (Fig. 20). This effect is about a magnitude smaller than the Narcissus reflection but still causes extra flux. The artefact is also visible on the F1 (clear filter) images.

Lens reflection ghost of a point source image with filter F2 (marked with dashed line). The lens ghost position is not constant with respect to the source illumination
The lens ghost is handled similarly to the Narcissus ghost: it can be removed with a convolution method. The convolution kernel is formed as a double elliptical artefact. However, size and position change with respect of the field position (pixel coordinates). The geometry is calculated by ray-tracing data, based on the lens and filter geometry. The relative intensity of the kernel spot was measured on the laboratory test images. In order to increase the processing speed of the numerical convolution, the images and the kernels are compressed to 4x4 binning. Since the kernel and the resulting convolved image are strongly blurred, this approximation is not reducing the accuracy significantly.
5.7.3 Residual Ghost
Besides the two dominant scene-dependent ghost components described above, the colour images were corrected for an additional residual ghost component. The source of this component is also the reflected flux from the CCD and the band-pass filter. The last scattering surface is not a specular optical surface but the aperture flange in front of the filter wheel and the lens tube. This causes a widespread halo on the detector, proportional to the overall illumination intensity. The effect is approximated by a two-dimensional polynomial equation. The base points of the polynomial were measured on the partially filled Vesta and Ceres images. (Fig. 21)

The effect of the stray light removal on image: FC21A0036545_15124034820F6. Left: corrected image (0-600DN range), middle: corrected image, in the 0-40 DN range, right: original image in the 0-40 DN range. Images are processed by bias, dark, smearing, and flat-field correction
5.8 Absolute Radiometric Calibration
In this calibration step, the normalised image pixel values [DN/s] are converted to radiance units [W/m2/sr/nm] by dividing them with the absolute calibration factor (responsivity factor) corresponding to the actual filter channel. This standard simplified technique assumes that the illumination spectrum is similar to the reflected spectrum and the filter band-pass is relatively small. In this case, the error caused by the reflectivity variation in the filter band-pass is negligible, and the surface radiance can be characterised at the filter’s reference wavelength.
The revised radiometric calibration, and in particular the determination of the absolute calibration factors, are based on the Vega star observations acquired throughout the full mission. Other star (and planet) observations were also considered, but due to their significantly lower signal-to-noise ratios, they were not used for the final calculations (see Table 7). Details on the basic methods and terminology can be found here: (Hapke 2012) and (Yoon and Kacker 2015). The Vega star images were processed by applying the following steps:
-
The bias was subtracted by the pre-scan CCD area (5.2).
-
Removal of dark current (see Sect. 5.3).
-
Removal of the readout smear (Sect. 5.4).
-
Flat field correction was applied using the revised flat-high images (Sect. 5.5).
-
The image content was normalized to 1.0 s exposure time.
-
The raw flux DNs were calculated by aperture photometry using a 15x15 pixel window.
The calibration method was similar to the one used for the Rosetta OSIRIS pre-hibernation images (Magrin et al. 2015). The Si(\(\lambda \)) camera responsivity function [DN⋅m2/W/s/nm] for each filter channel is calculated by the following equation:
Where: \(\lambda \) is the wavelength [nm], AP is the camera entrance pupil (aperture) area [m2], Q(\(\lambda \)) is the detector quantum efficiency [e−/photons], Ti(\(\lambda \)) is the camera channel i transmissivity including the lenses and the filter, G is the camera electronic gain [e−/DN], h is the Planck constant [J/Hz], c is the speed of light [m/s] and Ci is the camera channel scaling factor.
The expected K\(_{x,y}\) pixel count rate [DN/s] can be calculated with the camera responsivity function. For point sources (reference stars), the star image integrated DNs, over the detected PSF:
where E(\(\lambda \)) is the spectral irradiance of the point source at the camera entrance aperture [W/m2/nm]. In this case, the collected radiation depends only on the area of the entrance pupil (aperture) of the optical system. For extended targets, the response of each pixel:
where: c\(_{px}\) is the camera constant [sr], A\(_{px}\) is the pixel area [m2], f\(_{opt}\) is the camera focal length [m], and L(\(\lambda \)) is the radiance of the target surface in the camera direction [W/m2/sr/nm]. In the extended target case, the solid angle of the imaging system must be considered.
Theoretically, if all input parameters of the Si(\(\lambda \)) camera responsivity function are accurately known, the Ci scaling factor is 1.0. However, parameters like quantum efficiency, gain, or camera transmissions carry some uncertainty. To account for these errors, the Ci scaling factors are calculated by known calibration targets:
Where: Kobs is the observed count rate on the calibration target. Kexp is the expected count rate on the calibration target. In the case of the Dawn FCs, the Vega HST standard irradiance was used as the reference source for the Ci scaling factor calculation (See Fig. 22).

DAWN FC1 and FC2 Vega observation response compared to HST Vega reference (Bohlin and Gilliland 2004)
Having the calibration target reference spectrum and the Kobs calibration target response, the Ci scaling factors and the Si(\(\lambda \)) (corrected) camera responsivity functions are determined. Knowing the camera responsivity functions, the calibration factors can be calculated for a fixed reference wavelength in case of any target spectral distribution. Using the previously (Schröder et al. 2013) determined FC reference wavelengths for Solar illuminated surfaces, with a flat white spectral response, the calibration factors are calculated. (Table 7).
In general, the new calibration factors are slightly higher than the old ones since the newly applied corrections remove the parasitic flux from the images through the improved stray light correction. Certainly, the improvement is colour-dependent since the ghost flux varies from filter to filter.
6 Conclusions
The calibration of the Dawn Framing Camera improves significantly when considering the in-flight calibration measurements obtained after 2017 and the stray-light laboratory experiments using the spare cameras. Moreover, our measurements and computations confirm that the in-field stray light has a major influence on the radiometric accuracy and radiometric uniformity of the image plane. We presented a rigorous analysis of the in-field stray-light sources and implemented a scene-dependent correction method. This procedure, together with the revised radiometric factors and the revised flat correction, enables high radiometric accuracies of the FC data. Especially the uncertainties of the colour data of Vesta and Ceres improve (Fig. 23), leading to a good agreement between ground-based and in-flight measurements. The illuminated field of view and the caused stray light has no measurable effect anymore on the reflectance data due to the effective ghost removal.

Nearly global average spectra of Ceres based on HAMO data compared to a ground-based spectrum of the SMASS program (Binzel et al. 2001). The dashed spectrum (red) is derived by using the 2012 calibration, while the solid spectrum (blue) is based on the current calibration. Error bars were determined by performing repeated measurements of the same Cerean surface areas at different times (Nathues et al. 2022)
The newly calibrated level 1c image data also enable enhancements of all colour cubes of Vesta and Ceres due to the improved full-field radiometric homogeneity of the input data. With these stray-light corrected level 1c images, the seams in the mosaics weaken, and thus, higher-intensity mosaic stretching is possible (Fig. 24).

Global Ceres false-colour mosaic (RGB) computed using HAMO orbit FC colour data (Nathues et al. 2022)
In summary, the revised calibration of Dawn Framing Camera images leads to distinct improvements in the colour data of Vesta and Ceres, while improvements in the clear filter imagery, as expected, are minor. Thus, for any in-depth analysis of FC colour data, the use of level 1c data instead of level 1b data is strongly recommended.
Data Availability
The Framing Camera and VIR data are available through the PDS Small Bodies Node website (http://pds-smallbodies.astro.umd.edu/).
References
Binzel RP, Harris AW, Bus SJ et al. (2001) Spectral properties of near-Earth objects: Palomar and IRTF results for 48 objects including spacecraft targets (9969) Braille and (10302) 1989 ML. Icarus 151(2):139–149. https://doi.org/10.1006/icar.2001.6613
Bohlin RC, Gilliland RL (2004) Hubble Space Telescope absolute spectrophotometry of Vega from the far-ultraviolet to the infrared. Astron J 127(6):3508. https://doi.org/10.1086/420715
Hapke B (2012) Theory of reflectance and emittance spectroscopy, 2nd edn. Cambridge University Press, Cambridge. https://doi.org/10.1017/CBO9781139025683
Høg E, Fabricius C, Makarov VV et al. (2000) The Tycho-2 catalogue of the 2.5 million brightest stars. Astron Astrophys 355:L27–L30
Kovacs G, Sierks H, Nathues A et al. (2013) Stray light calibration of the Dawn Framing Camera. In: Meynart R, Neeck SP, Shimoda H (eds) Proc. SPIE 8889, Sensors, systems, and next-generation satellites XVII, vol 888912. https://doi.org/10.1117/12.2030584
Magrin S, La Forgia F, Da Deppo V et al. (2015) Pre-hibernation performances of the OSIRIS cameras onboard the Rosetta spacecraft. Astron Astrophys 574:A123. https://doi.org/10.1051/0004-6361/201423830
Nathues A, Hoffmann M, Schmedemann N et al. (2022) Brine residues and organics in the Urvara basin on Ceres. Nat Commun 13(1):927. https://doi.org/10.1038/s41467-022-28570-8
Russell CT, Raymond CA (2011) The Dawn mission to Vesta and Ceres. Space Sci Rev 163(1-4):3–23. https://doi.org/10.1007/s11214-011-9836-2. URL https://link.springer.com/journal/11214/volumes-and-issues/163-1
Ruyten W (1999) Smear correction for frame transfer charge-coupled-device cameras. Opt Lett 24(13):878–880. https://doi.org/10.1364/OL.24.000878
Schröder S, Maue T, Gutiérrez Marqués P et al. (2013) In-flight calibration of the dawn framing camera. Icarus 226(2):1304–1317. https://doi.org/10.1016/j.icarus.2013.07.036
Schröder S, Mottola S, Matz KD et al. (2014) In-flight calibration of the Dawn Framing Camera II: flat fields and stray light correction. Icarus 234:99–108. https://doi.org/10.1016/j.icarus.2014.02.018
Sierks H, Keller HU, Jaumann R et al. (2011) The Dawn Framing Camera. Space Sci Rev 163(1-4):263–328. https://doi.org/10.1007/s11214-011-9745-4
Thomson-CFS (1999). TH7888 area array CCD image sensor. Data sheet
Yoon HW, Kacker RN (2015) Guidelines for radiometric calibration of electro-optical instruments for remote sensing. Tech. Rep. https://doi.org/10.6028/NIST.HB.157
Acknowledgements
The authors thank all members of the Dawn Framing Camera team for their devotion and efforts in making the mission fruitful and for their valuable discussion on the specifications, design, and operations of the instrument. Also, we thank the Dawn mission team for the development, cruise, orbital insertion, and operations of the Dawn spacecraft at Vesta and Ceres.
Funding
Open Access funding enabled and organized by Projekt DEAL.
Author information
Authors and Affiliations
Contributions
GK contributed to the Dawn FC ground calibration and the latest in-flight calibration data analysis, he created and implemented the extended calibration pipeline algorithms, including stray light removal, flat field correction, and radiometric calibration. He contributed to the layout and drafting of the manuscript. AN contributed to the Dawn scientific planning and operations and also to the scientific data analysis, including asteroid surface mapping and global mosaic generation. He also contributed to the drafting of the manuscript. HS contributed to the Dawn mission’s overall planning, ground calibration, scientific planning, and operations, reviewing the original calibration pipeline and making intellectual contributions to text/revisions. PGM contributed to the Dawn FC ground calibration, he created and implemented the original calibration pipeline algorithms. He also contributed to the Dawn scientific planning and operations, MH contributed to the Dawn scientific planning and operations, and also to the scientific data analysis, including global mosaic generation. GST contributed to the Dawn scientific planning and operations and also to the scientific data analysis, including global mosaic generation and the Vesta and Ceres reflectivity spectral analysis.
Corresponding author
Ethics declarations
Competing Interests
The authors declare that they have no conflict of interest
Additional information
Publisher’s Note
Springer Nature remains neutral with regard to jurisdictional claims in published maps and institutional affiliations.
Note by the Editor: This is a Special Communication. In addition to invited review papers and topical collections, Space Science Reviews publishes unsolicited Special Communications. These are papers linked to an earlier topical volume/collection, report-type papers, or timely papers dealing with a strong space-science-technology combination (such papers summarize the science and technology of an instrument or mission in one paper).
Rights and permissions
Open Access This article is licensed under a Creative Commons Attribution 4.0 International License, which permits use, sharing, adaptation, distribution and reproduction in any medium or format, as long as you give appropriate credit to the original author(s) and the source, provide a link to the Creative Commons licence, and indicate if changes were made. The images or other third party material in this article are included in the article’s Creative Commons licence, unless indicated otherwise in a credit line to the material. If material is not included in the article’s Creative Commons licence and your intended use is not permitted by statutory regulation or exceeds the permitted use, you will need to obtain permission directly from the copyright holder. To view a copy of this licence, visit http://creativecommons.org/licenses/by/4.0/.
About this article

Cite this article
Kovács, G., Nathues, A., Sierks, H. et al. The Scientific Calibration of the Dawn Framing Camera. Space Sci Rev 220, 4 (2024). https://doi.org/10.1007/s11214-023-01039-w
Received:
Accepted:
Published:
DOI: https://doi.org/10.1007/s11214-023-01039-w