
Abstract
A better understanding of the processes involved in the energy transport across the solar atmosphere (e.g., jets, waves) demands more effort towards the observations. Hence, existing instruments may need to be upgraded to gain additional capabilities. To this effect, we conceive an upgrade for the HELioseismic Large Regions Interferometric DEvice (HELLRIDE) instrument at Vacuum Tower Telescope (VTT) to enable the recording of the magnetograms. We present the instrumentation aspects of this development consisting of integrating a liquid crystal-based dual-beam polarimeter with the existing instrument, compatible new hardware and software with the improved operating scheme, and the first observations to verify its functionality. The new HELLRIDE now observes a field of view of \(90^{\prime \prime } \times 90^{\prime \prime }\) in four spectral lines, two chromospheric spectral lines in spectroscopy mode and two photospheric spectral lines in spectropolarimetry mode, with a cadence of 40 seconds. The increased complexity of the system, as well as the data, calls for the creation of a rigorous data processing pipeline, which is currently under development.
1 Introduction
The energy transport in the solar atmosphere is a complex process that involves plasma–magnetic field interaction and the associated solar dynamics. The crucial problem of heating the upper atmosphere has not yet been solved, as there is insufficient reliable observational evidence to pinpoint the real mechanisms involved in this process. One of the mechanisms that we deem necessary to be investigated is the ubiquitous jet-like plasma motions caused by the turbulent magneto-convection (Borrero et al., 2010). From the magnetohydrodynamic and radiation hydrodynamic simulations, it is inferred that they can excite various kinds of waves and dynamically interact with the upper atmosphere (Kitiashvili, 2014). They propagate along the magnetic field lines and transport the energy into the upper layers, and if even \(0.1\%\) of the kinetic energy of these jets is converted to the thermal energy in the upper atmosphere, it is sufficient to explain the chromospheric and coronal heating (Leitner et al., 2017). In this context, information about the different layers of the solar atmosphere is in a great demand. Foremost, we need high cadence Dopplergrams (line-of-sight velocity information) and 3D magnetic field maps to observe the interaction between the small-scale jets, the wave excitation, and the magnetic field.
The HELioseismic Large Regions Interferometric DEvice (HELLRIDE) is a dual Fabry-Pérot etalon-based tunable filtergraph at the back-end of the Vacuum Tower Telescope (VTT) of Teide Observatory. The etalons operate in the collimated beam and produce narrowband spectral images in a single imaging channel. Its salient feature is to observe a relatively large field of view (FoV) of \(100^{\prime \prime} \times 100^{\prime \prime}\) in multiple spectral lines with high cadence. Such observations are made possible by a fast-moving filter matrix that can accommodate up to 27 pre-filters corresponding to the spectral lines. In the previous experiments, 16 spectral lines were observed with a cadence of 60 seconds. This resulted in Dopplergrams with high resolution, both in terms of time and height in the solar atmosphere (Staiger, 2011).
The new development is aimed at enabling the production of magnetic field maps with HELLRIDE. These can be obtained from analyzing the variation of the polarization signals across the observed spectral line. Such polarized spectral line profiles can be obtained by appending a polarimeter to the existing spectrometer. The instruments capable of such measurements do exist at all major solar telescopes viz., CRISP at SST (Scharmer et al., 2008), GFPI at GREGOR (Puschmann et al., 2012), and VIS at GST (Cao et al., 2010). We design the new instrument while preserving one of the salient features of HELLRIDE, i.e., relatively large FoV.
2 Design
We developed the design while keeping the core setup of dual-etalons and filter matrix intact. The features of interest are:
-
High cadence The possibility of high-speed observations still exists, however, the requirement of magnetograms with certain sensitivity naturally affects the cadence.
-
Multiple spectral lines Capability to observe desired spectral lines in the wavelength range of 530 – 860 nm.
-
Large FoV The relatively large FoV is preserved with the nominal FoV being \(90^{\prime \prime} \times 90^{\prime \prime}\).
Initially, HELLRIDE (Staiger, 2011) was developed in an experimental fashion and also underwent several undocumented modifications. Apart from being a single-channel imaging spectrograph, the instrument suffered from several other drawbacks. The upgrade is devised to address these concerns, and its key outcomes are compared in Table 1.
2.1 Optical Train
The optical path of the old setup was fairly simple with all the components placed in the light beam propagating from the exit mirror of the telescope straight to the detector. The new design consists of three optical channels: two for dual-beam polarimetry and one for a continuum imager (CI). Three identical sCMOS cameras record the data, one for each of the optical channels. New optical components are introduced into the existing optical train to implement the polarimeter and the continuum imager. Consequently, all the optics are re-positioned, and the entire optical train is re-aligned. New hardware electronics, operating software, and control scheme are developed to realize the new capabilities. Figure 1 illustrates the comprehensive system layout.

Schematic (not to scale) of HELLRIDE system with opto-mechanics and controls: black for optics, red for opto-mechanics, dashed blue for electronics, cameras and controllers, and solid blue for the connections related to the control computer.
The telescope focus at F1 provides the image corrected by adaptive optics. This image is transferred to the optics laboratory via relay lenses (L1 and L2) of equal focal length. The focal plane F2 is the input for the instrument. Prior to F2, approximately \(10\%\) of the beam is diverted using a broadband beam-splitter to facilitate continuum imaging (Figure 2). A re-imaging lens (L5) adjusts the image magnification to suit the detector, followed by a neutral density filter and a broadband filter.

Continuum imaging channel of the instrument.
After F2, an interference filter mounted on a filter matrix (Figure 3) transmits the spectral passband around the absorption line of interest. The collimating lens (L3) provides the etalons with the pupil image of appropriate size. The square FoV of \(90^{\prime \prime}\times 90^{\prime \prime}\) corresponds to an incident angle range of \((-0.346^{\circ}, 0.346^{\circ})\) for the collimated beam onto the etalons. After the etalons, a re-imaging lens (L4) scales the image to match the detector pixel scale and the polarimeter (Figure 4). Subsequently, the beam passes through the dual-beam polarimeter to the detectors (Figure 5).

Filter matrix and the subsequent optical train of the instrument.

Etalons of the instrument setup in the collimated beam.

Polarimeter channels of the instrument.
2.2 Filter and Etalons
A maximum of 27 filters can be mounted onto the filter matrix, and one slot is reserved for the light-blocking element. For the installation phase, we have selected four pre-filters allowing observations with spectral lines with wide applicability. These spectral lines are Fe i 617.3 nm, Fe i doublet at 630.2 nm, H\(\alpha \) 656.3 nm, and Ca ii 854.2 nm. The specifications of these filters are listed in Table 2.
Two piezo-tunable air-spaced Fabry-Pérot etalons (ET1, ET2) operating in a collimated beam perform the spectroscopy. One of the etalons (ET1) is refurbished in the following manner to be consistent with the second etalon and to optimize the overall instrument performance.
-
Internal surfaces are re-coated with new high reflectivity coating with \(R\sim 95\pm 2.5\%\) over 530 – 860 nm. Consequently, a suitable anti-reflection coating is also applied to the outer surfaces.
-
The wedging on the outer surfaces is removed.
-
Spacing between the plates is optimized to further reduce the off-band parasitic light (Cavallini, 2006).
Table 3 summarizes the final specifications of the etalons.
2.3 Polarimetry
For the polarimeter, the choices of modulator and analyzer are made to preserve the large FoV of the existing instrument. Two Liquid Crystal Variable Retarders (LCVRs) are used for implementing the polarimetric modulation as they offer sufficiently fast temporal modulation as well as large clear apertures. LCVRs consist of birefringent material, the retardance of which can be changed by applying the electric field. The response time, i.e., the duration elapsed from the application of voltage to LCVR reaching \(90\%\) of the intended retardance, is between a few milliseconds and a few tens of milliseconds, depending on the voltages and the environmental conditions. By selecting the appropriate combination of the voltages, fast changes in the retardance and hence fast modulation can be achieved.
A dielectric-coated broadband polarizing beam-splitter (PBS) is used as the polarization analyzer. The PBS spatially separates two orthogonal states of linear polarization. Two high-contrast nanoparticle film polarizers (extinction ratio \(>10^{5}\)) with fast axes matching those of the polarizing beam-splitter are placed at its exit ports as a typical off-the-shelf PBS with dielectric coating does not have sufficiently high extinction ratio to achieve high polarimetric efficiencies. The schematic of the polarimeter is illustrated in Figure 6. Two detectors are placed in the two channels of the analyzer.

Schematic of the polarimeter with representation of polarization of the beam.
A four-step balanced modulation scheme is adopted to achieve a high cadence (del Toro Iniesta and Collados, 2000). The required LCVR retardances to execute said modulation scheme are given in Table 4.
Three scientific CMOS (sCMOS) detectors of the same make and model (Ximea CB042MG-GP) are used for the three optical channels. The resulting plate scale is \(0.08^{\prime \prime}\)/pixel, whereas the diffraction-limited resolution for the lowest wavelength of operation is about \(0.19^{\prime \prime}\). The typical image acquisition parameter for the camera is to record the frames of size 1280×1280, at a rate of 40 fps, with a global shutter and a nominal exposure time of 10 ms. This provides ample time for the LCVRs to settle after tuning. The exposure time can be increased to achieve a higher duty cycle at the expense of the polarimetric efficiency.
2.4 Controls & Software
The following measures have been implemented to streamline the instrument controls, accommodate the demands of the new polarimeter, and simplify the software development:
-
All the controllers have been connected to the computer via the same interface.
-
A new hardware communication line is established between the instrument control computer and one of the telescope’s controllers to operate the instrument calibration unit (ICU) and some necessary modules of the telescope.
-
A custom hardware unit replicates the Sync output pulse from the LCVR controller to simultaneously trigger the three cameras of the instrument when the LCVR voltages are changed (i.e., when the modulation state is switched).
New control software is developed in C++ programming language using the Qt framework for the graphical user interface (GUI). A screenshot of the GUI is shown in Figure 7. The object-oriented approach enables operating the numerous controllers of HELLRIDE by defining only a few modules. Two readable text files store the necessary settings: (i) core settings completely define the state of the system, which can be modified to tune the instrument in case a system optimization is required, and (ii) observation settings define properties for an observational run (spectral lines of interest, spectral sampling, etc.) This allows the novice observer to predefine the observing sequences that can be executed automatically and repeatedly and, if needed, allows the advanced observer to modify the observing sequences in real time.

A screenshot of HELLRIDE control software GUI.
3 Installation and Operation
A series of component characterizations are carried out to make the instrument observation-ready. Four pre-filters listed in Table 2 are installed onto the filter matrix. For each interference pre-filter (i.e., the spectral range of interest), the following parameters are determined.
-
Etalons’ tuned positions for the spectral line core or the center of the spectral band.
-
Using the target plate image, the position of L4 for the best focus on the polarimeter detector planes.
-
LCVR retardance vs. voltage characteristics curves. The results are shown in Figure 8, along with the best fit with the corresponding empirical function (Saleh and Teich, 2019).
Figure 8 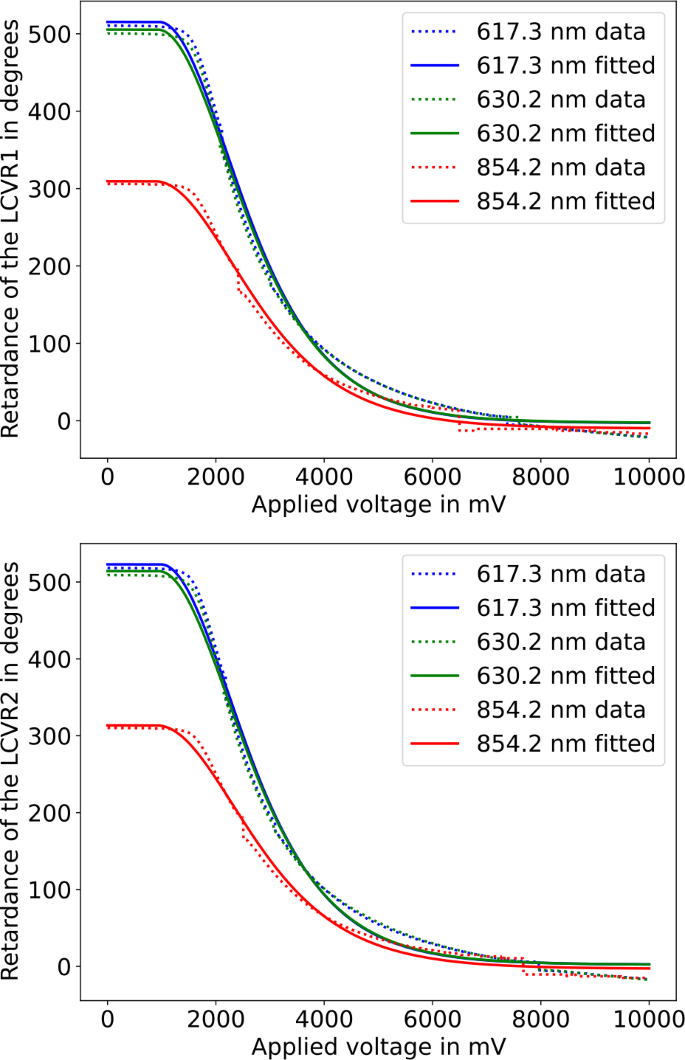
Retardances vs. voltage characteristics of the two LCVRs for different wavelengths of incidence beam. For the illustrative purposes, they are fitted with LCVR retardance equation.

Following the characterization, the instrument parameters corresponding to each spectral line viz., voltages for executing the desired modulation scheme and etalon tuned positions, are written to the relevant settings file. Then, the instrument is ready for the observations. The dataset required to formulate a viable observational run consists of the following acquisitions:
-
Darks data represents bias and signal induced by the thermal electrons.
-
Flats data represents template spectral profile, pre-filter profile and other artifacts in the imaging system.
-
Target plate data are the images of a USAF target that are used to align the images from all the channels and enable the estimation of the image quality.
-
Polarimetric calibration data are the frames recorded while using input light beam with known state of polarization.
-
Science data are the frames recorded while observing the region of interest (RoI) on the Sun.
Table 5 represents the specifications for an observing sequence taken during the technical campaign. The sunspots of the active region AR 12957 were observed on 02 March 2022.
4 Results and Future Plan
After successfully upgrading HELLRIDE, we tested the instrument during a technical campaign. During this test campaign, the weather conditions allowed for a short observing run only with adverse seeing conditions. The four spectral lines specified in Section 2.2 are observed during this run. The two photospheric lines (Fe i 617.3 nm and Fe i 630.2 nm doublet) are observed in the spectropolarimetric mode, and the two chromospheric lines (H\(\alpha \) and Ca ii 854.2 nm) are observed in the spectroscopic mode.
Figure 9 displays the reference image from the continuum channel. Such images are taken simultaneously with the images from the polarimeter channels. Figure 10 displays a sample image sliced from the H\(\alpha \) spectral line core, from one of the polarimeter channels. Figure 11 displays the Stokes maps of the RoI from the Fe I 617.3 nm spectral line, along with Stokes spectral profiles from selected areas in the RoI. The images are presented only for one of the polarimeter channels. Though the profiles are noisy, the Stokes maps generated by integrating over the spectral line wing show discernible signals.

Image of the sunspots of AR 12975 from the continuum channel.

Image of the sunspots of AR 12975 taken at the H\(\alpha \) line core in spectroscopy mode.

Stokes map of the sunspots of AR 12975 from the spectropolarimetric observations of the Fe I 617.3 nm spectral line.
For the continuum data, dark subtraction and flat-fielding (FF) corrections are applied. For the H\(\alpha \) spectroscopic data, dark subtraction, FF corrections, and systematic spectral shift across the FoV are corrected. For the spectropolarimetric data of Fe I 617.3 nm line, dark correction, FF correction, spectral line shift correction, and polarimetric demodulation are applied. The modulation matrix is computed from the polarimetric calibration data. For all the data, frames acquired for the purposes of signal accumulation are simply added.
Due to the nature and volume of the data, a dedicated automated pipeline is required for the processing. The data above has not also been processed for the following:
-
Co-aligning the frames using the continuum images.
-
Combining the data from the two polarimetry channels.
-
Instrumental polarization modeling and corrections.
We are currently developing the data processing pipeline to produce science-ready data. This would also enable an evaluation of the instrument’s true performance. Subsequently, full Stokes inversions may be applied to extract information on magnetic fields and other physical parameters.
As part of the documentation, a quick start guide for the instrument operation and a comprehensive manual are also being prepared. They will be made available online to the user community for detailed reference.
5 Summary
The new HELLRIDE instrument at VTT is now capable of high cadence spectroscopic and spectropolarimetric observations that enable the studies of fast events in the solar atmosphere with additional details. We have upgraded the existing system with a dual-beam polarimeter and a continuum channel. Consequently, we have upgraded the control and acquisition computer, interfaces, and control software. We have successfully acquired the first light spectropolarimetric data, which is to be used for the data pipeline development and subsequent science verification. In the near future, an automated data processing pipeline is expected to produce science-ready data and is currently under development.
References
Borrero, J.M., Martínez-Pillet, V., Schlichenmaier, R., Solanki, S.K., Bonet, J.A., del Toro Iniesta, J.C., Schmidt, W., Barthol, P., Gandorfer, A., Domingo, V., Knölker, M.: 2010, Supersonic magnetic upflows in granular cells observed with SUNRISE/IMAX. Astrophys. J. 723(2), L144. DOI.
Cao, W., Gorceix, N., Coulter, R., Ahn, K., Rimmele, T.R., Goode, P.R.: 2010, Scientific instrumentation for the 1.6 m New Solar Telescope in Big Bear. Astron. Nachr. 331(6), 636. DOI.
Cavallini, F.: 2006, IBIS: a new post-focus instrument for solar imaging spectroscopy. Solar Phys. 236(2), 415. DOI.
del Toro Iniesta, J.C., Collados, M.: 2000, Optimum modulation and demodulation matrices for solar polarimetry. Appl. Opt. 39(10), 1637. DOI.
Kitiashvili, I.N.: 2014, Spectro-polarimetric properties of small-scale plasma eruptions driven by magnetic vortex tubes. Publ. Astron. Soc. Japan 66(SP1), S8. DOI.
Leitner, P., Lemmerer, B., Hanslmeier, A., Zaqarashvili, T., Veronig, A., Grimm-Strele, H., Muthsam, H.J.: 2017, Structure of the solar photosphere studied from the radiation hydrodynamics code ANTARES. Astrophys. Space Sci. 362(9), 181. DOI.
Puschmann, K.G., Balthasar, H., Beck, C., Louis, R.E., Popow, E., Seelemann, T., Volkmer, R., Woche, M., Denker, C.: 2012, The GREGOR Fabry-Perot Interferometer: Status Report and Prospects. In: Ground-based and Airborne Instrumentation for Astronomy IV 8446, 844679. DOI. ISBN 9780819491473.
Saleh, B.E.A., Teich, M.C.: 2019, Fundamentals of Photonics, 3rd edn. 997. ISBN 9781119506874.
Scharmer, G.B., Narayan, G., Hillberg, T., de la Cruz Rodriguez, J., Löfdahl, M.G., Kiselman, D., Sütterlin, P., van Noort, M., Lagg, A.: 2008, CRISP spectropolarimetric imaging of penumbral fine structure. Astrophys. J. 689(1), L69. DOI.
Staiger, J.: 2011, A multiline spectrometer for the analysis of solar atmospheric oscillations and flows at the VTT, Tenerife. Astron. Astrophys. 535, A83. DOI.
Acknowledgments
This work has been carried out as a part of the project “Jets in the solar atmosphere”, funded by the Deutsche Forschungsgemeinschaft (DFG, German Research Foundation) – Projektnummer 407727365. The authors are especially grateful to Dr. Dirk Soltau for his support during the HELLRIDE technical and observing campaigns at VTT. The authors also thank Dr. Horst Balthasar for his helpful comments towards this paper. The authors thank the anonymous reviewer for the detailed comments which improved the manuscript.
Funding
Open Access funding enabled and organized by Projekt DEAL.
Author information
Authors and Affiliations
Contributions
H. Pruthvi focused on the technical aspects of the work. Role: designed and developed the instrument as per the scientific requirements, observing campaigns for the instrument installation, data acquisition, data processing, and preparation of the manuscript. M. Roth focused on the scientific aspects of the work. Role: principal investigator of the project, drawn the scientific requirements and specifications for the instrument, secured the funding, resource management, secured the telescope time, and reviewed the manuscript.
Corresponding author
Ethics declarations
Competing interests
The authors declare no competing interests.
Additional information
Publisher’s Note
Springer Nature remains neutral with regard to jurisdictional claims in published maps and institutional affiliations.
Rights and permissions
Open Access This article is licensed under a Creative Commons Attribution 4.0 International License, which permits use, sharing, adaptation, distribution and reproduction in any medium or format, as long as you give appropriate credit to the original author(s) and the source, provide a link to the Creative Commons licence, and indicate if changes were made. The images or other third party material in this article are included in the article’s Creative Commons licence, unless indicated otherwise in a credit line to the material. If material is not included in the article’s Creative Commons licence and your intended use is not permitted by statutory regulation or exceeds the permitted use, you will need to obtain permission directly from the copyright holder. To view a copy of this licence, visit http://creativecommons.org/licenses/by/4.0/.
About this article

Cite this article
Pruthvi, H., Roth, M. The New HELLRIDE at the Vacuum Tower Telescope. Sol Phys 298, 41 (2023). https://doi.org/10.1007/s11207-023-02138-1
Received:
Accepted:
Published:
DOI: https://doi.org/10.1007/s11207-023-02138-1