
Abstract
The Cryogenic Near-Infrared Spectro-Polarimeter (Cryo-NIRSP) is a combination slit-based spectrograph and context-imaging instrument designed and built for the National Science Foundation’s Daniel K. Inouye Solar Telescope (DKIST). It is optimized for polarimetric observations of spectral band-passes between 1 and 5 microns, which makes it uniquely suited for polarimetric observations of the solar corona, while also enabling access to other important infrared diagnostics such as the CO fundamental band at 4.6 microns. Integration, testing, and commissioning occurred between 2019 and 2020, and it is now conducting science experiments as part of DKIST early operations. In this article, we discuss its science mission, the requirements driving the design, its fabrication and installation, current capabilities, and the first science data.
1 Introduction
The Daniel K. Inouye Solar Telescope (DKIST: Rimmele et al., 2020) is the only 4-m or larger solar telescope and coronagraph in the world. It enables observations of the Sun with unprecedented spatial resolution and sensitivity. It has sufficient aperture and control of instrumental errors to achieve the highest precision polarimetric accuracy (Harrington et al., 2023), and it is located at a site offering excellent coronal observing conditions. These are essential elements for measuring the Gauss-level magnetic fields that dominate the solar coronal plasma. DKIST is the only unobstructed 4-m or larger off-axis optical telescope, thereby benefiting from many related optical and opto-mechanical advantages (Kuhn and Hawley, 1999). The classical Lyot coronagraphic and unobstructed off-axis optical design of DKIST further reduces scattered light and improves high-contrast, near-limb, and general off-limb coronal observations. This makes DKIST the best facility for optical studies of the smallest and faintest features on the Sun and off the limb. The Cryogenic Near-Infrared Spectro-Polarimeter (Cryo-NIRSP) instrument described here has been designed and built at the Institute for Astronomy (IfA) of the University of Hawai´i (UH) to take advantage of the unique properties of DKIST for observing the corona and its magnetic fields, as well as the infrared (IR) properties of the solar photosphere and chromosphere.
The implicit case for developing solar IR instruments and a large solar telescope was advanced by a (then) new generation of IR-array-detector solar instruments and the first associated scientific meetings on these subjects in the early 1990s (Rabin et al., 1991; McPherson, Lin, and Kuhn, 1992; Rabin, Jefferies, and Lindsey, 1994; Kuhn and Penn, 1995; Beckers et al., 1995). Explicitly, Penn (2014) laid out the benefits of infrared observations made available by DKIST: better atmospheric seeing, less atmospheric scattering, less instrumental scattering, less instrumental polarization, and increased Zeeman resolution are the main advantages. Indeed, many current ground-based solar telescopes now have IR imaging, polarimetry, or spectroscopy capabilities (see review by Iglesias and Feller, 2019). Thus, the importance of measuring solar magnetic fields drives the need for new spectropolarimetric instrumentation.
IR observations beyond about 2 μm must contend with a large environmental thermal background. Figure 1 shows how routine mid-IR coronal and high-contrast solar-disk observations require cooling the Cryo-NIRSP optics in front of the cryogenic array detector. The solar disk in the mid-IR (2.5 to 5 μm) overcomes this background with adequate bandpass filtering, and, for example, the National Solar Observatory (NSO) Kitt Peak mid-IR imager (Uitenbroek, Noyes, and Rabin, 1994) was uniquely available for many years for photospheric studies. Mid-IR coronal measurements using eclipse instruments with warm optics were sufficient for some purposes, for example in lunar-shadow-following aircraft in the late 1990s (Kuhn et al., 1999). Currently, Cryo-NIRSP and the Cryogenic Infrared Spectrograph (CYRA: Yang et al., 2020) at the Goode Solar Telescope are the only cooled low-background mid-IR solar spectropolarimeters available to the community. Meanwhile, the Airborne Infrared Spectrometer (AIR-Spec: Samra et al., 2022) experiment targets mid-IR spectroscopy during solar eclipses.

The Cryo-NIRSP instrument is sensitive out to 5 μm because its optics are cooled to below 150 K. The solid blue curve represents the mean photospheric flux, modeled as a blackbody, detected by a single pixel in the Cryo-NIRSP wide-slit configuration, assuming 10% end-to-end throughput. The green dash-dotted line is representative of coronal intensities off-limb. The dashed red line shows the case for a warm room-temperature spectrograph, i.e. with only a cooled detector, assuming a foreground emissivity of 0.5 over a field-of-view set by the detector’s numerical aperture. We increase the spectral bandwidth in this case to \(\lambda /100\) to mimic filtered undispersed thermal background, as compared to the \(\lambda /250{,}000\) designed dispersion of the science signal. The two black curves illustrate the case of a cryogenically cooled spectrograph with thermal emission dominated by upstream optics, here modeled using 12 optics with two different emissivity values. Coronal observations below about 2.5 μm are dominated by instrument thermal backgrounds without a cooled spectrograph.
Cryo-NIRSP is one of the five first-generation instruments at the DKIST – the others being the Visible Broadband Imager (VBI: Wöger et al., 2021), the Visible Spectro-Polarimeter (ViSP: de Wijn et al., 2022), the Diffraction Limited Near Infrared Spectro-Polarimeter (DL-NIRSP: Jaeggli et al., 2022) and the Visible Tunable Filter (VTF: von der Lühe et al., 2023). As the name suggests, Cryo-NIRSP is cooled to below 77 K to minimize the thermal background in the observations. It has the widest field-of-view of any DKIST instrument, features versatile operating modes, and provides a large dynamic range to allow for on-disk and coronal observations out to 1.5 solar radii. The near-limb observations can be executed with the DKIST limb occulter(s) deployed to take full advantage of the coronagraphic capabilities of the facility. Cryo-NIRSP is designed as a single-slit echelle spectrograph to efficiently cover the full five-arcmin DKIST field-of-view and to measure the full Stokes-polarization parameters of spectral lines at wavelengths from 1 to 5 μm. At this time it does not observe simultaneously with the other DKIST instruments, as a deployable fold mirror in the Facility Instrument Distribution Optics (FIDO) redirects all light exclusively to Cryo-NIRSP. Consequently, the Cryo-NIRSP spectrograph needs its own imager to provide context for the observed slit position, and all data will be seeing-limited as there is no wavefront correction from the DKIST adaptive-optic (AO) systems available. Even though simple tip/tilt correction would be highly beneficial for infrared observations with Cryo-NIRSP, the implementation of this feature was beyond the scope of the DKIST construction phase. It would have required either a direct feedback loop from the IR cameras to the DKIST AO system, or a FIDO beam-splitter that would direct infrared light to Cryo-NIRSP while sending visible light to the AO system. The Cryo-NIRSP camera system is too slow to provide the necessary feedback for tip/tilt correction. Thus, replacing the FIDO fold mirror with a beamsplitter is the only option to achieve wavefront correction and concurrent observations with other instruments. This upgrade was identified as being a high priority and is currently being worked on. These limitations were considered in the design of the instrument and are in line with the proposed science-use cases. As implemented, Cryo-NIRSP provides unprecedented, sensitive measurements of the coronal magnetic fields, and it will be a flexible tool to explore the short- to mid-infrared region of the solar spectrum.
1.1 Science-Use Cases
1.1.1 Coronal Magnetic Fields
The possibility of measuring coronal magnetic fields from the Zeeman-effect-induced circular polarization (Stokes-\(V\)) has been a generational goal for understanding the Sun’s outer atmosphere (see review by Casini, White, and Judge, 2017). In one of the first quantitative efforts, Harvey (1969) used the coronal 530.3 nm Fe xiv line with single-pixel arcminute-scale spatial resolution. This pioneering measurement achieved noise levels of a few Gauss. While linear coronal-line polarimetry was being achieved in the 1970s using the visible-wavelength green line (Mickey, 1973), circular-polarization measurements required a new generation of IR detectors and relatively bright coronal IR emission lines. Sensitive IR-array measurements have observed the coronal Fe xiii 1.075 μm line with Stokes-\(V\) sensitivities below 1 G and produced the first recognizable coronal magnetogram, albeit with relatively poor spatial and temporal resolution compared to photospheric magnetograms (Lin, Kuhn, and Coulter, 2004). These observations demonstrated the control of scattered light available in an off-axis telescope with photon-noise-dominated Stokes-\(V\) polarization sensitivity at the \(10^{-5}\) level.
One of the main Cryo-NIRSP goals is to routinely and sensitively measure coronal intensities, velocities, densities, and magnetic fields with unprecedented temporal, spatial, and polarimetric resolution. This will advance our ability to develop and test our understanding of complex solar phenomena such as coronal heating, flares, coronal mass ejections, and the solar wind. As shown in Table 1, the initial main diagnostic lines for coronal observations include the Fe xiii line pair near 1080 nm, the Si x 1430 nm line, and the Si ix 3934 nm line. These are prioritized over other interesting and un-explored coronal IR lines (review by Del Zanna and DeLuca, 2018) as they provide enhanced Zeeman sensitivity based on their brightnesses and longer wavelengths. Meanwhile, each line can also be strongly linearly polarized; however, density-dependent behavior is unique to each line, as discussed by Schad and Dima (2020).
1.1.2 The Cool Chromosphere
Another key task for Cryo-NIRSP is acquiring infrared observations of the solar chromosphere, in particular to study the puzzling formation of molecular carbon monoxide in the coolest pockets of the atmosphere. The strongest lines of CO are found in the fundamental vibration–rotation band that forms near 4.7 μm, and their signatures can be found in the majority of photospheric phenomena. They have been found to be tightly dependent upon atmospheric dynamics and perhaps non-equilibrium chemistry (Noyes and Hall, 1972; Uitenbroek, 2000; Asensio Ramos et al., 2003). Using Atacama Large Millimeter/submillimeter Array (ALMA) observations, da Silva Santos et al. (2020) identified chromospheric material similarly cooled to low temperatures below 4000 K that may be related to previously observed CO “clouds”; however routine CO observations have until now not been available at high resolution. Cryo-NIRSP CO observations, in conjunction with data from other DKIST instruments, will address fundamental questions on the chromospheric temperature and velocity structure, chromospheric heating dynamics, and spicule physics.
1.1.3 The DKIST Critical Science Plan
The above two use-case areas represent only a very high-level summary of potential use cases. During the DKIST construction proposal phase, the main science objectives and use cases were determined and captured in the Science Requirement Document (SRD: Rimmele, 2005). These requirements then helped in guiding and selecting the final suite of first-generation instrumentation. For Cryo-NIRSP this resulted in the instrument-science requirements shown in Table 2. The DKIST science working group has established a more refined selection of use cases, and we refer the interested reader to the published Critical Science Plan (Rast et al., 2021). Meanwhile, Table 1 provides an overview of the initial main diagnostics for Cryo-NIRSP already supported by special-purpose filters.
2 Design
The Cryo-NIRSP was installed in the coudé laboratory of DKIST next to the other first-generation instruments. The primary initial-design considerations for the instrument are described by Fehlmann et al. (2016). We divide the system into three subsystems: i) the feed optics, ii) the diffraction-grating-based spectropolarimeter (or spectrograph), and iii) the context imager. In contrast to the feed optics, the spectrograph and context imager are both cooled to below liquid-nitrogen temperatures. This requires relatively large cryostats, which need to hold a vacuum and warrant special considerations when aligning the optical components. Below, we discuss the optical design of each subsystem.
2.1 Feed Optics
Figure 3 provides a ray-trace diagram of the feed-optics subsystem that is responsible for relaying and modulating the DKIST optical beam that then interfaces with the spectrograph and context imager. The mirrors M9 and M9a are part of the DKIST coudé optics (see Section 4.5 of Rimmele et al., 2020). M9a is a flat fold mirror that redirects the almost collimated telescope beam onto the Cryo-NIRSP beam-steering mirror (FM1). Located at a pupil image, this slightly convex spherical mirror is motorized to precisely control the tip and tilt angles of the reflected beam. The convexity of the steering mirror allows us to create a telecentric image while keeping the optic outside the volume occupied by the cryostat. Note the close proximity of FM1 to the cryostat in Figure 2.

Cryo-NIRSP in the coudé laboratory. The spectrograph (SP), the context imager (CI), and the Cryo-NIRSP warm optics are mounted on a common steel frame. The light from the telescope is relayed by the mirrors M7, M8 (not in the picture), and M9 before it is picked-off by M9a and directed towards Cryo-NIRSP. From there, the beam propagates to the field-steering mirror FM1 and then the external imaging mirror FM2. Also in the picture are the DL-NIRSP instrument and the National Solar Observatory Coudé Laboratory Spectropolarimeter (NCSP), which uses the Cryo-NIRSP feed mirrors.
Next in the beam path is an off-axis parabolic mirror (FM2) that forms the image of the telescope field-of-view onto the spectrograph slit plane (SPSP). It also converts the angular changes of the steering mirror into linear translations at the image plane, allowing us to scan the image across the stationary slit and/or the fixed context-imager focal plane (CIFP). The focal ratio at this point is approximately f/18, as dictated by the spectrograph design. FM2 is mounted on a motorized linear stage so we can account for focus changes over the large spectral range of Cryo-NIRSP, especially when introducing and removing transmissive optical elements in the downstream optical path.
After the focus mirror, we have placed a motorized, linear stage with three available positions. In the open position the optical beam passes to the next feed-optics component. The other two positions hold lamps that can be used for calibrations. An IR-Si207 silicon–carbide emitter from Hawkeye Technologies is placed at the focus of an elliptical reflector and provides a fairly uniform infrared illumination of the spectrograph slit. The second light source is a thorium–argon hollow-cathode lamp (Photron Pty Ltd. model P858A) at the focus of another elliptical-reflector segment. This lamp provides a series of spectral emission lines across the full Cryo-NIRSP spectral range (Kerber, Nave, and Sansonetti, 2008).
Cryo-NIRSP is designed to efficiently observe the faint solar corona and thus has a high throughput. In addition, Cryo-NIRSP spatial sampling is coarser in comparison to other DKIST instruments, as it only samples the diffraction limit of the telescope at its longest wavelengths and with its narrow slit. Consequently, for on-disk observations, the flux level is high enough that optical density (OD) filters are required to prevent saturation of the detector. A six-position filter wheel currently can hold two pellicle density filters, two CaF2 substrate density filters, and a wire-grid polarizer. All optics have a 150 mm diameter to accommodate the full 5-arcmin telescope field-of-view. Both pellicles and CaF2 substrates have advantages and disadvantages, and we are still testing both before making a final decision on which ones are the best to use.
We have collaborated with the National Photocolor Corporation to obtain as uniformly stretched pellicles as possible. These 3 μm thick optics eliminate any ghost images from multiple reflections. However, the extreme thinness exacerbates spatial fringing due to thickness non-uniformity, and we have seen up to 100% intensity variations across the large aperture. There is also some noticeable spectral fringing that complicates precisely defining the OD-value at a given wavelength. We use pellicles with aluminum and protected-silver coatings of various densities. The optical power of the solar beam at this location is about 230 W for the 5-arcmin telescope field-of-view. So far, the pellicles with higher OD-values have readily handled this heat load. To our surprise, we experienced multiple failures – crazing and tearing – of protected silver-coated pellicles with an OD-value of about 2 at 1 μm. We will be continuing these pellicle tests so that we might be able to benefit from their use in the future.
As a result of the pellicle issues, we obtained three 10 mm thick, wedged CaF2 substrates with protected-silver coatings of 2.83 OD at 4.666 μm, 3.65 OD at 1.083 μm, and 4.30 OD at 1.083 μm. Figure 4 shows the measured transmission curves of these OD filters. Choosing a mostly reflective protected-silver coating introduces a strong wavelength dependence. More conventional coatings, e.g. nickel–chromium, exhibit a much flatter spectral behavior. These standard coatings are also much more absorptive and would heat up too much when exposed to the full solar flux. The very particular OD-values are tied to initial observing use cases. As the optical density of these coatings changes by about two orders of magnitude from 1 to 5 μm, we will require more OD-filters to optimize observations at different wavelengths. The CaF2 filters show no signs of damage due to the heat load in the beam. The 5-arcmin wedge of the substrate greatly reduces spectral fringing, and spatial non-uniformity is also not an issue. The main disadvantage is the 3% ghost image due to reflection of the uncoated back surface of the filter. For now we want to be able to use these OD-filters across the full wavelength range of Cryo-NIRSP and so must keep the back surface uncoated. In the future, we might switch to dedicated OD-filters for each wavelength and apply an anti-reflective coating to reduce the ghost image.
As a polarimeter, Cryo-NIRSP depends on the polarization analysis and calibration of the full system, i.e. the entire telescope combined with the instrument (Harrington et al., 2023). A crucial component of the polarization measurement on the instrument side is the modulation optic used to temporally sequence between specific combinations of polarized states of the incoming beam. The back side of the feed-optics filter wheel holds the polarization-modulation stage. This comprises two motorized stages. First, a linear stage is used to move the modulator optic in and out of the beam. Secondly, a rotating stage can spin the modulator optic either continuously or in discrete steps (Ferayorni et al., 2014). The nominal polarization-modulator optic itself uses a six MgF2 crystal design to create a super-achromatic elliptical retarder (Harrington and Sueoka, 2018). The gaps between the crystals were filled with a refractive-index-matching oil. During the commissioning of Cryo-NIRSP, the optic started leaking oil and developed an air bubble between the crystals. The bubble would move and change shape when rotating the optic and thus made a stable calibration impossible. We replaced this modulator optic with a unit that showed no signs of an oil leak but uses SiO2 crystals instead of MgF2. This restricted polarimetric observations of Cryo-NIRSP to the 1 to 2.5 μm range during early operations. To regain polarimetric capabilities over the full Cryo-NIRSP wavelength range, Harrington (2023) successfully built large, optically contacted MgF2 retarders. One was recently installed in Cryo-NIRSP.
The final component in the feed optics consists of a motorized, linear translation stage with three positions, coincident with the location marked “BS” in Figure 3. First, an open position passes all light directly into the spectrograph, bypassing the use of the context imager. Secondly, a flat fold mirror redirects the beam towards the context imager exclusively. Thirdly, a beamsplitter made from two uncoated, wedged CaF2 windows allows most of the light to pass into the spectrograph and sends about 3% of the flux to the context imager. The compensating dual-wedge design minimizes additional astigmatism, minimizes chromatic effects, and directs ghost images away from the spectrograph slit and the context imager. Currently, only positions two and three are used for observations, because the beamsplitter design introduced a beam deflection that disallowed co-aligning the spectrograph for both the beamsplitter and open use cases.

Ray trace of the Cryo-NIRSP feed-optics optical design. M9 and M9a are facility mirrors that direct the light towards Cryo-NIRSP. With M9a deployed, neither any of the other DKIST instruments nor the AO system receive any light. The beam-steering mirror FM1 and the second feed mirror FM2 create a scannable image in the spectrograph-slit plane (SPSP) and the context-imager focal plane (CIFP). Lamps can be deployed in the Cryo-NIRSP feed for calibration purposes. Optical-density (OD) filters are used to moderate the solar flux and avoid camera saturation. The polarization modulator (MD) allows for polarimetric observations. The beamsplitter (BS) divides the light into two beams that enter the spectrograph and the context cryostats through the windows spectrograph window (SPW) and contest-imager window (CIW).

The measured transmission of the warm optical-density filters (data courtesy of David Harrington). The vertical dotted lines indicate the target wavelengths for which the OD-value was specified. The G278 filter has an OD-value of 2.83 at CO wavelengths of 4.666 μm. The G358 and G405 filters both are used for observations around 1 μm and have OD-values of 3.65 and 4.30 at 1.083 μm. For the G278 filter we show the measured production run as well as a test run to show the coating behavior over the full Cryo-NIRSP spectral range.
2.2 Spectro-Polarimeter
2.2.1 Design Overview
Figure 5 shows the ray-trace design and as-built images of the internal components of the cryogenically cooled spectrograph. The size of the cryostat is always a main consideration when designing a cryogenic instrument and therefore we made every effort to keep the volume as small as possible. The Cryo-NIRSP spectrograph is based on a concept published by Gil and Simon (1983) and first implemented by Schieffer et al. (2007). The design is fully reflective for high throughput and broad spectral coverage. It uses offaxis conic sections for both the collimator (SM3) and the camera mirror (SM5). The off-axis direction of both mirrors is perpendicular to the dispersion direction of the grating. This distributes the field curvature and distortion in two axes, thereby flattening the focal plane and permitting a long entrance slit and a flat focal plane. The focal lengths of the two mirrors are quite different: 2096 mm for the collimator and 932 mm for the camera mirror. As the collimator focus is long, flat fold mirrors (SM2 and SM4) have been added between the slit and the collimator and between the collimator and grating. The second fold mirror is tilted so its deflection is in the dispersion direction of the grating. This helps create a separation between the collimator and camera optics. The camera mirror provides the f/8 focal ratio needed to image the field onto the \(36\times 36~\text{mm}\) focal-plane array inside the polarization analyzer assembly.

Top panel: A three-dimensional ray trace of the Cryo-NIRSP spectrograph optical design viewed in projection. The spectrograph-slit plane (SPSP) shown in Figure 3 is immediately upstream of the order-sorting filter (SPF). The flat fold mirrors SM2 and SM4 help to keep the cryostat as small as possible. SM3 is the collimator, GT is the grating, and SM5 is the camera mirror that directs the light into the polarization-analyzer assembly, which is shown here as one element. See Figure 7 for more details. Bottom panel: Panoramic view of the Cryo-NIRSP spectrograph. In addition to the mirrors and grating, the analyzer and filter/slit wheel (SPW) assemblies are also labeled.
2.2.2 Spectrograph Entrance Window and Slits
The light enters the spectrograph cryostat through a 25 mm thick CaF2 window (SPW in Figure 3). This window will produce a ghost image that could interfere with high-contrast observations at the solar limb. In particular, a high-intensity ghost from the solar disk could exceed the much fainter off-limb signal by orders of magnitude. To avoid this issue we have tilted the entrance window by 1.67 degrees, which separates the principal image and the ghost by 0.5 mm in the image plane. This arrangement permits the deliberate placement of the ghost image on the solar-disk side for limb observations.
The first component after the spectrograph-cryostat entrance window is the slit wheel (SPW) with a total of 16 available positions. A selection of slits and other masks are provided at this image plane where the plate scale is \(350~\upmu \text{m}\,\text{arcsec}^{-1}\). The main slits are laser cut into a 50 μm thick stainless-steel foil that is sandwiched between two stainless-steel plates. A high-resolution mode is provided by a slit 52 μm wide and 41 mm long, thus sampling \(0.15''\) by \(117''\) on the Sun. Diffraction through this narrow slit helps to fill the full width of the grating and to achieve the required resolving power [R] of \(\approx100,000\). A second slit that is 175 μm wide and 81 mm long is provided and intended for off-limb application; it samples \(0.5''\) by \(231''\) and achieves a resolving power of \(\gtrsim30,000\).
2.2.3 Spectrograph Filters
Immediately following the slit wheel is a filter wheel with 16 available positions to accommodate cold order-sorting filters. The currently available filters were selected to cover the main diagnostics defined in the science requirements (see Table 1). Alluxa was chosen to provide the Cryo-NIRSP band-pass filters that are used at cryogenic temperatures of 77 K. The key requirements for the filters were high transmission on-band and average blocking of three optical densities out of band from 500 to 5300 nm. The commissioning data revealed that the infrared arrays have some sensitivity below 500 nm. As a result, we have to contend with contamination by overlapping blue spectra in some of our infrared spectra. We are working on procuring new filters with even broader blocking and somewhat tighter bandpass specifications. Table 3 provides a summary of the available filters and the achievable spectrograph key metrics, and Figure 6 shows the measured transmission profiles.

Measured transmission curves of the Cryo-NIRSP spectrograph order-sorting filters. The vertical dotted lines indicate the center wavelength of the targeted spectral lines. For the He i and Fe xiii pass band we have two filters available. To avoid the filter wings, the cyan-colored filter should not be used for the 1074.7 nm observations, and the orange dashed colored filter is less favorable at 1083 nm.
2.2.4 Diffraction Grating
The primary grating is an R2 echelle, with 31.6 grooves per millimeter, a blaze angle of 63.9 degrees, and a total ruled width of 408 mm from Richardson Grating Laboratory. This width is sufficient to achieve the required resolving power at 4.6 μm. We use the grating in an inverse configuration with the incident beam angle [\(\alpha \)] smaller than the diffracted angle \(\beta \) and \(\alpha - \beta = -11.0\) degrees. This yields the highest resolving power with the smallest size and focal length of the camera mirror. The disadvantage of this configuration is some grating shadowing that reduces the overall efficiency of the spectrograph. The grating stage can freely rotate a full 360 degrees and has room for a second grating. It is driven by a Phytron vacuum stepper motor (model VSS57.200.2.5-UV) and uses a custom double stack of harmonic drive gears to achieve a 0.25-arcsec step size. This drive mechanism is combined with an absolute 32-bit Renishaw optical encoder and four read heads to guarantee an angular grating position repeatability of better than one pixel on the spectrograph detector.
2.2.5 Polarization Analyzer
The polarization analyzer (see Figure 7) is another critical component of the Cryo-NIRSP instrument. In order to meet the required measurement accuracy, a dual-beam polarimeter is necessary. This means that a beam-splitting analyzer creates two orthogonally polarized beams that are recorded at the same time. To maintain the longest possible common path for the two beams, we chose to place the analyzer as the last component in the beam path, just ahead of the detector. This minimizes differential aberrations between the two beams and facilitates combining the two beams during data analysis. The analyzer is based on wire-grid polarizers on fused-silica substrates from Moxtek (UBB01A). These 1 mm thick parts have about 15% transmission at 4.65 μm to allow polarimetry in the mid-infrared. In the analyzer, the beam first encounters the WG1 wire-grid polarizer as shown in Figure 7. The transmitted beam is redirected by two flat fold mirrors (SB1 and SB2) and a right-angle prism onto one half of the detector. The reflected beam from the primary polarizer is directed to a second polarizer (WG2) that has its wires rotated by 90 degrees compared to the first one. The addition of the secondary polarizer enhances the polarization contrast and equalizes the optical path length and intensities of the two beams. The second beam is then redirected by a fold mirror (SB3) and the right-angle prism onto the second half of the detector. The final image recorded by the camera shows two orthogonally polarized spectra (see Figure 8), each of which covers half of the horizontal array width in the spectral direction. The spatial direction along the slit is oriented vertically, and the coverage depends on the slit length. Any reflections off the secondary polarizer are captured by a light trap.

Polarization analyzer and detector assembly. Left image shows a non-sequential ray trace that was used to optimize the light-trap design. The wire-grid polarizer (WG1) splits orthogonal polarization states. Wire-grid WG2 is used in transmission to balance the intensity of the two beams. The flat fold mirrors SB1, SB2, and SB3 redirect the two beams on to the right-angle prism mirror (P) that recombines the two beams on to the detector array. Right image shows the fully assembled Cryo-NIRSP polarization analyzer.

Raw Cryo-NIRSP on-disk spectrum centered on He i 1083 nm recorded with the high-resolution slit. The dashed line in the center of the image indicates the boundary between the two orthogonally polarized beams. The spectral dispersion in the horizontal direction is about 4 pm per pixel and wavelengths increase towards the left-hand side of the image. The nominal spatial sampling along the slit (vertical direction) is about 0.12 arcsec per pixel.
2.3 Context Imager
The third major subsystem of Cryo-NIRSP is the Context Imager. When Cryo-NIRSP is used for observations, the light path to the other DKIST instruments is blocked, thus eliminating the possibility of using another DKIST facility instrument as a context image. For this reason, we have installed a small cryostat next to the spectrograph that contains an infrared-camera system to image the field seen by Cryo-NIRSP (see Figure 9). Budget constraints during the early instrument-development phase compelled us to use a smaller dewar intended for testing as the context-imager cryostat. As a consequence, early plans for cold re-imaging optics were abandoned, and the spectral coverage was thus limited to wavelengths from 1 to 2 μm. For longer wavelengths, the scene would be dominated by the thermal background seen by the detector. Further, directly imaging the f/18 beam provided by the feed optics results in a 100 by 100 arcsec context-imager field-of-view with an image scale of 0.05 arcsec per pixel. This is sufficient to capture most of the field height covered by the high-resolution spectrograph slit but only the center part of the low-resolution slit. To cover the full 2.8 or 5 arcmin telescope field-of-view, we must mosaic the image across the context-imager focal plane using the Cryo-NIRSP beam-steering mirror.

The left image shows the installed narrow-band context-imager filters. The other side of the dual-wheel assembly contains the wire-grid analyzers and the OD filters. The right image shows some of the context-imager cold components (filter wheel and radiation shields not shown). All components are mounted on the cold plate (CP), which is thermally stabilized with a heater and a temperature probe (TP). The H2RG detector array is mounted electrically isolated on a G10 plate. A steel cold trap (CT) remains the coldest part inside the cryostat during warm-up and prevents contaminants from condensing on the array. Activated-charcoal gatherers (GA) trap contaminants and help maintain a good vacuum in the cold operation state.
The remaining optical components of the context imager are the plane-parallel CaF2 entrance window and two filter wheels with nine positions each. The first wheel contains a dark stop, an open position, and a combination of OD-filters and wire-grid analyzers. The OD-filters are used to balance the flux so that the context-imager exposure times better match the spectrograph ones. We use the same type of Moxtek wire-grids as in the spectrograph analyzer to allow for single-beam imaging polarimetry with the context imager. In Table 4 we list the available combinations of optics in the first filter wheel as well as the imaging filters in the second wheel. Alluxa was chosen to provide the Cryo-NIRSP imaging filters that are used at cryogenic temperatures of 77 K (see Figure 9). The key requirements for the filters were high transmission on-band and average blocking of four optical densities out of band from 500 to 5300 nm. Figure 10 shows the measured transmission profiles of the filters.

Measured transmission of the Cryo-NIRSP narrow-band context-imaging filters. The vertical dotted lines indicate the center wavelength of the targeted spectral lines.
2.4 Vacuum and Thermal Systems
Early tests proved vacuum turbo pumps to be a considerable source of vibrations not only on Cryo-NIRSP, but also on the coudé laboratory at DKIST. For this reason we run the mobile-vacuum-pump system only during non-observing time. Once sufficient vacuum has been drawn to start the cool-down of the instrument, the valve to the cryostat is closed and the pump stopped. The cryogenic cooling itself is very efficient in further improving the vacuum inside the cryostat via condensation on cold surfaces. During the cool-down cycle, the coldest points will be the cold heads and condensation will happen there. For the warm-up phase we have placed a stainless-steel cold trap next to the camera array to prevent condensation on the sensor. Further, activated-charcoal traps help capture any remaining contaminants inside the cryostat, which will only be released and pumped off on a warm-up cycle. This procedure has proven to be very successful, and both Cryo-NIRSP cryostats will maintain a vacuum better than \(10^{-7}~\text{mbar}\) for months in the cold operating steady state. For cooling, we use Gifford–McMahon-style closed-cycle helium cryocoolers from Sumitomo Heavy Industries, Ltd. The main type of cold head is the two-stage model RDK-408S, with a cooling power of 6.3 W at 10 K on the colder second stage. Two of these units are used in the spectrograph and the context imager uses one. Due to the larger mass of the spectrograph, we use an additional single-stage cooler (RDK-400B) during the cool-down of that cryostat. With this setup, the cool-down times are five days for the spectrograph and two days for the context imager. Lakeshore RD-670 silicon-diode sensors are placed in the cryostats to monitor the temperatures. Lakeshore model 336 temperature controllers use heaters inside the cryostats to regulate the temperatures of the camera arrays and the optical benches in both cryostats to set points of 60 K and 55 K, respectively.
The Gifford–McMahon-style cold heads use a mechanical piston inside the cold heads that moves at a rate of 1 Hz and produces significant vibrations. The Cryo-NIRSP cryostats use a multi-stage approach for vibration isolation (see Figure 11). First, the cold heads are mounted onto a floating disk where the diameters of the top and bottom vacuum bellows are selected to keep the disk suspended and reduce the vibrations transmitted to the rest of the cryostat. Secondly, flexible copper-braided strands are used to connect the cold-head tips to the optical benches of the instrument. We measured vibrations on the grating and camera mounts with accelerometers and can see the 1 Hz pulse – caused by the displacer – and its harmonics in the frequency spectrum. However, the derived displacement amplitude is below 1 μm RMS in all locations and thus would move the image on the camera by about 0.05 pixel.

Vibration-isolation measures for cold heads. The weight of the cold head and the compensating bellows balance out the force exerted by the main bellows and keep the mounting disk in a floating state. Flexible copper braiding is used to connect the first and second stage of the cold head to the cold benches inside the cryostat.
2.5 Alignment
As the relative positioning of the optical mounts will change when Cryo-NIRSP is cooled, the alignment process for the instrument is more involved than for a similar instrument at room temperature. Most notably, the entire optical bench contracts in length by about 10 mm when transitioning from room temperature to 60 K. This has to be factored in when positioning the optical components at room temperature. We used more traditional tools such as theodolites and interferometers as well as coordinate measuring machine (CMM) arms and laser trackers to perform all alignment tasks.
Crucial steps in understanding the relative movements of the optics inside the spectrograph cryostat were taken very early in the construction phase. We placed a set of three corner-cube reflectors that define a plane on every optical mount inside the spectrograph. Entrance windows on both ends of the vacuum case then allowed us to measure relative changes in tip, tilt, and position of these planes with laser trackers as we cooled the instrument. These measurements confirmed that angular changes would remain within our optical-alignment tolerances of \(\pm0.03~\text{degrees}\) and are highly repeatable. We also used these data to establish the movement of each optic along the beam path as a result of the bench contraction. This allowed us to correctly place the optics at room temperature so that they end up at the right cold-operating position.
All Cryo-NIRSP mirrors have conical datum features that we use to establish the relationship between the optical properties and the physical part. For our off-axis mirrors, we know exactly the parent vertex location with respect to the datums, which facilitates placement and clocking. The powered but symmetric mirrors have a known relationship between the center of curvature, the principal axis, and the datums. In addition, all flat-mirror planes are linked to their datum planes.
The mutual alignment of the polarization-analyzer optics, detector array, and grating roll was performed iteratively over several cooling cycles. As these components do not allow for direct contact of their front surfaces, we imaged a pinhole mask in the slit wheel to acquire the necessary feedback. The grating was tilted around the horizontal axis until all orders of a pinhole spectrum would fall onto the same row on the detector. Similarly, the analyzer fold mirrors were used to align the center of the pinhole mask in the left and the right beams. Finally, the beam-combining prism is mounted on an \(xy\)-stage, a rotation stage, and a tilt stage. The tilt and rotation are used to align the image plane with the detector-array plane using the spatial pinhole width on the array as a feedback. The translation stage adjusts the path length between the two analyzer beams to achieve a simultaneous best focus.
The above techniques and obtained information allowed us to align the spectrograph in the lab and to verify the imaging performance before transporting Cryo-NIRSP to DKIST. The optics were removed for shipping but our metrology allowed us to precisely re-install them on site. The final alignment of Cryo-NIRSP uses the DKIST mirror M9 as the reference. Theodolites and laser trackers were used to position the feed-optics mirrors FM1 and FM2, the warm OD-filters, the polarization modulator, and the beam splitter. After the alignment we use a 4D Technology PhaseCam interferometer and DKIST mirror M9a as the return flat to verify the imaging performance of the feed optics. This also provided us with the exact gut-ray focus positions in the spectrograph and context-imager path. The last step was then to position the spectrograph and the context imager so that the spectrograph-slit center and the context-imager array center would coincide with these gut-ray focus locations.
3 Camera System
The Cryo-NIRSP camera system is comprised of HAWAII 2RG (H2RG: Beletic et al., 2008) focal-plane arrays from Teledyne Imaging and custom camera controllers from the University of Hawai´i’s Institute for Astronomy. The spectrograph has a medium-wave infrared (MWIR) array installed that has a cut-off wavelength of 5.3 μm. The context imager uses a 2.5 μm cut-off short-wave infrared (SWIR) sensor. Both detectors are sensitive to light down to at least 400 nm, which requires broad out-of-band blocking for the spectrograph order sorting and the context-imaging filters. The sensors have a size of \(2048 \times 2048\) pixels with a physical pixel size of 18 μm.
To precisely synchronize all subsystems, the DKIST uses a Time Reference And Distribution System (TRADS: Ferayorni et al., 2014). The Camera Systems Software (CSS: Berst, 2021) uses TRADS timing cards to provide trigger pulses to the camera hardware to acquire images at predetermined times. At the time of construction, no available H2RG controller would accept an external trigger pulse. Thus, we partnered with the University of Hawai´i’s Institute for Astronomy to adapt their Pizza Box 1 High Speed (PB1HS) controller to the Cryo-NIRSP needs.
The camera controllers are located just outside the Cryo-NIRSP cryostats. They provide all digital and analog bias voltages, clock and control signals, and a programming interface to operate the H2RGs. They also receive the analog pixel signals, perform the analog-to-digital conversion and deliver the captured frames to the PBServer via USB3. This server creates FITS files that are then shared with the CSS that is running on the same computer.
The H2RG detectors are CMOS devices, and the unit cell of each pixel includes circuitry to convert the accumulated charge to a measurable voltage. It has several options for resetting and amplifying the accumulated charge. It allows for non-destructive (up-the-ramp) reading of the pixel voltage while still accumulating photo-electrons. This concept is especially useful in scenes with high dynamic range such as the solar limb where some pixels might saturate after a few reads, while others can collect photons for the entire exposure. We can then use the non-saturated reads of each pixel to derive a per-pixel flux. The non-destructive read mode also allows us to reduce the read noise compared to what we would obtain from a single readout of the array (Rauscher et al., 2007).
3.1 Camera Operating Modes
We have implemented three camera modes that are tailored to the large light-flux differences between solar-disk and coronal observations. All modes use the 32-channel output mode of the H2RG and are optimized to provide the required high-accuracy synchronization with the polarization modulator. For any mode, we can increase the exposure rate by reducing the number of sensor rows that are read out. The narrow spectrograph slit, for example, only illuminates half of the detector rows, and thus we can double the exposure rate by reading out only the center part of the array.
-
i)
Slow Up-the-Ramp Mode: This uses the normal slow-clocking mode of the H2RG and the pixel-by-pixel reset mode. Thus, we have to clock through the entire array once to reset all pixels. After the reset, we start the non-destructive reads and need at least two more clocking passes through the array to acquire a useful exposure. The required three clocking passes require a minimum of 1.49 seconds for an effective rate of unique integrations of 0.67 Hz in this mode. Our clocking scheme allows for wait times in increments of 20 ns between sequential readouts of the array so that the total exposure time can be adjusted. Successive frames in each ramp yield decreasing pixel voltages. Figure 12 shows the timing diagram for a slow-mode camera configuration with three non-destructive reads.
Figure 12 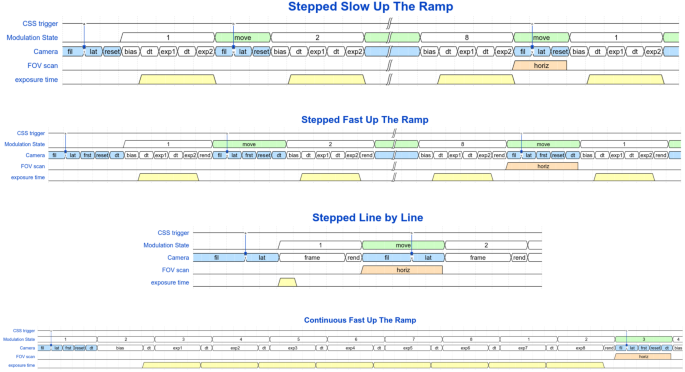
Timing diagrams for the different camera and modulation modes. Continuous polarization modulation only works with the fast camera mode and needs ten non-destructive reads to capture a full modulation cycle of eight states.
-
ii)
Fast Up-the-Ramp Mode: This uses the normal fast-clocking mode of the H2RG, whish makes use of a column buffer to increase readout speeds. For this mode we use the standard line-by-line reset mode that shortens the time needed for the reset compared to the slow mode. We discovered a reset anomaly that is present in the first non-destructive read after the reset and renders that frame unusable. Thus, we need the reset time plus three full clocking passes through the array to acquire a useful exposure. The required three clocking passes requires a minimum of 0.273 seconds for an effective rate of unique integrations of 3.66 Hz in this mode. Our clocking scheme allows for wait times in increments of 20 ns between sequential readouts of the array so that the total exposure time can be adjusted. In this mode the voltage output in each ramp increases with time. Figure 12 shows two timing-diagram examples for fast-mode camera configurations with four and ten non-destructive reads.
-
iii)
Line-by-Line Mode: This also uses the normal fast-clocking mode of the H2RG. It provides very short exposure times that are suited for high-flux scenarios. To achieve the short exposures, we perform repeated non-destructive reads of a single row before moving on to the next row. To start, we reset the entire row and then perform four non-destructive reads of that row. The final exposure can then be calculated by averaging the third minus the first read and the fourth minus the second read. The need for four reads is driven by the design of the fast-mode column buffer, which uses two storage capacitors that have slightly different time constants. As such, odd-numbered-row reads will use capacitor A while even-numbered row reads will be stored in capacitor B. The difference between the two reads would then show a signature of the time constant difference across the row. With our read-out scheme we ensure that we only subtract row reads that use the same buffer capacitors. We can read out the entire array in this mode with a maximal exposure rate of 2.73 Hz and effective pixel exposure times as low as 88 μs. To adjust the exposure time we can introduce a wait time in increments of 20 ns in between the second and third readout of a row. Figure 12 shows the timing diagram for the line-by-line-mode camera configuration.

3.2 Camera and Modulator Synchronization
To perform accurate polarimetric measurements, it is crucial to synchronize the movements of the modulating optic and the camera exposures. The Cryo-NIRSP modulator can operate in stepped or continuous mode. Figure 12 shows timing diagrams to illustrate the intricate interplay between the two components. Also included in the diagrams are locations where the beam-steering mirror could perform a FOV scan step. A fill time [fil] is calculated by the instrument controller such that all components align as shown. This takes into account the necessary move times of all mechanisms and the trigger latency [lat] that was measured for all camera modes.
For the fast camera mode, the time allocated for the line-by-line reset of the array is indicated by frst. The reset interval indicates the first full clocking pass through the array. In slow mode this is used to reset the charge on the pixel; in fast mode this is the unusable first read of the array with the reset anomaly.
Bias and exp1 are the minimally required readouts to obtain a simple bias-subtracted exposure. Subsequent readouts are labeled expN. The wait time dt in between readouts is calculated to obtain the desired total exposure time of the non-destructive read ramp.
The fast camera mode needs some extra time [rend] at the end of a ramp to transfer the data from the controller to the PBserver. For the line-by-line camera mode, the interval labeled frame represents the time needed to complete resetting and reading out all rows.
-
i)
Stepped Modulation: All camera modes work with this modulation mode. To optimize the observing efficiency, we move all mechanisms during the reset phase of the array. This also includes the unusable first read out for the fast camera mode. The Cryo-NIRSP instrument controller will calculate a fill time that is used in the CSS trigger period such that the overall timing aligns. The maximum modulation rate is limited by the exposure rate of each camera mode.
-
ii)
Continuous Modulation: This works only with the fast camera mode as a total of ten non-destructive reads are necessary without saturating the array for the default eight-state modulation scheme. Science frames are calculated as the difference of two subsequent non-destructive reads. Since the modulator is continuously spinning, each pixel of a channel will see a slightly different polarization modulation, which makes the analysis more involved. In this mode we are able to increase the modulation rate to 10 Hz.
4 Instrument Operation and Software
4.1 Instrument Controller
The instrument controller (ICS: Williams et al., 2019) for Cryo-NIRSP uses the standard infrastructure of the DKIST Common Services Framework (CSF: Hubbard, Goodrich, and Wampler, 2010; Guzzo et al., 2021) to integrate into the facility. In this framework, the Cryo-NIRSP Instrument Controller (IC) configures the instrument and cameras, schedules synchronized actions of components, and finally triggers the execution and monitoring of a task.
An engineering GUI provides easy access to the Cryo-NIRSP IC. It allows the operator to monitor the status of the instrument and to reconfigure individual mechanisms or thermal set points. The GUI also features an interface to build and execute instrument programs for calibrations or observations.
All motion-control operations are handled by a DeltaTau PMAC system. Normally, all mechanisms are configured asynchronously during the set-up phase. However, the field-steering mirror has to be synchronized with the camera and modulator optics, and these moves are executed by a real-time move program. Some of the calibration tasks also require coordination of mechanisms and the camera, and they make use of the real-time moves.
4.2 Operation Modes
The nominal operation mode of Cryo-NIRSP uses the warm beamsplitter to operate the spectropolarimeter and the context imager simultaneously. By deploying the pick-off mirror in the warm feed optics, one can perform context-imager only observations. Spectrograph-only observations are not supported at this time as the spectrograph alignment has factored in the beam deflection caused by the beamsplitter. The two-axis field-steering mirror allows for sit-and-stare and 1D- or 2D-scanned observations anywhere in the telescope field-of-view. For the default simultaneous measurements, the scanning is defined by the spectrograph and the context image is always centered on the slit.
Observations can be performed in intensity-only (with or without the modulator deployed in the beam) or polarimetric mode. The latter uses the default eight-state scheme for both the stepped and the continuous polarization modulation mode. Different modulation schemes can be implemented and will be explored in the future. The spectrograph has a dual-beam analyzer to perform polarimetric measurements. The context imager uses a single wire-grid to analyze the modulated light.
The Cryo-NIRSP spectrograph can only observe a single spectral band-pass at a time. To perform measurements of spectral lines that are not within the band-pass on the detector, a grating move and possibly an order-sorting filter change are required. The necessary reconfiguration time is dictated by the grating move and can be as long as 70 seconds. For this reason we encourage finishing field-of-view scans at one wavelength before moving to a different spectral line. Similarly, the wavelength-reconfiguration time for the context imager is driven by the filter-change time. Currently, for simultaneous observations, only a single context-imager filter per field-of-view scan is supported.
4.3 Processing Plugins, Calibration Store, and Detailed Displays
The Data Handling System (DHS: Cowan and Wampler, 2011) is part of the DKIST software framework and allows access to a copy of the raw data that can be passed on to processing plugins (Williams et al., 2020). The raw data remain unaltered by this processing and are transferred to the DKIST data center. The Cryo-NIRSP plugins are written in Python and provide processing capabilities at the telescope for calibration tasks and science data. The processed data are then shown in a detailed display to provide immediate quality assurance for the current observation.
Dark and gain-calibration tasks produce dark images and quick gain tables that are transferred to the DHS’s calibration store and then later can be applied to observational data. These calibration frames are tagged with the instrument configuration and can only be applied to an observation that matches this key. Focus and alignment calibration tasks provide the best position values for the focus stages and the field-steering mirror. These values are again tagged with the instrument configuration, stored in a database, and applied to the motion stages when the same instrument configuration is requested. Finally, observing tasks will demodulate the data in polarimetric mode and show Stokes spectra for the current field position and a Stokes map for the entire scan in the detailed display. This allows the observer to quickly assess and monitor the data quality and take the necessary actions, if any are required.
4.4 Instrument-Performance Calculator
The Cryo-NIRSP Instrument Performance Calculator (IPC) is a graphical tool (see Figure 13) provided by DKIST to explore the capabilities of Cryo-NIRSP based on selected user inputs. The tool is written in Python and available for downloading at bitbucket.org/dkisthls/cn_ipc/downloads/dkist.ipc.cn.zip. The current version of the IPC provides signal-to-noise estimates for on-disk and coronal observations performed with Cryo-NIRSP. For coronal observations we also provide an estimated velocity and magnetic-field strength sensitivity.

The startup panels of the Cryo-NIRSP Instrument Performance Calculator (IPC), an end-user utility for calculating instrument performance based on user-specified settings. These panels show areas for (1) tabs where inputs are selected and configuration outputs generated, (2) a map area for synthetic target selection, (3) a plotting area for synthetic spectra and observable sensitivities, and (4) an instrument program tree and timeline for building sequences of programs.
The flux calculations for the on-disk continuum are based on a blackbody spectrum and a simple limb-darkening function. For off-limb estimates we use MODTRAN simulations for the sky-brightness spectrum and its radial dependence. The flux model for the coronal emission lines is based on the work by Kuhn, Penn, and Mann (1996) and Del Zanna and DeLuca (2018); however, the IPC allows the user to manipulate the sky brightness and emission-line strengths to explore the effect of varying conditions.
The efficiency calculation for the combined telescope and Cryo-NIRSP system uses measured reflectivity and transmission values for all optical elements along the beam path. The thermal emission of these components is also estimated and added to the background signal. The spectrograph, the camera, and the instrument calculators use the flux and efficiency spectra to provide an estimated signal and background per pixel as well as the overall timing for the observation. As we learn more about the instrument performance during the operational-commissioning phase, we will update the IPC to reflect these insights and provide the user with more accurate estimates.
5 First Results
Cryo-NIRSP has carried out a number of targeted on-Sun campaigns as part of the DKIST Science Verification (SV) efforts for the purposes of validating capabilities and refining early calibration methodologies. Below, we showcase a number of calibrated data sets; however, it should be understood that these data reflect the state of the instrument at the end of DKIST construction. Both the instrument and facility will continue to mature over time to optimize science performance. Furthermore, the discussion below concentrates primarily on the spectrograph data, which have been the priority of initial calibration efforts.
5.1 On-disk Spectropolarimetry near He i 1083
On 11 February 2022, Cryo-NIRSP targeted the leading sunspot within NOAA 12941 and observed the He i 1083 nm band-pass using both the spectrograph and the context imager. While Cryo-NIRSP, being located upstream of the DKIST wavefront-correction system, is not designed to achieve very high spatial resolution on-disk (especially at shorter wavelengths), its science mission includes on-disk observables. In addition, for the purposes of SV, on-disk spectropolarimetry of strong magnetic fields allows detailed validation of calibrated data products, especially through cross-comparison with other instrumentation.
The left-column panels of Figure 14 shows example spectropolarimetric raster scans obtained by Cryo-NIRSP between 20:12 and 20:53 UT, which are displayed adjacent to corresponding data obtained by NASA’s Solar Dynamics Observatory (SDO: Pesnell, Thompson, and Chamberlin, 2012) using its Atmospheric Imaging Assembly (AIA: Lemen et al., 2011) and Helioseismic and Magnetic Imager (HMI: Scherrer et al., 2012). With its narrow \(0.15''\) wide slit, Cryo-NIRSP conducted a 100-position raster using \(0.33''\) steps, covering a total FOV of \(33\times 128''\). At each position, 16 discrete modulation states were acquired using the fast up-the-ramp camera mode with 1265 ms exposures corresponding to 16 camera readouts. The long exposures resulted from the use of an OD4 attenuation filter in the feed optics. Therefore, during this single raster, 25,600 individual frames were read out and written to FITS files by the spectrograph, resulting in 204 GB of data. The data were calibrated using prototype Level 1 calibration algorithms including end-to-end polarization calibration and dual-beam combination. As shown, we achieve a high level of consistency between the spatial distributions of photospheric polarized signals observed by Cryo-NIRSP and SDO/HMI.

Spectro-polarimetric raster data acquired by the Cryo-NIRSP on 11 February 2022 in a spectral band-pass near 1082.5 nm (left panels) and compared to SDO data (right panels). The slit axis is aligned with the solar-X-direction. The fractional-polarized maps show signals in the red line wing of Si i and Fe i, symmetrically scaled \(\pm10\%\) for Q and U, and \(\pm20\%\) for V. The He i absorption-line center intensity (bottom left), scaled from 0.5 to 0.9 of the continuum intensity, is compared to SDO/AIA 304 Å, which is dominated by He ii emission.
Figure 15 shows the Stokes-\(I\) Cryo-NIRSP band-pass obtained during the raster at \(Y = 472''\) along with two example profiles extracted from within the sunspot umbra (orange line) and within the region of solar plage (blue line) near \(\langle X,Y \rangle = \langle 450,475 \rangle \). The spectral dispersion is \(4.2~\text{pm}\,\text{pixel}^{-1}\) while the spectral range common to both raw polarized beams is 1081.7 to 1085.4 nm. Based on disk-center calibration data, we estimate that the resolving power of these data is \(\approx75\text{k}\) using the methods described by Borrero et al. (2016). In Figure 16, the calibrated Stokes spectra at \(Y = 478.5''\) are shown within a restricted range near 1083 nm. The continuum noise in each Stokes state is \(\approx0.16\%\) of the total intensity. At this sensitivity, the Zeeman-induced Stokes profiles of the Si i and He i lines compare favorably with previous studies (e.g. Schad, Penn, and Lin, 2013; Orozco Suárez et al., 2017).

Stokes-\(I\) spectrum acquired at one slit position (\(Y = 472''\)) within the FOV of Figure 14 with lines identified. Note that parentheses around (H2O) are used to denote these as telluric absorption lines. To enhance contrast, the Stokes-\(I\) image is scaled by the square of the value.

Stokes spectra near 1083 nm sampling the sunspot penumbra (\(Y = 478.5''\)) within the FOV of Figure 14. The polarized data are symmetrically scaled \(\pm 2\%\) to enhance the visibility of the weaker He i triplet signals 1082.9 and 1083 nm. The Si i 1082.7 nm polarized signals are saturated in this gray scale.
5.2 Carbon Monoxide 4665-nm Observations
Mid-infrared spectroscopy of the CO 4.6 μm fundamental band is a key observable for Cryo-NIRSP; however, it also presents unique challenges. On 17 September 2021, SV time-series observations were acquired using the Cryo-NIRSP spectrograph at disk center targeting the CO spectral lines near 4662 nm. At this time, Cryo-NIRSP performance was affected by cryostat vibrations that introduced small-scale spectral motion, thereby reducing the resolving power. In addition, the OD2 silver-coated pellicle used during these observations experienced a partial failure part-way through the time series. While both of these issues have subsequently been resolved, a further challenge is the presence of strong interference fringing in this band, which requires further investigation.
An example spectral image centered at 4662.6 nm is shown Figure 17. In the top panel, the dual-beam spectrum is shown after standard calibrations have been applied, i.e. detector calibrations and spectral-curvature removal. Comparison of this spectrum with the corresponding solar atlas displayed in Figure 18 clearly indicates that the observed spectrum is significantly impacted by interference fringing. Unfortunately, due to the unique challenges posed by thermal IR observations, we have been unable to date to remove these fringes using calibration lamps. Initial efforts to remove these fringes post-facto have found some success. We have employed the fast algorithm for independent component analysis (FastICA), which is a matrix-factorization technique used for blind source separation (Hyvärinen and Oja, 2000). We compute ten independent components for each observed spectral row using a time series of observations, and then we filter out all components whose spectral structure does not contain signatures of the solar absorption lines. The result of this process is shown in the bottom panel of Figure 17, which compares much more favorably with the atlas spectrum; however, the quantitative validation of the FastICA approach remains under study. We can, however, report that after applying this approach to all of the time-series data, a Fourier analysis recovers many of the previously reported features of solar oscillations observed in CO lines (Ayres and Brault, 1990; Penn, Schad, and Cox, 2011).

Commissioning data targeting the CO fundamental band at 4665 nm acquired by the Cryo-NIRSP on 17 September 2021. The top panel shows the cropped dual-beam spectral image after detector and spectral-curvature calibrations have been applied. Sample profiles, scaled and offset to enhance visibility, are overplotted in green for rows 725, 1000, and 1275. The vertical white dashed line indicates the approximate boundary between the two polarized beams. The bottom panel shows the same spectral image after interference fringes are mitigated using fast independent component analysis, as discussed in the text.

5.3 Coronal Observations
5.3.1 Detections of All First-Priority Coronal lines
Coronal spectral observations in multiple science channels were obtained on 14 February 2022, both in support of Cryo-NIRSP SV and on-going characterization efforts of the DKIST primary mirror’s scattered-light performance. The second iteration of the in-situ wash procedures for the DKIST primary mirror was completed ten days prior to these observations. Daytime sky conditions were estimated using the Evans Sky Photometer (Evans, 1948), indicating a sky-background contribution of many tens of millionths of the solar-disk brightness. Seeing conditions could not be independently assessed; however, qualitatively, the conditions were below average for DKIST. Thus, on this date, the conditions were sufficient yet not optimal for coronal science.
Figure 19 shows example observations of coronal spectra centered on the Fe xiii 1074.6 nm coronal line. These spectra were obtained with the spectrograph slit oriented radially above NOAA 12950 when it was located on the northeast limb on 14 February 2022. An approximate distance scale above the limb is provided in the figure. In the left panel, only detector calibrations have been applied to the data with the exception that the raw counts have been converted into intensity units relative to disk-center values. For this, disk-center calibrations were acquired with an attenuation filter deployed into the feed relay, and the lab metrology value for the attenuation was used; however, the validity of this approach requires more analysis in the near future. The scattered solar-continuum varies in intensity along the slit from approximately 120 to 60 millionths of the disk-center intensity. The coronal line is evident in these raw spectra (before flat fielding) near detector column 540. At this wavelength, strong interference fringes with amplitudes \(>\pm5\%\) contaminate the spectra along most of the slit (\(\gtrsim 1.08~\text{R}_{\odot}\) in Figure 19), and subsequently complicate flat-fielding techniques and background removal. Some degree of fringing is apparent in most of the coronal channels, but here it is amplified due to the spectral band-pass filter currently being used at this wavelength. A new filter is planned to be fabricated in the near future.

Coronal spectra acquired near 1074 nm using the wide coronal slit oriented radially above NOAA 12950 when it was located on the northeast limb on 14 February 2022. The left panel shows the spectra with only detector calibrations applied and thus the background scattered light is included. The right panel image is after the spectral and background corrections have been applied. Spectral curvature is removed in both cases. Intensity units are the result of preliminary photometric calibrations.
A combination of strategies including empirical fringe fitting can be used to isolate the coronal signal from the background. In the right panel of Figure 19, the background has been effectively removed, and thus the coronal line strength (now as a calibrated function of wavelength) appears with increased contrast. Example line profiles, the removed spectral background, and Gaussian line fits are shown for all priority first-light Cryo-NIRSP coronal lines in Figure 20. While a more complete scientific analysis is pending, these detections collectively show the range of use that Cryo-NIRSP provides for coronal observations. A particularly notable result is that Cryo-NIRSP detects the Si ix line at 3934 nm, which has not been routinely measured from the ground.

Spectral detections of all prime Cryo-NIRSP coronal lines shown in photometrically calibrated intensity units relative to disk center. In each panel, the background-corrected profile is fit with a Gaussian function. The observed profile and the derived background component are shown below each calibrated observation.
5.3.2 Slit-Scanned Coronal Images
In Figure 21, initial results from an off-limb image raster are shown for the Fe xiii 1074.6 nm coronal line in the top panels. These maps were obtained in polarimetric mode, using a radially oriented slit, on 2 March 2022 between 20:43 and 21:35 UT; however, here we only show analysis conducted using the total-intensity spectra. Exposure times were 723 ms using the fast camera mode, thereby recording ten detector readouts for each exposure. This was repeated for 16 discrete modulation states at 200 slit positions separated by 1 arcsec. The target was the off-limb region in the Northeast, later numbered NOAA 12962, comprised of active-region loops and a low-lying structure that undergoes eruption during the observation. See the SDO/AIA images obtained at 21:15 UT displayed in the lower panels of the figure.

Slit-reconstructed maps of the Fe xiii 1074.6 nm coronal line’s peak intensity, Doppler shift, and full width at half-maximum as modeled by a Gaussian function (top panels) for NOAA 12962. These maps are compared to the same region observed by SDO/AIA at 21:15 UT on 2 March 2022; although, note the plotting field-of-view differs in these bottom panels. The dotted circle corresponds to the 5-arcmin diameter DKIST field-of-view during this observation, and the position of the solar limb is denoted by the curved solid-white line.
The Cryo-NIRSP maps in Figure 21 result from a least-squares fitting analysis that simultaneously includes the coronal line (modeled as a Gaussian profile) and three constrained sinusoidal functions to treat the interference fringes (see Figure 19). The line peak intensity measured in units of millionths of the disk center intensity (top-left panel) exhibits spatial structure consistent with the AIA 193 Å and 171 Å channels; however, the spatial resolution for Cryo-NIRSP is impacted by the local seeing conditions. Doppler line shifts range from −4 to \(0~\text{km}\,\text{s}^{-1}\), while the full width at half-maximum (FWHM) of the line profile ranges from 40 to \(50~\text{km}\,\text{s}^{-1}\). The portion of the observed field closest to the limb shows some artifacts likely due to increased scattered and/or a near-limb ghost image. Note that the inner field edge corresponds to the edge of the 5-arcmin occulter deployed at the Gregorian Optical Station and the two black square areas near \(\langle -950,370\rangle \) and \(\langle -890,520\rangle \) are regions where the limb sensors block the off-limb field (see Rimmele et al., 2020 for more details). Analysis of the polarized quantities is pending.
6 Summary and Outlook
As one of the first-light facility instruments of DKIST, the Cryo-NIRSP is a powerful and versatile tool for the study of our Sun that enables frontier diagnostics in the infrared spectrum at wavelengths up to 5 μm. As showcased here, early operations of Cryo-NIRSP are already underway, as is the acquisition of the first science data in support of experiments proposed by the solar research community (Tritschler et al., 2023). Data-calibration strategies are currently being refined in support of the Level 1 pipeline at the DKIST Data Center (Davey et al., 2023). Together with the many supporting and interfacing DKIST systems and personnel, Cryo-NIRSP is well positioned to help advance our understanding of the solar atmosphere.
Looking ahead, a number of upgrades (or potential upgrades) are in various stages of development that will improve current Cryo-NIRSP performance and/or expand its capabilities in the future. To highlight a few, these include:
-
A new FIDO short-pass beamsplitter to be installed at the M9a location to allow co-operability with the AO-corrected instruments.
-
New fast-readout infrared detectors to replace the existing devices.
-
The implementation of a low-dispersion spectral mode to permit multiple coronal lines to be observed simultaneously and provision for a multi-slit mode that increases scanning cadences of large fields of view.
-
An expanded filter set to survey and explore potentially valuable diagnostics in the infrared currently not used; see, e.g., review by Del Zanna and DeLuca (2018).
In addition, Cryo-NIRSP will undergo continued software and mechanical enhancements aimed at optimizing its scientific return.
Code Availability
The Cryo-NIRSP Instrument Performance Calculator is publicly available on the NSO website at nso.edu/telescopes/dkist/instruments/cryo-nirsp/.
References
Asensio Ramos, A., Trujillo Bueno, J., Carlsson, M., Cernicharo, J.: 2003, Nonequilibrium CO chemistry in the solar atmosphere. Astrophys. J. Lett. 588, L61. DOI. ADS.
Ayres, T.R., Brault, J.W.: 1990, Fourier transform spectrometer observations of solar carbon monoxide. III. Time-resolved spectroscopy of the Delta \(\text{V} = 1\) bands. Astrophys. J. 363, 705. DOI. ADS.
Beckers, J.M., Kuhn, J., Neidig, D., Rabin, R., Rimmele, T., Smartt, R.N.: 1995, CLEAR: a concept for a “Coronagraph and low emissivity astronomical reflector” for solar and nighttime observations. In: AAS/Solar Physics Division Meeting 26, 7.22. ADS.
Beletic, J.W., Blank, R., Gulbransen, D., Lee, D., Loose, M., Piquette, E.C., Sprafke, T., Tennant, W.E., Zandian, M., Zino, J.: 2008, Teledyne imaging sensors: infrared imaging technologies for astronomy and civil space. In: Dorn, D.A., Holland, A.D. (eds.) High Energy, Optical, and Infrared Detectors for Astronomy III, Proc. Soc. Photo-Opt. Instrum. Eng. (SPIE) 7021, 70210H. DOI.
Berst, C.: 2021, CSS functional interface. Technical Report SPEC-0098 Rev F, National Solar Observatory, Boulder, CO.
Borrero, J.M., Asensio Ramos, A., Collados, M., Schlichenmaier, R., Balthasar, H., Franz, M., Rezaei, R., Kiess, C., Orozco Suárez, D., Pastor Yabar, A., Berkefeld, T., von der Lühe, O., Schmidt, D., Schmidt, W., Sigwarth, M., Soltau, D., Volkmer, R., Waldmann, T., Denker, C., Hofmann, A., Staude, J., Strassmeier, K.G., Feller, A., Lagg, A., Solanki, S.K., Sobotka, M., Nicklas, H.: 2016, Deep probing of the photospheric sunspot penumbra: no evidence of field-free gaps. Astron. Astrophys. 596, A2. DOI. ADS.
Casini, R., White, S.M., Judge, P.G.: 2017, Magnetic diagnostics of the solar corona: synthesizing optical and radio techniques. Space Sci. Rev. 210, 145. DOI. ADS.
Cowan, B., Wampler, S.: 2011, Technologies for high speed data handling in the ATST. In: Evans, I.N., Accomazzi, A., Mink, D.J., Rots, A.H. (eds.) Astronomical Data Analysis Software and Systems XX CS-442, Astron. Soc. Pacific, San Francisco, 297. ADS.
da Silva Santos, J.M., de la Cruz Rodríguez, J., Leenaarts, J., Chintzoglou, G., De Pontieu, B., Wedemeyer, S., Szydlarski, M.: 2020, The multi-thermal chromosphere. Inversions of ALMA and IRIS data. Astron. Astrophys. 634, A56. DOI. ADS.
Davey, A., et al.: 2023, The DKIST Data Center. Solar Phys. In preparation.
de Wijn, A.G., Casini, R., Carlile, A., Lecinski, A.R., Sewell, S., Zmarzly, P., Eigenbrot, A.D., Beck, C., Wöger, F., Knölker, M.: 2022, The visible spectro-polarimeter of the Daniel K. Inouye Solar Telescope. Solar Phys. 297, 22. DOI. ADS.
Del Zanna, G., DeLuca, E.E.: 2018, Solar coronal lines in the visible and infrared: a rough guide. Astrophys. J. 852, 52. DOI. ADS.
Evans, J.W.: 1948, Photometer for measurement of sky brightness near the Sun. J. Opt. Soc. Am. 38, 1083. ADS.
Fehlmann, A., Giebink, C., Kuhn, J.R., Messersmith, E.J., Mickey, D.L., Scholl, I.F., James, D., Hnat, K., Schickling, G., Schickling, R.: 2016, Cryogenic near infrared spectropolarimeter for the Daniel K. Inouye Solar Telescope. In: Evans, C.J., Simard, L., Takami, H. (eds.) Ground-based and Airborne Instrumentation for Astronomy VI, Proc. Soc. Photo-Opt. Instrum. Eng. (SPIE) 9908, 99084D. DOI.
Ferayorni, A., Beard, A., Berst, C., Goodrich, B.: 2014, DKIST controls model for synchronization of instrument cameras, polarization modulators, and mechanisms. In: Chiozzi, G., Radziwill, N.M. (eds.) Software and Cyberinfrastructure for Astronomy III, Proc. Soc. Photo-Opt. Instrum. Eng. (SPIE) CS-9152, 91520Z. DOI. ADS.
Gil, M.A., Simon, J.M.: 1983, New plane grating monochromator with off-axis parabolical mirrors. Appl. Opt. 22, 152. DOI.
Goorvitch, D.: 1994, Infrared CO line list for the X 1 Sigma + state. Astrophys. J. Suppl. 95, 535. DOI. ADS.
Guzzo, S., Cummings, K., Hubbard, J., Wampler, S., Goodrich, B.: 2021, CSS functional interface. Technical Report SPEC-0022-2 Rev N, National Solar Observatory, Boulder, CO.
Harrington, D.M.: 2023, Large aperture retarders for astronomical instruments: MgF2 optical contact, DKIST calibrators & modulators. J. Astron. Tel. Instrum. Sys. In preparation.
Harrington, D.M., Sueoka, S.R.: 2018, Polarization modeling and predictions for Daniel K. Inouye Solar Telescope part 4: calibration accuracy over field of view, retardance spatial uniformity, and achromat design sensitivity. J. Astron. Tel. Instrum. Sys. 4, 1. DOI.
Harrington, D.M., Sueoka, S.R., Schad, T.A., Beck, C., Eigenbrot, A.D., de Wijn, A.G., Casini, R., White, A.J., Jaeggli, S.A.: 2023, Systems approach to polarization calibration for the Daniel K. Inouye Solar Telescope. Solar Phys. 298. DOI.
Harvey, J.W.: 1969, Magnetic fields associated with solar active-region prominences. PhD thesis, Univ. Colorado. ADS.
Hubbard, J., Goodrich, B., Wampler, S.: 2010, The ATST base: command-action-response in action. In: Radziwill, N.M., Bridger, A. (eds.) Software and Cyberinfrastructure for Astronomy, Proc. Soc. Photo-Opt. Instrum. Eng. (SPIE) CS-7740, 77402R. DOI. ADS.
Hyvärinen, A., Oja, E.: 2000, Independent component analysis: algorithms and applications. Neural Net. 13, 411. DOI.
Iglesias, F.A., Feller, A.: 2019, Instrumentation for solar spectropolarimetry: state of the art and prospects. Opt. Eng. 58, 082417. DOI. ADS.
Jaeggli, S.A., Lin, H., Onaka, P., Yamada, H., Anan, T., Bonnet, M., Ching, G., Huang, X.-P., Kramar, M., McGregor, H., Nitta, G., Rae, C., Robertson, L., Schad, T.A., Toyama, P., Young, J., Berst, C., Harrington, D.M., Liang, M., Puentes, M., Sekulic, P., Smith, B., Sueoka, S.R.: 2022, The Diffraction-Limited Near-Infrared Spectropolarimeter (DL-NIRSP) of the Daniel K. Inouye Solar Telescope (DKIST). Solar Phys. 297, 137. DOI. ADS.
Kerber, F., Nave, G., Sansonetti, C.J.: 2008, The spectrum of Th-Ar hollow cathode lamps in the 691 – 5804 nm region: establishing wavelength standards for the calibration of infrared spectrographs. Astron. Astrophys. Suppl. Ser. 178, 374. DOI.
Kuhn, J.R., Penn, M.: 1995, Infrared Tools for Solar Astrophysics: What’s Next? Proc. 15th National Solar Observatory/Sacramento Peak Summer Workshop, World Scientific, Singapore. ADS.
Kuhn, J.R., Hawley, S.L.: 1999, Some astronomical performance advantages of off-axis telescopes. Publ. Astron. Soc. Pac. 111, 601. DOI. ADS.
Kuhn, J.R., Penn, M.J., Mann, I.: 1996, The near-infrared coronal spectrum. Astrophys. J. 456, L67. DOI. ADS.
Kuhn, J.R., MacQueen, R.M., Streete, J., Tansey, G., Mann, I., Hillebrand, P., Coulter, R., Lin, H., Edmunds, D., Judge, P.: 1999, Probable detection of a bright infrared coronal emission line of Si ix near 3.93 microns. Astrophys. J. 521, 478. DOI. ADS.
Lemen, J.R., Title, A.M., Akin, D.J., Boerner, P.F., Chou, C., Drake, J.F., Duncan, D.W., Edwards, C.G., Friedlaender, F.M., Heyman, G.F., Hurlburt, N.E., Katz, N.L., Kushner, G.D., Levay, M., Lindgren, R.W., Mathur, D.P., McFeaters, E.L., Mitchell, S., Rehse, R.A., Schrijver, C.J., Springer, L.A., Stern, R.A., Tarbell, T.D., Wuelser, J.-P., Wolfson, C.J., Yanari, C., Bookbinder, J.A., Cheimets, P.N., Caldwell, D., Deluca, E.E., Gates, R., Golub, L., Park, S., Podgorski, W.A., Bush, R.I., Scherrer, P.H., Gummin, M.A., Smith, P., Auker, G., Jerram, P., Pool, P., Soufli, R., Windt, D.L., Beardsley, S., Clapp, M., Lang, J., Waltham, N.: 2011, The Atmospheric Imaging Assembly (AIA) on the Solar Dynamics Observatory (SDO). Solar Phys. 275, 17. DOI. ADS.
Lin, H., Kuhn, J.R., Coulter, R.: 2004, Coronal magnetic field measurements. Astrophys. J. Lett. 613, L177. DOI. ADS.
McPherson, M.R., Lin, H., Kuhn, J.R.: 1992, Infrared array measurements of sunspot magnetic fields. Solar Phys. 139, 255. DOI. ADS.
Mickey, D.L.: 1973, Polarization measurements in the green coronal line. Astrophys. J. Lett. 181, L19. DOI. ADS.
Noyes, R.W., Hall, D.N.B.: 1972, Thermal oscillations in the high solar photosphere. Astrophys. J. Lett. 176, L89. DOI. ADS.
Orozco Suárez, D., Quintero Noda, C., Ruiz Cobo, B., Collados Vera, M., Felipe, T.: 2017, Detection of emission in the Si i 1082.7 nm line core in sunspot umbrae. Astron. Astrophys. 607, A102. DOI. ADS.
Penn, M.J.: 2014, Infrared solar physics. Living Rev. Solar Phys. 11, 2. DOI. ADS.
Penn, M.J., Schad, T., Cox, E.: 2011, Probing the solar atmosphere using oscillations of infrared CO spectral lines. Astrophys. J. 734, 47. DOI. ADS.
Pesnell, W.D., Thompson, B.J., Chamberlin, P.C.: 2012, The Solar Dynamics Observatory (SDO). Solar Phys. 275, 3. DOI. ADS.
Rabin, D., Jefferies, J., Lindsey, C.: 1994, Infrared Solar Physics: Proc. Internat. Astron. Union Symp. 154, Reidel, Dordrecht. ADS.
Rabin, D., Jaksha, D., Plymate, C., Wagner, J., Iwata, K.: 1991, Plage magnetic field strengths from near-infrared spectra. In: November, L.J. (ed.) Solar Polarimetry, Proc. 11th Sacramento Peak Summer Workshop, National Solar Observatory, Sunspot, 361. ADS.
Rast, M.P., Bello González, N., Bellot Rubio, L., Cao, W., Cauzzi, G., Deluca, E., de Pontieu, B., Fletcher, L., Gibson, S.E., Judge, P.G., Katsukawa, Y., Kazachenko, M.D., Khomenko, E., Landi, E., Martínez Pillet, V., Petrie, G.J.D., Qiu, J., Rachmeler, L.A., Rempel, M., Schmidt, W., Scullion, E., Sun, X., Welsch, B.T., Andretta, V., Antolin, P., Ayres, T.R., Balasubramaniam, K.S., Ballai, I., Berger, T.E., Bradshaw, S.J., Campbell, R.J., Carlsson, M., Casini, R., Centeno, R., Cranmer, S.R., Criscuoli, S., Deforest, C., Deng, Y., Erdélyi, R., Fedun, V., Fischer, C.E., González Manrique, S.J., Hahn, M., Harra, L., Henriques, V.M.J., Hurlburt, N.E., Jaeggli, S., Jafarzadeh, S., Jain, R., Jefferies, S.M., Keys, P.H., Kowalski, A.F., Kuckein, C., Kuhn, J.R., Kuridze, D., Liu, J., Liu, W., Longcope, D., Mathioudakis, M., McAteer, R.T.J., McIntosh, S.W., McKenzie, D.E., Miralles, M.P., Morton, R.J., Muglach, K., Nelson, C.J., Panesar, N.K., Parenti, S., Parnell, C.E., Poduval, B., Reardon, K.P., Reep, J.W., Schad, T.A., Schmit, D., Sharma, R., Socas-Navarro, H., Srivastava, A.K., Sterling, A.C., Suematsu, Y., Tarr, L.A., Tiwari, S., Tritschler, A., Verth, G., Vourlidas, A., Wang, H., Wang, Y.-M. (NSO and DKIST Project, DKIST Instrument Scientists, DKIST Science Working Group, DKIST Critical Science Plan Community): 2021, Critical science plan for the Daniel K. Inouye Solar Telescope (DKIST). Solar Phys. 296, 70. DOI. ADS.
Rauscher, B.J., Fox, O., Ferruit, P., Hill, R.J., Waczynski, A., Wen, Y., Xia-Serafino, W., Mott, B., Alexander, D., Brambora, C.K., Derro, R., Engler, C., Garrison, M.B., Johnson, T., Manthripragada, S.S., Marsh, J.M., Marshall, C., Martineau, R.J., Shakoorzadeh, K.B., Wilson, D., Roher, W.D., Smith, M., Cabelli, C., Garnett, J., Loose, M., Wong-Anglin, S., Zandian, M., Cheng, E., Ellis, T., Howe, B., Jurado, M., Lee, G., Nieznanski, J., Wallis, P., York, J., Regan, M.W., Hall, D.N.B., Hodapp, K.W., Boker, T., Marchi, G.D., Jakobsen, P., Strada, P.: 2007, Detectors for the James Webb Space Telescope near-infrared spectrograph. I. Readout mode, noise model, and calibration considerations. Publ. Astron. Soc. Pac. 119, 768. ISBN 0004-6280. DOI.
Rimmele, T.: 2005, ATST Science Requirement Document (SRD). Technical Report SPEC-0001 Rev B, National Solar Observatory, Tucson, AZ. nso.edu/wp-content/uploads/2020/10/SPEC-0001_SRD_RevB.pdf.
Rimmele, T.R., Warner, M., Keil, S.L., Goode, P.R., Knölker, M., Kuhn, J.R., Rosner, R.R., McMullin, J.P., Casini, R., Lin, H., Wöger, F., von der Lühe, O., Tritschler, A., Davey, A., de Wijn, A., Elmore, D.F., Fehlmann, A., Harrington, D.M., Jaeggli, S.A., Rast, M.P., Schad, T.A., Schmidt, W., Mathioudakis, M., Mickey, D.L., Anan, T., Beck, C., Marshall, H.K., Jeffers, P.F., Oschmann, J.M., Beard, A., Berst, D.C., Cowan, B.A., Craig, S.C., Cross, E., Cummings, B.K., Donnelly, C., de Vanssay, J.-B., Eigenbrot, A.D., Ferayorni, A., Foster, C., Galapon, C.A., Gedrites, C., Gonzales, K., Goodrich, B.D., Gregory, B.S., Guzman, S.S., Guzzo, S., Hegwer, S., Hubbard, R.P., Hubbard, J.R., Johansson, E.M., Johnson, L.C., Liang, C., Liang, M., McQuillen, I., Mayer, C., Newman, K., Onodera, B., Phelps, L., Puentes, M.M., Richards, C., Rimmele, L.M., Sekulic, P., Shimko, S.R., Simison, B.E., Smith, B., Starman, E., Sueoka, S.R., Summers, R.T., Szabo, A., Szabo, L., Wampler, S.B., Williams, T.R., White, C.: 2020, The Daniel K. Inouye Solar Telescope – observatory overview. Solar Phys. 295, 172. DOI. ADS.
Samra, J.E., Madsen, C.A., Cheimets, P., DeLuca, E.E., Golub, L., Marquez, V., Reyes, N.T.: 2022, New observations of the IR emission corona from the 2019 July 2 eclipse flight of the Airborne Infrared Spectrometer. Astrophys. J. 933, 82. DOI. ADS.
Schad, T., Dima, G.: 2020, Forward synthesis of polarized emission in target DKIST coronal lines applied to 3D MURaM coronal simulations. Solar Phys. 295, 98. DOI. ADS.
Schad, T.A., Penn, M.J., Lin, H.: 2013, He i vector magnetometry of field-aligned superpenumbral fibrils. Astrophys. J. 768, 111. DOI. ADS.
Scherrer, P.H., Schou, J., Bush, R.I., Kosovichev, A.G., Bogart, R.S., Hoeksema, J.T., Liu, Y., Duvall, T.L., Zhao, J., Title, A.M., Schrijver, C.J., Tarbell, T.D., Tomczyk, S.: 2012, The Helioseismic and Magnetic Imager (HMI) investigation for the Solar Dynamics Observatory (SDO). Solar Phys. 275, 207. DOI. ADS.
Schieffer, S.L., Rimington, N.W., Nayyar, V.P., Schroeder, W.A., Longworth, J.W.: 2007, High-resolution, flat-field, plane-grating, f/10 spectrograph with off-axis parabolic mirrors. Appl. Opt. 46, 3095. DOI.
Tritschler, A., et al.: 2023, The DKIST operations. Solar Phys. In preparation.
Uitenbroek, H.: 2000, The CO fundamental vibration-rotation lines in the solar spectrum. II. Non-LTE transfer modeling in static and dynamic atmospheres. Astrophys. J. 536, 481. DOI. ADS.
Uitenbroek, H., Noyes, R.W., Rabin, D.: 1994, Imaging spectroscopy of the solar CO lines at 4.67 microns. Astrophys. J. Lett. 432, L67. DOI. ADS.
von der Lühe, O., et al.: 2023, The DKIST visible tunable filter. Solar Phys. In preparation.
Williams, R.J., Borrowman, A.J., Greer, A., Yoshimura, A., Fehlmann, A., Goodrich, B.D., Hubbard, J.R., Scholl, I.F.: 2019, Building the control system to operate the cryogenic near infrared spectropolarimeter instrument for the Daniel K. Inouye Solar Telescope. In: White, K., Brown, K., Dyer, P., Schaa, V.R. (eds.) Proc. Internat. Conf. Accelerator Large Exp. Phys. Control Systems, JACoW, Geneva, 1568. DOI.
Williams, R., Hubbard, J.R., Scholl, I.F., Fehlmann, A., Greer, A., Goodrich, B.D.: 2020, Building the on-summit data processing pipeline for the cryogenic near infrared spectropolarimeter instrument on the Daniel K. Inouye Solar Telescope. In: Guzman, J.C., Ibsen, J. (eds.) Software and Cyberinfrastructure for Astronomy VI, Proc. Soc. Photo-Opt. Instrum. Eng. (SPIE) 11452, 196. DOI.
Wöger, F., Rimmele, T., Ferayorni, A., Beard, A., Gregory, B.S., Sekulic, P., Hegwer, S.L.: 2021, The Daniel K. Inouye Solar Telescope (DKIST)/Visible Broadband Imager (VBI). Solar Phys. 296, 145. DOI. ADS.
Yang, X., Cao, W., Gorceix, N., Plymate, C., Shumoko, S., Bai, X., Penn, M., Ayres, T., Coulter, R., Goode, P.R.: 2020, CYRA: the cryogenic infrared spectrograph for the Goode Solar Telescope in Big Bear. In: Evans, C.J., Bryant, J.J., Motohara, K. (eds.) Ground-Based and Airborne Instrumentation for Astronomy VIII, Proc. Soc. Photo-Opt. Instrum. Eng. (SPIE) 11447, 2233. DOI.
Acknowledgments
The research reported herein is based in part on data collected with the Daniel K. Inouye Solar Telescope (DKIST), a facility of the National Solar Observatory (NSO). NSO is managed by the Association of Universities for Research in Astronomy, Inc. and is funded by the National Science Foundation. Any opinions, findings, and conclusions or recommendations expressed in this publication are those of the authors and do not necessarily reflect the views of the National Science Foundation or the Association of Universities for Research in Astronomy, Inc. DKIST is located on land of spiritual and cultural significance to Native Hawaiian people. The use of this important site to further scientific knowledge is done so with appreciation and respect.
The authors would like to thank supporting staff members at the University of Hawai´i Institute for Astronomy who assisted with this project, including Michael Maberry, Matt Maynard, Tom McCall, John Messersmith, John Meyer, Garry Nitta, and Joey Perreira. We would also like to thank all Akamai and other interns Jaren Ashcraft, Elisa Carli, Sydney Dupasquier, Mark Galiza, Joey Hashimoto, Lynzee Hoegger, Ethan Lee, Keoki Massad, Joshua Parep, Sebastian Rodriguez, and Chase Urasaki, who have contributed to our efforts over the years. Finally, we wish to thank the entire DKIST team, especially the construction and operations teams, and the following individuals: Shawn Culver, Stephanie Guzman, Stephen Guzzo, David Harrington, John Hubbard, Paul Jeffers, Heather Marshall, Thomas Rimmele, Richard Summers, Alexandra Tritschler, and Friedrich Wöger.
SDO data courtesy of NASA/SDO and the AIA and HMI science teams.
Funding
The research reported herein is based in part on data collected with the Daniel K. Inouye Solar Telescope (DKIST), a facility of the National Solar Observatory (NSO). NSO is managed by the Association of Universities for Research in Astronomy, Inc., and it is funded by the National Science Foundation. Open Access funding for this article has been provided by NSO.
Author information
Authors and Affiliations
Contributions
Funding acquisition: A. Fehlmann, J. Kuhn, I. Scholl, D. Mickey, and C. Giebink; Instrument Implementation: A. Fehlmann, J. Kuhn, I. Scholl, C. Giebink, R. Agdinoay, S. Craig, B. Goodrich, K. Hnat, D. James, C. Lockhart, D. Oswald, M. Puentes, R. Schickling, J.B. de Vanssay, and E. Warmbier; Software: A. Fehlmann, I. Scholl, C. Giebink, R. Williams, and C. Berst; Data Analysis: A. Fehlmann, J. Kuhn, and T. Schad; Writing – original draft preparation: A. Fehlmann, J. Kuhn, and T. Schad; Writing – review and editing: all authors.
Corresponding author
Ethics declarations
Competing Interests
The authors declare that they have no conflicts of interest.
Additional information
Publisher’s Note
Springer Nature remains neutral with regard to jurisdictional claims in published maps and institutional affiliations.
This article belongs to the Topical Collection:
The Daniel K. Inouye Solar Telescope (DKIST)
Guest Editors: Thomas R. Rimmele, Philip R. Goode, Michael Knölker, Jeffrey R. Kuhn, and Robert Rosner
Rights and permissions
Open Access This article is licensed under a Creative Commons Attribution 4.0 International License, which permits use, sharing, adaptation, distribution and reproduction in any medium or format, as long as you give appropriate credit to the original author(s) and the source, provide a link to the Creative Commons licence, and indicate if changes were made. The images or other third party material in this article are included in the article’s Creative Commons licence, unless indicated otherwise in a credit line to the material. If material is not included in the article’s Creative Commons licence and your intended use is not permitted by statutory regulation or exceeds the permitted use, you will need to obtain permission directly from the copyright holder. To view a copy of this licence, visit http://creativecommons.org/licenses/by/4.0/.
About this article

Cite this article
Fehlmann, A., Kuhn, J.R., Schad, T.A. et al. The Daniel K. Inouye Solar Telescope (DKIST) Cryogenic Near-Infrared Spectro-Polarimeter. Sol Phys 298, 5 (2023). https://doi.org/10.1007/s11207-022-02098-y
Received:
Accepted:
Published:
DOI: https://doi.org/10.1007/s11207-022-02098-y