
Abstract
This study investigates the extent to which scholarly tweets of scientific papers are engaged with by Twitter users through four types of user engagement behaviors, i.e., liking, retweeting, quoting, and replying. Based on a sample consisting of 7 million scholarly tweets of Web of Science papers, our results show that likes is the most prevalent engagement metric, covering 44% of scholarly tweets, followed by retweets (36%), whereas quotes and replies are only present for 9% and 7% of all scholarly tweets, respectively. From a disciplinary point of view, scholarly tweets in the field of Social Sciences and Humanities are more likely to trigger user engagement over other subject fields. The presence of user engagement is more associated with other Twitter-based factors (e.g., number of mentioned users in tweets and number of followers of users) than with science-based factors (e.g., citations and Mendeley readers of tweeted papers). Building on these findings, this study sheds light on the possibility to apply user engagement metrics in measuring deeper levels of Twitter reception of scholarly information.
Introduction
With the growing enthusiasm for sharing scholarly information via Twitter, tweets mentioning scientific papers (hereinafter “scholarly tweets”) are widespread. In the altmetrics realm, Twitter has arguably become one of the most crucial data sources, with more than one third of recent scientific papers being tweeted (Fang et al., 2020a). Scholarly tweets, therefore, have long been seen as measureable traces possibly capturing the impact of research outputs in a broader sense (Bornmann & Haunschild, 2016; Eysenbach, 2011).
Instead of merely serving as countable information carriers bringing scientific papers to the attention of Twitter users, scholarly tweets per se are also informative in terms of the content incorporated, the characteristics of users involved, as well as the possible user engagement triggered. In other words, the creation of scholarly tweets stands not only for an outcome of Twitter reception of science by users who posted them, but also a prologue of another narrative about how other users might interact with them in the Twitter universe, being relevant to quantitative elaboration of science–social media interactions (Costas et al., 2021).
Scholarly tweets as the objects of study
Díaz-Faes et al. (2019) proposed the umbrella term secondary social media metrics to conceptualize metrics taking “social media objects” (i.e., social media users and their online activities) as the objects of study, distinguishing them from primary social media metrics which focus on “research objects” (e.g., publications, datasets, journals, and individual scholars), in particular “the use and visibility of publications on social media”. To date, in the direction of secondary social media metrics, many research efforts centering on scholarly tweets have been made to characterize the mechanisms of how Twitter users process, circulate, and engage with scholarly information from different perspectives.
At the tweet level, tweet content analyses provide straightforward insights into the tweeting behavior of users who are disseminating scholarly information. For example, by scrutinizing the content of scholarly tweets received by the top ten most tweeted papers in the field of dentistry, Robinson-Garcia et al. (2017) exemplified the scarce existence of original thought but more mechanical nature of the bulk of tweet content. Similarly, with a case study containing 270 tweets, Thelwall et al. (2013) reported that the majority of the observed scholarly tweets only echoed a paper title or presented a brief summary. Regarding the sentiment of tweet texts, scholarly tweets were found to be generally neutral, with limited share showing positive or negative sentiment expressed by users (Friedrich et al., 2015; Thelwall et al., 2013). Besides, the use of some tweet features in scholarly tweets, such as hashtags (word or phrase prefixed with #) and user mentions (user’s handle name prefixed with @), was also of interest by some altmetric research (Haustein et al., 2014a; Xu et al., 2018), because it represents a particular form of user interactions enhancing the description and visibility of tweets and facilitating connections amongst users (Haustein, 2019; Holmberg et al., 2014).
At the user level, the presence of scholarly tweets makes it possible to recognize and characterize users discussing science on Twitter. Scholarly tweets, therefore, were drawn upon for identifying and classifying Twitter users participating in scholarly communication (Costas et al., 2020; Díaz-Faes et al., 2019; Vainio & Holmberg, 2017; Yu et al., 2019), and for further exploring how users by type performed differently while utilizing Twitter for scholarly communication (Didegah et al., 2018; Holmberg & Thelwall, 2014; Mohammadi et al., 2018; Yu, 2017). Besides the research on the characterization of individual users who posted scholarly tweets, the Twitter uptake and usage of various scholarly entities, such as scholarly book publishers (Wang & Zuccala, 2021), scholarly journals (Zheng et al., 2019), and universities (Yolcu, 2013), is also an important topic in the direction of secondary social media metrics. Moreover, the aforementioned objects derived from scholarly tweets, either at the tweet or user level, were not only studied separately, but sometimes networked in different ways to map the contexts in which Twitter interactions with science happened. The network methods include but not limited to co-occurrence of hashtags (Haunschild et al., 2019), co-occurrence of users and hashtags (Hellsten & Leydesdorff, 2020), user mentions network (Said et al., 2019), and follower/friend network of users (Alperin et al., 2019; Robinson-Garcia et al., 2018), which were collectively conceptualized as heterogeneous couplings by Costas et al. (2021).
User engagement behaviors around scholarly tweets
In addition to tweet content and user characteristics, user engagement behaviorFootnote 1 around scholarly tweets is also a focal point of secondary social media metrics. Conceptually speaking, scholarly tweets offer the possibility for a wider range of users to participate in science-focused discussions through many engagement behaviors enabled by Twitter. In the current platform version (2021), Twitter provides several engagement functionalities for users to interact with tweets on their own initiative. As illustrated with a tweet example in Fig. 1, there are four main types of engagement functionalities with corresponding metrics visible at the bottom of tweets and publicly retrievable through the Twitter API, including (1) like, (2) retweet, (3) quote tweet, and (4) reply. These engagement behaviors differ in both input and output. In terms of input, liking and retweeting are relatively basic and simple engagement behaviors because they are both devoid of extra original content added, whereas quoting and replying are comparatively more informative and conversational because they enable users to express original thought and content. As to output, except liking, the other three types of engagement behaviors can produce new tweets (i.e., retweets, quote tweets, and replies) which are accounted for users’ total number of tweets posted.

User engagement functionalities and metrics embedded in a tweet example
In existing altmetric literature, retweeting is the most analyzed user engagement behavior. In 2010, Priem and Costello (2010) found that retweets, as the outcomes of retweeting behavior, only made up 19% of a sample of scholarly tweets posted by 28 academic users. However, in more recent research, it was generally reported that retweets accounted for close to or over half of scholarly tweets of papers (Alperin et al., 2019; Didegah et al., 2018; Haustein, 2019), being a key component of the data base of studies related to scholarly Twitter metrics. For a sample of tweets posted by the Twitter accounts of 25 U.S. health agencies, Bhattacharya et al. (2014) found that about one third of them had zero retweet while the rest were retweeted at least once. As a form of information diffusion in nature, retweets were often analyzed to help capture topics of the public’s interest in sharing (Bhattacharya et al., 2014; Kahle et al., 2016), or to construct Twitter dissemination networks of scientific knowledge across communities (Araujo, 2020; Hassan et al., 2019).
Besides retweeting, other types of user engagement behaviors, such as liking, replying, and clicking, were also studied to help yield insights into whether and how the public engages with scholarly information on Twitter. For instance, considering a spectrum of user engagement metrics (e.g., retweets, likes, replies, clicks on tweeted URLs), Kahle et al. (2016) studied the rates of user engagement with the tweets posted by the official Twitter accounts of the European Organization for Nuclear Research (CERN). Mohammadi et al. (2018) surveyed the motivations behind users’ liking and retweeting behaviors in scientific contexts and reported that most survey respondents liked a tweet to “inform the authors that their tweets were interesting” and retweeted for the sake of disseminating the tweets. Based on the click metrics data provided by Bitly for its generated short links, Fang et al. (2021) analyzed the click rates on Twitter of short links referring to scientific papers and concluded that nearly half of the studied scholarly short links were not clicked by Twitter users at all.
Objectives
Although some attempts so far have been made to enhance the understanding of how people react to scholarly tweets, existing literature generally focused on either a specific user engagement behavior or a specific discipline. Little is known about the overall picture of the coverage of diverse types of user engagement with science on Twitter. User engagement metrics are promising component of secondary social media metrics, because they have the potential to assess the effectiveness of scholarly tweets in disseminating scholarly information, thus offering the possibility to measure the attention received by scientific papers from wider audiences. Given that sufficient data presence is one of the key preconditions for applying metrics in practice (Fang et al., 2020a), it is important to unravel the overall presence of different user engagement metrics amongst scholarly tweets in advance. Against this background, on the basis of a large-scale and cross-disciplinary dataset, the main research objective of this study is to systematically unravel the extent to which scholarly tweets are related to different categories of user engagement. Specifically, this study sets out to address the following research questions (RQs):
- RQ1:
-
To what extent do Twitter users engage with scholarly tweets through different types of behaviors (i.e., liking, retweeting, quoting, and replying)?
- RQ2:
-
Which research fields tend to attract the highest levels of user engagement on Twitter?
- RQ3:
-
How does user engagement (both presence and frequency) correlate with other types of science-based and Twitter-based factors, such as the scholarly impact of tweeted papers, use of tweet features on the platform, and user characteristics?
Data and methods
Dataset
We retrieved a total of 6,229,001 Web of Science-indexed (WoS) papers published between 2016 and 2018 from the CWTS in-house database, and searched their scholarly tweets recorded by Altmetric.com until October 2019. For the matching with Altmetric.com data, WoS papers are restricted to those with DOI or PubMed ID assigned. On the whole, there are 1,999,199 WoS papers (accounting for 32.1%) with at least one scholarly tweet received, totally generating 7,037,233 unique original scholarly tweets.Footnote 2 Note that to explore user engagement behaviors, in this study the analyzed scholarly tweets are limited to original tweets which can be engaged with through the engagement functionalities provided by Twitter.
For the approximately 7 million scholarly tweets in our dataset, we retrieved their engagement metrics (i.e., number of likes, retweets, quotes, and replies received) with the Twitter API in February 2021.
The CWTS publication-level classification
To compare the user engagement situations of scholarly tweets across subject fields of science, we applied the CWTS publication-level classification system (Waltman & Van Eck, 2012) to assign scholarly tweets with subject field information based on their mentioned scientific papers. The CWTS classification clusters WoS papers into micro-level fields based on their citation relationships. These micro-level fields are then algorithmically assigned to five main subject fields of science, including Social Sciences and Humanities (SSH), Biomedical and Health Sciences (BHS), Physical Sciences and Engineering (PSE), Life and Earth Sciences (LES), and Mathematics and Computer Science (MCS).Footnote 3 For our dataset, there are a total of 5,932,279 scholarly tweets (accounting for 84.3%) referring to scientific papers with the subject field information assigned by the CWTS classification system. This set of scholarly tweets was drawn as a subsample for studying the subject field differences of user engagement. Table 1 presents the distribution of the analyzed scientific papers and scholarly tweets across the five subject fields of science.Footnote 4
Science-based and Twitter-based factors of scholarly tweets
To explore how the presence of user engagement behaviors associates with scholarly, tweet, and user-related factors of the scholarly tweets, we extracted a total of ten factors from the following three dimensions: (1) scholarly impact of tweeted papers, (2) use of tweet features, and (3) user characteristics of those who posted scholarly tweets.
As listed in Table 2, in the dimension of scholarly impact of tweeted papers, we selected WoS citations and Mendeley readers to reflect the impact of tweeted papers in the science landscape. In the dimension of tweet features, we focused on the use of hashtags (a word or phrase preceded by the sign #) and user mentions (a user handle name preceded by the sign @). Number of hashtags used, and number of users mentioned in tweets were analyzed to reflect how users edit their scholarly tweets with such interactive tweet features. Last but not least, in the dimension of user characteristics, we studied six factors related to users’ demographics and behaviors on Twitter. Thus, number of followers and number of lists in which users are listedFootnote 5 represent social media capital held by users, because these two factors largely affect how broad the audiences can be reached for posted tweets. Number of friends and number of likes given tell the story of how active users interact with other users by following others or liking their tweets. Number of tweets posted by users and their science focus depict users’ overall tweeting behavior. The former indicates how frequent users post all kinds of tweets, while the latter implies how concentrated users are on tweeting scientific papers.
In the “Results” section, the correlations between the four analyzed user engagement metrics and the ten factors were studied based on not only the Spearman correlation analysis of counts (performed by R), but also the visualized change trend of the coverage of user engagement among scholarly tweets aggregated at the different levels of each studied factor (coverage of user engagement refers to proportion of scholarly tweets with at least one specific user engagement received).
Regression analysis: hurdle model
To further investigate how the ten different factors listed in Table 2 can predict user engagement, a regression analysis was implemented by using these ten factors as explanatory variables, as well as the four user engagement metrics (i.e., likes, tweets, quotes, and replies) as response variables. As presented later in the Results section, in consideration of that all of the four user engagement metrics are count data and the data are over-dispersed (data with the variance much greater than the mean value) and zero-inflated (data with excess zero values), we adopted hurdle models (Mullahy, 1986) as our regression models. Given that social media engagement data were generally found to be count data with the characteristics of zero-inflation and over-dispersion, hurdle models have been applied by many previous research to model user engagement on different social media platforms like Twitter (Bhattacharya et al., 2014), Facebook (Bhattacharya et al., 2017; Bohn et al., 2014), and Weibo (Fu & Chau, 2013).
Hurdle model is a two-part regression model that processes the count data as two separate components: one is the zero portion modeling whether an observation takes zero value or non-zero value (typically a binary logit model), while the other is the count portion fitting those non-zero values (a zero-truncated negative binomial model used in this study in consideration of the over-dispersion of the count data). In our case, the zero portion in the hurdle models determines whether a scholarly tweet gets at least one specific user engagement or not, while the count portion models how many times it is engaged with through certain behavior. Therefore, the hurdle models of user engagement metrics allow for the simultaneous modeling of both the odds for scholarly tweets of being engaged with, as well as the frequency of being engaged with by users. We employed the pscl package in R (Zeileis et al., 2008) to construct four hurdle models (mode 1: likes; model 2: retweets; model 3: quotes; model 4: replies).
Results
The Results section consists of four parts. The first part exhibits the overall presence of the four types of user engagement (i.e., likes, retweets, quotes, and replies) among the 7 million scholarly tweets in our dataset. The second part compares the presence of user engagement across scholarly tweets in different subject fields. The third part investigates how both the presence and frequency of user engagement relates to the three dimensions (i.e., scholarly impact, tweet features, and user characteristics) and ten factors listed in Table 2. The last part focuses on the hurdle regression of user engagement metrics.
Overall user engagement with scholarly tweets
Figure 2 illustrates the coverage of the four types of user engagement among the 7 million scholarly tweets. About 52% have been engaged with through at least one of the four analyzed engagement behaviors, namely, the overall coverage of user engagement among scholarly tweets is 52%. Around 20% of scholarly tweets were engaged with by users through only one type of engagement behavior, while as low as 2% got all the four types of engagement. More specifically, the coverage of likes is 44%, followed by retweets 36%. Liking and retweeting appear to be the most prevalent engagement behaviors around scholarly information. In contrast, the coverage of both quotes and replies is relatively scarce. Only 9% of scholarly tweets got quoted by users, and as low as 7% received at least one reply.
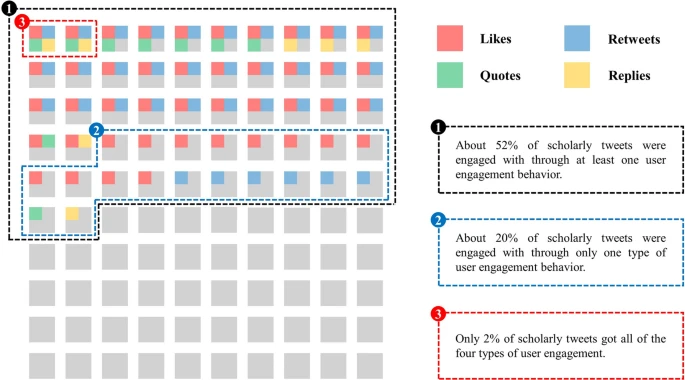
Coverage of the four types of user engagement. Each square represents 1% of scholarly tweets in our dataset. A square tinted with specific color(s) indicates that its represented 1% of scholarly tweets got corresponding type(s) of user engagement. (Color figure online)
Table 3 presents the descriptive statistics of the four engagement metrics to further reflect the extent to which scholarly tweets are engaged with. The coefficient of skewness and quartiles indicate that the distribution of all of the four types of engagement metrics is highly skewed. Only a few scholarly tweets got considerable user engagement, while the majority were never or rarely engaged with by Twitter users. Liking is the most widespread engagement behavior, contributing the most to user engagement metrics, followed by retweeting. On average, scholarly tweets in the dataset have been liked 2.95 times and retweeted 1.91 times. However, quoting and replying are more rare engagement behaviors, with only 1% of scholarly tweets being quoted for at least 3 times (99th percentile of quotes is 3) or replied for at least 2 times (99th percentile of replies is 2), suggesting that only a very limited share of scholarly tweets successfully aroused users’ interest in sharing and communicating their thought within Twitter conversations.
User engagement across subject fields
Figure 3 shows how the coverage of the four types of user engagement varies across the five subject fields of science: Social Sciences and Humanities (SSH), Biomedical and Health Sciences (BHS), Physical Sciences and Engineering (PSE), Life and Earth Sciences (LES), and Mathematics and Computer Science (MCS). Overall, scholarly tweets mentioning SSH papers are more likely to be engaged with through any type of engagement behavior studied. For the field of SSH, the proportion of scholarly tweets with at least one engagement record always ranks first, suggesting the higher probability for SSH-related scholarly information to be engaged with by Twitter users over other subject fields. Besides, scholarly tweets from the fields of LES and BHS also present a relatively stronger potential in attracting different types of user engagement. In comparison, MCS and PSE are the two subject fields with sparser user engagement behaviors observed, showing the lowest coverage of all kinds of studied engagement metrics.

Proportion of scholarly tweets with different levels of A likes, B retweets, C quotes, and D replies across the five subject fields of science. (Color figure online)
The descriptive statistics of user engagement metrics across subject fields presented in Table 4 reinforces the disciplinary differences observed in Fig. 3. Considering the greatest values of indicators highlighted in bold for each engagement metrics (if exists), SSH shows the most extensive distribution of all kinds of user engagement, thus acting as the most active subject field in giving rise to engagement with science on Twitter, followed by LES. BHS, as the subject field with the most scholarly tweets, contributes the most to the overall engagement metrics data due to the largest total number of corresponding engagement records. Besides, scholarly tweets of BHS papers also have a relatively higher presence of user engagement. However, user engagement is confirmed to be sparsely distributed among scholarly tweets in the fields of MCS and PSE.
Correlation analysis of user engagement metrics
In this part, we examine the correlation between different types of user engagement metrics and the ten factors listed in Table 2. We aggregate scholarly tweets into different levels based on the values of each factor, then graphically show the coverage of specific user engagement for scholarly tweets aggregated at different levels of the corresponding factor. We also consider the results of the Spearman correlation analysis between the studied factors and user engagement metrics to further interpret the observed relationships.
From the perspective of scholarly impact of tweeted papers, Fig. 4 plots the change trend of the coverage of user engagement with the increase of (A) citations and (B) Mendeley readers of tweeted papers. Overall, the coverage of all kinds of user engagement is slightly higher for scholarly tweets mentioning papers with higher levels of citation counts and Mendeley readers accrued, although the uptrends are not that strong, particularly for citations. According to the Spearman correlations (see Fig. 7 in the “Appendix”), the four types of user engagement metrics are all positively but negligibly correlated with citations and readers (the coefficient \({r}_{s}\) ranges from 0.016 to 0.048 for citations, and ranges from 0.051 to 0.107 for readers).

Coverage of the four types of user engagement among scholarly tweets with different levels of A WoS citations and B Mendeley readers received by tweeted papers
Regarding tweet features used in scholarly tweets, Fig. 5 shows the coverage of user engagement when different (A) numbers of hashtags are used, and different (B) numbers of users are mentioned in tweets. These two tweet feature factors present different patterns in their relationships with user engagement. As the number of hashtags per tweet increases, a slight rise can be observed in the coverage of likes, retweets, and quotes, but not for replies. This is confirmed by the positive and negligible correlations found between number of hashtags and number of likes, retweets, and quotes received by tweets (\({r}_{s}\) ranges between 0.042 and 0.113), whereas nearly no correlation found between number of hashtags and number of replies (\({r}_{s}\) = − 0.001). By comparison, findings show that when there is an increase in the number of users mentioned in tweets, the engagement trend is stronger, and this is especially for likes and retweets. When more than two users are mentioned in a tweet, the potential for being liked is over 80%, and the potential for being retweeted is 70%. Similarly, the coverage of both quotes and replies is relatively higher for scholarly tweets with more users mentioned than those without any mentioned users. Correspondingly, the Spearman correlations between user engagement metrics and number of mentioned users are comparatively stronger than other factors mentioned earlier, particularly for likes (\({r}_{s}\) = 0.237) and retweets (\({r}_{s}\) = 0.229).

Coverage of the four types of user engagement among scholarly tweets with different numbers of A hashtags used and B users mentioned in tweets
In terms of user characteristics, Fig. 6 shows the coverage of user engagement for scholarly tweets posted by users with different characteristics. Specifically, Fig. 6(A) and (B) exhibit the change trend of the likelihood of being engaged with for scholarly tweets from users with different levels of followers and lists listed, respectively. These two factors, which to a large extent determine the audience size of posted tweets, are positively associated with the coverage of user engagement. The more followers that users accrue or the more lists that users are listed in positively correlate to the higher probability for their tweets of getting engagement. Based on the Spearman correlation analysis, number of followers of users is moderately correlated with both number of likes and retweets received (\({r}_{\mathrm{s}}\) = 0.349 and 0.368, respectively).

Coverage of the four types of user engagement among scholarly tweets posted by users with different levels of A followers, B lists listed, C friends, D likes given, E tweets posted, and F science focus
Figure 6(C) and (D) show the relations between user engagement and the two factors about users’ interaction activity: number of friends and number of likes given. Similarly, these two factors also keep positive relationships with the coverage of user engagement. Overall, scholarly tweets posted by more active users (who interact more frequently with others by following other users and liking other users’ tweets) tend to show a relatively higher probability to be engaged with. The Spearman correlation analysis proves that there exist weak to moderate correlations between user engagement metrics and the two factors about users’ interaction activity (\({r}_{s}\) ranges from 0.086 for the correlation between number of friends and number of quotes up to 0.313 for the correlation between number of likes given and number of likes received).
Different from the patterns observed for the above factors, as shown in Fig. 6(E) and (F), number of tweets posted and science focus of users, which depict the overall tweeting activity of users, show negative relationships with the coverage of user engagement among scholarly tweets. In general, the greater number of tweets posted, as well as the stronger science focus of users, the lower levels of coverage of user engagement. These negative relationships are reinforced by the negative coefficients reported in the Spearman correlation analysis between these factors and user engagement metrics (\({r}_{s}\) ranges from − 0.147 to − 0.028).
Regression analysis using hurdle models
Given the statistically significant correlations existed amongst the studied factors, to further compare how different science-based and Twitter-based factors serve as predictors of user engagement to varying degrees, we performed regression analyses of the four types of user engagement using hurdle models. In order to avoid multicollinearity in the regression models, in each of the three dimensions discussed above, we selected several representative factors as the explanatory variables. For instance, in the dimension of scholarly impact of tweeted papers, since citations and Mendeley readers are strongly correlated with each other (\({r}_{s}\) = 0.712), we selected citations as one of the explanatory variables. In the dimension of tweet features, both number of hashtags used and number of mentioned users were included because they are weakly correlated (\({r}_{s}\) = 0.181). In the dimension of user characteristics, number of followers keeps moderate to strong correlations with other homogeneous user factors (\({r}_{s}\) ranges from 0.433 to 0.859) except science focus of users (\({r}_{s}\) = 0.015), so we adopted number of followers and science focus as representative variables in this dimension.
Table 5 reports the results of the zero portion of the four hurdle models of user engagement metrics (logit models): model 1 (likes), model 2 (retweets), model 3 (quotes), and model 4 (replies). Some variables were log-transformed for better model fitting. The zero portion of the models reflects how the selected explanatory variables relate to the odds for scholarly tweets of attracting at least one specific user engagement. The four models present a similar pattern in the zero portion, with citations, mentioned users and followers positively associated with the odds of getting at least one corresponding user engagement, whereas science focus presents a negative association. The exception is hashtags: in model 1 (likes), mode 2 (retweets) and model 3 (quotes), number of hashtags has a positive relationship with the odds that at least one like, retweet or quote occurs, however, in model 4 (replies), number of hashtags presents a negative association. The odds ratios (OR, exponent of regression coefficient in logit model) were calculated to help interpret the results. For example, in model 1 (likes), while all other variables remaining constant, a one-unit increase in the log-transformed number of mentioned users increases the odds of getting at least one like by 185.6% (OR 2.856). However, while holding all other variables constant in model 1 (likes), a unit increase in science focus decreases the odds of getting at least one like by 42.7% (OR 0.573).
Table 6 reports the results of the count portion of the hurdle models of user engagement metrics (zero-truncated negative binomial models). The count portion focuses on those scholarly tweets with at least one corresponding user engagement received and indicates how the explanatory variables associate with the increase of the frequency of user engagement. As is evident in all the four models, citations, mentioned users as well as followers are all positively associated with the frequency of user engagement, yet hashtags and science focus are negatively associated with the frequency of user engagement. Similarly, incidence rate ratios (IRR, exponent of regression coefficient in negative binomial model) were computed to help interpret the coefficient of a given variable while holding all other variables constant. For instance, in model 1 (likes), while all other variables remaining constant, a unit increase in the log-transformed number of followers increases the frequency of likes by a multiple of 1.484, while a unit increase in the log-transformed number of hashtags decreases the frequency of likes by a multiple of 0.908.
Discussion
As discussed by Brossard and Scheufele (2013), in the era of mass media, science stories as well as their accuracy, importance and popularity are no longer just “presented in isolation but instead are embedded in a host of cues that accompany nearly all online news stories”, such as comments on blog posts and user engagement on social media. In the context of scholarly Twitter metrics, this argument, on the one side, highlights the importance of the examination of user engagement in studying science-social media interactions, but on the other side, poses a question about how many scholarly tweets indeed triggered user engagement which are believed to contain extra meaning added to science stories.
Although user engagement with scholarly tweets have long been seen valuable for characterizing the interactions between scholarly objects and social media (Wouters et al., 2019), there is still an overall lack of evidence which can be drawn upon to mirror how effectively scholarly tweets attract the public’s attention and further stimulate public engagement in Twitter conversations around science. Based on a large-scale and cross-disciplinary dataset, this study unravels the coverage of diverse types of user engagement among scholarly tweets, thus offering an answer to the question about the overall presence of public engagement with scholarly information on Twitter.
Overall presence of user engagement with scholarly tweets
In this study, with likes, retweets, quotes, and replies as the traces of user engagement, we found that likes and retweets were present for about 44% and 36% of the studied scholarly tweets, respectively. However, the coverage of quotes and replies is as low as 9% and 7%, respectively. The globally low presence of user engagement, particularly for the engagement behaviors with more informative outcomes generated, reveals the fact that the attention paid to scholarly tweets varied a lot on the one hand, and puts more emphasis on the significance of more in-depth measurement of Twitter reception of scientific papers on the other hand. For papers with exactly the same number of scholarly tweets accumulated, although the papers’ Twitter reception appears to be equal only based on their absolute number of scholarly tweets, those with scholarly tweets being widely engaged with might be disseminated and perceived on Twitter in a more effective way. This is because engagement behaviors provide concrete evidence that they reached out to audiences who also showed further interest.
It is notable that there are 2% of scholarly tweets that have accrued all the four types of user engagement, being the widely engaged tweets in our dataset. For these widely engaged scholarly tweets, it would be an important future research agenda to explore the mechanisms by which they succeed in attracting such extensive user engagement. From a theoretical point of view, such case study will help to unravel the driving force of Twitter engagement as well as the nature of Twitter attention towards scholarly information. From a practical point of view, it will shed some light on how to utilize Twitter as an effective tool to promote science communication, particularly for scholarly journals and science journalists.
Disciplinary patterns of user engagement with scholarly tweets
The presence of user engagement differs by subject field. As the subject fields found to be more frequently mentioned in the Twittersphere (Costas et al., 2015; Haustein et al., 2015), SSH, LES, and BHS also have their scholarly tweets more actively engaged with by users through liking, retweeting, quoting, and replying, outperforming the fields of PSE and MCS. Therefore, disciplinary patterns are confirmed for not only Twitter uptake of scientific papers as reported by previous research, but also Twitter user engagement as analyzed in this study.
There are multiple possible reasons for the consistent disciplinary patterns of Twitter activities towards SSH, BHS, and LES, such as the lay audiences’ preference for topics related to social issues, environmental problems, and healthcare (Haustein et al., 2014b, 2015), the higher degree of Twitter uptake by scholars from these fields (Costas et al., 2020; Mohammadi et al., 2018), and the stronger enthusiasm shown by scholars in these fields for communicating scholarly information with the public (Bentley & Kyvik, 2011; Kreimer et al., 2011). To further interpret the subject field differences, future research is needed to scrutinize the contexts in which user engagement takes place (e.g., engaging users’ identity and motivations) across subject fields.
Factors related to user engagement with scholarly tweets
Based on both correlation and regression analyses, we investigated the relationships between user engagement and a spectrum of science-based and Twitter-based factors, which still remain unverified on the basis of a large-scale and cross-disciplinary dataset. Through the lens of a series of other factors, a comprehensive analysis will help improve our understanding of the nature of user engagement and its position in the ecosystem of science-social media interactions. In addition, user engagement metrics exhibit the potential for inclusion in the altmetric toolkit, because they can measure social media attention received by scientific papers at a deeper level. Given the potential of user engagement metrics for research evaluation and more advanced social media metrics, a comprehensive analysis will be helpful to figure out whether these potential indicators can, for example, predict future scholarly impact of papers, or whether they can be predicted in advance by other Twitter-based factors.
In contrast to science-based factors, Twitter-based factors generally tend to be more related to user engagement. Specifically, from the perspective of tweet features, although hashtags and user mentions are both tweet features increasing the visibility of tweets, the former is utilized to label and broadcast tweets to potential users interested in the same topics, while the latter is targeted to specific users with notifications delivered to them, showing a more conversational nature than the former. As a result, number of users mentioned in tweets is more related to user engagement and more effective in predicting user engagement. From the perspective of user characteristics, both users’ social media capital (i.e., followers and lists listed) and interaction activity (i.e., friends and likes given) were positively correlated with user engagement around their tweets. Nevertheless, flooding the screen (i.e., too many tweets posted) and attaching to tweeting only scientific papers (i.e., too strong science focus) were found to be related to lower levels of user engagement. From a practical point of view, as suggested by Cheplygina et al. (2020) for scientists getting start on Twitter, building a community by interacting with others, as well as sharing something personal and non-academic can also be relevant to get support in science communication on Twitter.
This study took into account scholarly tweets written in all languages. With this we provide a relatively complete picture of user engagement regardless of the language of the tweets. However, more detailed tweet content analysis should be applied, considering different linguistic contexts, as well as more local topics and sentiment, which were not included in this study. Given that specific tweet content like those including awe-inspiring imagery and newsworthy items frequently attract high levels of engagement across social media platforms (Kahle et al., 2016), future research should also focus on how different tweet content might be related to subsequent user engagement in scholarly contexts.
Limitations
There are several limitations in this study. First, there are more than four types of engagement behaviors that users can take to interact with scholarly tweets, such as clicking on tweeted scholarly URLs, clicking on users’ profile, and adding tweets to bookmarks. However, these engagement metrics are currently not publicly accessible on a large scale, and they were not included in this study. Should these engagement metrics be made publicly retrievable in the future, a more complete picture of user interaction behaviors around science could be drawn. Second, although reply tweets and quote tweets, which are outcomes of replying and quoting behaviors, can be further engaged with through Twitter functionalities as well (e.g., liking or retweeting replies and quote tweets), they were not included in the analyzed dataset to avoid double counting. Lastly, we explored how the characteristics of engaged users (i.e., users whose tweets are engaged with) relate to user engagement, while the characteristics of engaging users (i.e., users who engaged with tweets) are also of relevance to the interpretation of the occurrence of engagement behaviors. However, due to the lack of detailed information of the engaging users, their demographics and behavioral patterns were not analyzed in this study.
Conclusions
This study contributes to the expansion of the idea of secondary social media metrics (Díaz-Faes et al., 2019) by presenting a large-scale and cross-disciplinary analysis of four types of user engagement (i.e., liking, retweeting, quoting, and replying) around scholarly tweets. The presence of user engagement amongst scholarly tweets is globally low, particularly for those behaviors with higher levels of engagement needed (e.g., quotes and replies). Scholarly tweets from the fields of SSH, LES, and BHS tend to have more frequent user engagement distributed. Finally, the presence of user engagement is more related to other Twitter-based factors (mentioned users in tweets and number of followers of users in particular) than with science-based factors of papers (e.g., citations and Mendeley readers), implying both the intrinsically connected dynamics of Twitter elements and the distinguishing focuses between scientific and tweeting activities. Overall, our findings provide a first overview of the extent to which scholarly tweets are related to broader public engagement with science on Twitter, thereby paving the way towards the measurement of Twitter reception of science in a more interactive and comprehensive manner.
Notes
We referred to the definition of “engagements” metrics interpreted by Twitter as “total number of times a user interacted with a tweet. Clicks anywhere on the tweet, including retweets, replies, follows, likes, links, cards, hashtags, embedded media, username, profile photo, or tweet expansion” (https://help.twitter.com/en/managing-your-account/using-the-tweet-activity-dashboard). Therefore, in this study user engagement behavior refers to any interaction behavior performed by Twitter users on existing tweets.
We collected detailed Twitter information (e.g., tweet content and user demographics) in December 2019 for the tweet IDs provided by Altmetric.com (version: October 2019). Unavailable scholarly tweets caused by deletion of tweets, or suspension and protection of Twitter users’ accounts (Fang et al., 2020b, 2022) were not included in our dataset.
See more introduction to the CWTS classification system (also known as the Leiden Ranking classification) at: https://www.leidenranking.com/information/fields.
Full counting was applied for scholarly tweets that cite multiple papers belonging to different subject fields.
Twitter users are enabled to create lists of other Twitter user accounts by group, topic or interest, through which users can view the tweets from only the accounts in the lists that they created or followed. Therefore, number of lists in which a user is listed indicates the frequency that the user is added in lists by other Twitter users out of interest or other motivations. See more information about Twitter lists at: https://help.twitter.com/en/using-twitter/twitter-lists.
References
Alperin, J. P., Gomez, C. J., & Haustein, S. (2019). Identifying diffusion patterns of research articles on Twitter: A case study of online engagement with open access articles. Public Understanding of Science, 28(1), 2–18. https://doi.org/10.1177/0963662518761733
Araujo, R. F. (2020). Communities of attention networks: Introducing qualitative and conversational perspectives for altmetrics. Scientometrics, 124(3), 1793–1809. https://doi.org/10.1007/s11192-020-03566-7
Bentley, P., & Kyvik, S. (2011). Academic staff and public communication: A survey of popular science publishing across 13 countries. Public Understanding of Science, 20(1), 48–63. https://doi.org/10.1177/0963662510384461
Bhattacharya, S., Srinivasan, P., & Polgreen, P. (2014). Engagement with health agencies on Twitter. PLoS ONE, 9(11), e112235. https://doi.org/10.1371/journal.pone.0112235
Bhattacharya, S., Srinivasan, P., & Polgreen, P. (2017). Social media engagement analysis of U.S. Federal health agencies on Facebook. BMC Medical Informatics and Decision Making, 17(1), 49. https://doi.org/10.1186/s12911-017-0447-z
Bohn, A., Buchta, C., Hornik, K., & Mair, P. (2014). Making friends and communicating on Facebook: Implications for the access to social capital. Social Networks, 37(1), 29–41. https://doi.org/10.1016/j.socnet.2013.11.003
Bornmann, L., & Haunschild, R. (2016). How to normalize Twitter counts? A first attempt based on journals in the Twitter Index. Scientometrics, 107(3), 1405–1422. https://doi.org/10.1007/s11192-016-1893-6
Brossard, D., & Scheufele, D. A. (2013). Science, new media, and the public. Science, 339(6115), 40–41. https://doi.org/10.1126/science.1232329
Cheplygina, V., Hermans, F., Albers, C., Bielczyk, N., & Smeets, I. (2020). Ten simple rules for getting started on Twitter as a scientist. PLoS Computational Biology, 16(2), e1007513. https://doi.org/10.1371/journal.pcbi.1007513
Costas, R., Mongeon, P., Ferreira, M. R., Van Honk, J., & Franssen, T. (2020). Large-scale identification and characterization of scholars on Twitter. Quantitative Science Studies, 1(2), 771–791. https://doi.org/10.1162/qss_a_00047
Costas, R., Rijcke, S., & Marres, N. (2021). “Heterogeneous couplings”: Operationalizing network perspectives to study science-society interactions through social media metrics. Journal of the Association for Information Science and Technology, 72(5), 595–610. https://doi.org/10.1002/asi.24427
Costas, R., Zahedi, Z., & Wouters, P. (2015). Do “altmetrics” correlate with citations? Extensive comparison of altmetric indicators with citations from a multidisciplinary perspective. Journal of the Association for Information Science and Technology, 66(10), 2003–2019. https://doi.org/10.1002/asi.23309
Díaz-Faes, A. A., Bowman, T. D., & Costas, R. (2019). Towards a second generation of ‘social media metrics’: Characterizing Twitter communities of attention around science. PLoS ONE, 14(5), e0216408. https://doi.org/10.1371/journal.pone.0216408
Didegah, F., Mejlgaard, N., & Sørensen, M. P. (2018). Investigating the quality of interactions and public engagement around scientific papers on Twitter. Journal of Informetrics, 12(3), 960–971. https://doi.org/10.1016/j.joi.2018.08.002
Eysenbach, G. (2011). Can tweets predict citations? Metrics of social impact based on Twitter and correlation with traditional metrics of scientific impact. Journal of Medical Internet Research, 13(4), e2012. https://doi.org/10.2196/jmir.2012
Fang, Z., Costas, R., Tian, W., Wang, X., & Wouters, P. (2020a). An extensive analysis of the presence of altmetric data for Web of Science publications across subject fields and research topics. Scientometrics, 124(3), 2519–2549. https://doi.org/10.1007/s11192-020-03564-9
Fang, Z., Costas, R., Tian, W., Wang, X., & Wouters, P. (2021). How is science clicked on Twitter? Click metrics for Bitly short links to scientific publications. Journal of the Association for Information Science and Technology, 72(7), 918–932. https://doi.org/10.1002/asi.24458
Fang, Z., Dudek, J., & Costas, R. (2020b). The stability of Twitter metrics: A study on unavailable Twitter mentions of scientific publications. Journal of the Association for Information Science and Technology, 71(12), 1455–1469. https://doi.org/10.1002/asi.24344
Fang, Z., Dudek, J., & Costas, R. (2022). Facing the volatility of tweets in altmetric research. Journal of the Association for Information Science and Technology. https://doi.org/10.1002/ASI.24624
Friedrich, N., Bowman, T. D., Stock, W. G., & Haustein, S. (2015). Adapting sentiment analysis for tweets linking to scientific papers. In Proceedings of ISSI 2015 Istanbul: 15th International Society of Scientometrics and Informetrics Conference (pp. 107–108). https://www.issi-society.org/proceedings/issi_2015/0107.pdf. Accessed 9 Apr 2021
Fu, K., & Chau, M. (2013). Reality check for the Chinese microblog space: A random sampling approach. PLoS ONE, 8(3), e58356. https://doi.org/10.1371/journal.pone.0058356
Hassan, S. U., Bowman, T. D., Shabbir, M., Akhtar, A., Imran, M., & Aljohani, N. R. (2019). Influential tweeters in relation to highly cited articles in altmetric big data. Scientometrics, 119(1), 481–493. https://doi.org/10.1007/s11192-019-03044-9
Haunschild, R., Leydesdorff, L., Bornmann, L., Hellsten, I., & Marx, W. (2019). Does the public discuss other topics on climate change than researchers? A comparison of explorative networks based on author keywords and hashtags. Journal of Informetrics, 13(2), 695–707. https://doi.org/10.1016/j.joi.2019.03.008
Haustein, S. (2019). Scholarly Twitter metrics. In W. Glänzel, F. H. Moed, U. Schmoch, & M. Thelwall (Eds.), Springer handbook of science and technology indicators (pp. 729–760). Springer.
Haustein, S., Bowman, T. D., Holmberg, K., Peters, I., & Larivière, V. (2014a). Astrophysicists on Twitter: An in-depth analysis of tweeting and scientific publication behavior. Aslib Journal of Information Management, 66(3), 279–296. https://doi.org/10.1108/AJIM-09-2013-0081
Haustein, S., Costas, R., & Larivière, V. (2015). Characterizing social media metrics of scholarly papers: The effect of document properties and collaboration patterns. PLoS ONE, 10(3), e0120495. https://doi.org/10.1371/journal.pone.0120495
Haustein, S., Peters, I., Sugimoto, C. R., Thelwall, M., & Larivière, V. (2014b). Tweeting biomedicine: An analysis of tweets and citations in the biomedical literature. Journal of the Association for Information Science and Technology, 65(4), 656–669. https://doi.org/10.1002/asi.23101
Hellsten, I., & Leydesdorff, L. (2020). Automated analysis of actor–topic networks on Twitter: New approaches to the analysis of socio-semantic networks. Journal of the Association for Information Science and Technology, 71(1), 3–15. https://doi.org/10.1002/asi.24207
Holmberg, K., Bowman, T. D., Haustein, S., & Peters, I. (2014). Astrophysicists’ conversational connections on Twitter. PLoS ONE, 9(8), e106086. https://doi.org/10.1371/journal.pone.0106086
Holmberg, K., & Thelwall, M. (2014). Disciplinary differences in Twitter scholarly communication. Scientometrics, 101(2), 1027–1042. https://doi.org/10.1007/s11192-014-1229-3
Kahle, K., Sharon, A. J., & Baram-Tsabari, A. (2016). Footprints of fascination: Digital traces of public engagement with particle physics on CERN’s social media platforms. PLoS ONE, 11(5), e0156409. https://doi.org/10.1371/journal.pone.0156409
Kreimer, P., Levin, L., & Jensen, P. (2011). Popularization by Argentine researchers: The activities and motivations of CONICET scientists. Public Understanding of Science, 20(1), 37–47. https://doi.org/10.1177/0963662510383924
Mohammadi, E., Thelwall, M., Kwasny, M., & Holmes, K. L. (2018). Academic information on Twitter: A user survey. PLoS ONE, 13(5), e0197265. https://doi.org/10.1371/journal.pone.0197265
Mullahy, J. (1986). Specification and testing of some modified count data models. Journal of Econometrics, 33(3), 341–365. https://doi.org/10.1016/0304-4076(86)90002-3
Priem, J., & Costello, K. L. (2010). How and why scholars cite on Twitter. Proceedings of the American Society for Information Science and Technology, 47(1), 1–4. https://doi.org/10.1002/meet.14504701201
Robinson-Garcia, N., Costas, R., Isett, K., Melkers, J., & Hicks, D. (2017). The unbearable emptiness of tweeting—About journal articles. PLoS ONE, 12(8), e0183551. https://doi.org/10.1371/journal.pone.0183551
Robinson-Garcia, N., van Leeuwen, T. N., & Ràfols, I. (2018). Using altmetrics for contextualised mapping of societal impact: From hits to networks. Science and Public Policy, 45(6), 815–826. https://doi.org/10.1093/SCIPOL/SCY024
Said, A., Bowman, T. D., Abbasi, R. A., Aljohani, N. R., Hassan, S. U., & Nawaz, R. (2019). Mining network-level properties of Twitter altmetrics data. Scientometrics, 120(1), 217–235. https://doi.org/10.1007/s11192-019-03112-0
Thelwall, M., Tsou, A., Weingart, S., Holmberg, K., & Haustein, S. (2013). Tweeting links to academic articles. International Journal of Scientometrics, Informetrics and Bibliometrics, 17(1), 1–8.
Vainio, J., & Holmberg, K. (2017). Highly tweeted science articles: Who tweets them? An analysis of Twitter user profile descriptions. Scientometrics, 112(1), 345–366. https://doi.org/10.1007/s11192-017-2368-0
Waltman, L., & Van Eck, N. J. (2012). A new methodology for constructing a publication-level classification system of science. Journal of the American Society for Information Science and Technology, 63(12), 2378–2392. https://doi.org/10.1002/asi.22748
Wang, Y., & Zuccala, A. (2021). Scholarly book publishers as publicity agents for SSH titles on Twitter. Scientometrics, 126(6), 4817–4840. https://doi.org/10.1007/S11192-021-03947-6
Wouters, P., Zahedi, Z., & Costas, R. (2019). Social media metrics for new research evaluation. In W. Glänzel, F. H. Moed, U. Schmoch, & M. Thelwall (Eds.), Springer handbook of science and technology indicators (pp. 687–713). Springer.
Xu, S., Yu, H., Hemminger, B. M., & Dong, X. (2018). Who, what, why? An exploration of JoVE scientific video publications in tweets. Scientometrics, 117(2), 845–856. https://doi.org/10.1007/s11192-018-2880-x
Yolcu, O. (2013). Twitter usage of universities in Turkey. Turkish Online Journal of Educational Technology, 12(2), 360–371.
Yu, H. (2017). Context of altmetrics data matters: An investigation of count type and user category. Scientometrics, 111(1), 267–283. https://doi.org/10.1007/s11192-017-2251-z
Yu, H., Xiao, T., Xu, S., & Wang, Y. (2019). Who posts scientific tweets? An investigation into the productivity, locations, and identities of scientific tweeters. Journal of Informetrics, 13(3), 841–855. https://doi.org/10.1016/j.joi.2019.08.001
Zeileis, A., Kleiber, C., & Jackman, S. (2008). Regression models for count data in R. Journal of Statistical Software, 27(8), 1–25. https://doi.org/10.18637/jss.v027.i08
Zheng, H., Aung, H. H., Erdt, M., Peng, T. Q., Sesagiri Raamkumar, A., & Theng, Y. L. (2019). Social media presence of scholarly journals. Journal of the Association for Information Science and Technology, 70(3), 256–270. https://doi.org/10.1002/asi.24124
Acknowledgements
Zhichao Fang is financially supported by the China Scholarship Council (201706060201). Rodrigo Costas is partially funded by the South African DST-NRF Centre of Excellence in Scientometrics and Science, Technology and Innovation Policy (SciSTIP). The authors thank Altmetric.com for providing the data for research purposes, also thank the anonymous reviewer for the valuable suggestions.
Author information
Authors and Affiliations
Corresponding author
Ethics declarations
Conflict of interest
One of the authors (Rodrigo Costas) is a member of the Distinguished Reviewers Board of the journal Scientometrics.
Appendix
Appendix
See Fig. 7.

Spearman correlation analysis of the four user engagement metrics and studied factors. (Color figure online)
Rights and permissions
Open Access This article is licensed under a Creative Commons Attribution 4.0 International License, which permits use, sharing, adaptation, distribution and reproduction in any medium or format, as long as you give appropriate credit to the original author(s) and the source, provide a link to the Creative Commons licence, and indicate if changes were made. The images or other third party material in this article are included in the article's Creative Commons licence, unless indicated otherwise in a credit line to the material. If material is not included in the article's Creative Commons licence and your intended use is not permitted by statutory regulation or exceeds the permitted use, you will need to obtain permission directly from the copyright holder. To view a copy of this licence, visit http://creativecommons.org/licenses/by/4.0/.
About this article

Cite this article
Fang, Z., Costas, R. & Wouters, P. User engagement with scholarly tweets of scientific papers: a large-scale and cross-disciplinary analysis. Scientometrics 127, 4523–4546 (2022). https://doi.org/10.1007/s11192-022-04468-6
Received:
Accepted:
Published:
Issue Date:
DOI: https://doi.org/10.1007/s11192-022-04468-6