
Abstract
In August 2011, Thomson Reuters launched version 5 of the Science and Social Science Citation Index in the Web of Science (WoS). Among other things, the 222 ISI Subject Categories (SCs) for these two databases in version 4 of WoS were renamed and extended to 225 WoS Categories (WCs). A new set of 151 Subject Areas was added, but at a higher level of aggregation. Perhaps confusingly, these Subject Areas are now abbreviated “SC” in the download, whereas “WC” is used for WoS Categories. Since we previously used the ISI SCs as the baseline for a global map in Pajek (Pajek is freely available at http://vlado.fmf.uni-lj.si/pub/networks/pajek/) (Rafols et al., Journal of the American Society for Information Science and Technology 61:1871–1887, 2010) and brought this facility online (at http://www.leydesdorff.net/overlaytoolkit), we recalibrated this map for the new WC categories using the Journal Citation Reports 2010. In the new installation, the base maps can also be made using VOSviewer (VOSviewer is freely available at http://www.VOSviewer.com/) (Van Eck and Waltman, Scientometrics 84:523–538, 2010).
The WC categories are sometimes different from the old SCs. For example, the European Journal of Pharmaceutics and Biopharmaceutics, which was previously classified to the ISI SC “Engineering, Chemical” was now assigned to “Pharmacology and Pharmacy.” In an Annex, Rafols et al. (2010) showed that with aggregated sets the map is relatively robust against error in the classifications, but the differences can be significant at lower levels of aggregation (Rafols and Leydesdorff 2009). As noted, the semantics may be confusing: WoS Subject Categories (WC) replace the old ISI Subject Categories (SC), but the old label SC for Subject Categories is now used in the download for the 151 newly created “Subject Areas” as they are called at the WoS interface. Both in the old and the new situation there are additionally 25 Subject Categories which are used exclusively in the Arts & Humanities Citation Index (A&HCI), and not included in our analysis because A&HCI does not have (hitherto) a Journal Citation Report (Leydesdorff et al. 2011, at pp. 2417 ff.). Table 1 summarizes the changes.
Whereas previously 18 factors were found most appropriate for explaining the structure of the aggregated citation matrix, an organization into 19 factors explaining 54.3 % of the variance is most apt for showing the disciplinary structure of the new matrix. The changes are mainly in the organization of mathematics. Rafols et al. (2010, at p. 1876) already noted that “the position of mathematics (all math subject categories) in the map remains open to debate. Since different strands of mathematics are linked to different major fields (medicine, engineering, social sciences), these may show as diverse entities in distant positions, rather than as a unitary corpus, depending on metrics, classifications, and clustering algorithms used.”
In the new overlays, the previous factor of “Computer Science” is divided into two groups and designated (by us) as “Computer Science” and “Mathematical Methods.” Table 2 provides the subject categories organized within these two compartments. The other 17 factors could remain similar to the previous classification (Rafols et al. 2010).
As with our previous installation, the base map with the relevant initialization routine for Pajek (v. 2.05) is available on the internet. The new base map can also be used as input to VOSviewer (Van Eck and Waltman 2010), but this did not improve the visualization in the case of 19 clusters. (See for more discussion about the differences between the two visualization techniques Leydesdorff and Rafols (2012).) However, the clustering algorithm in VOSviewer distinguished four, in our opinion highly meaningful, groups (Waltman et al. 2010). The organization into these four groups (biomedical, physical, environmental, and social sciences) is now provided as another (optional) partition within the Pajek (.paj) file containing the base map, and is also made available as input to VOSviewer.
The routine allows the user to make an overlay choosing one of the following two routes:
-
1.
Within the WoS (v. 5.5), one can “Analyze Results” by clicking at the right top of the page with search results; choose “Web of Science Categories” among the ranking options, and export the data into a file “analyze.txt”. This file can be read by the program wc10.exe, and the resulting file “wc10.vec” can be imported into the base map as a vector.Footnote 1 The visualization (Draw-Partition-Vector within Pajek) then shows the overlay (e.g., Fig. 1).
Fig. 1 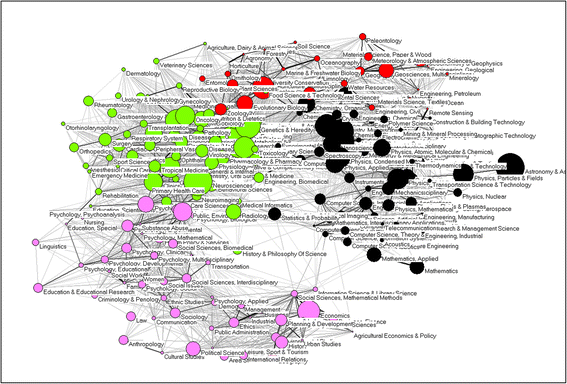
Disciplinary composition of 5,793 citable items (articles, proceedings papers, and reviews) published in 2009 with an address at Oxford University; Rao-Stirling = 0.856. (Pajek used for the visualization.)
-
2.
The routine wc10.exe also generates three so-called “map”-files for VOSviewer: vos4.csv, vos6.csv, and vos19.csv. (The csv-extension makes these text files also readable using Excel.) These files generate maps when read into VOSviewer with four, six, and 19 clusters, respectively (using different colors). The manual of VOSviewer can be consulted for further options (Fig. 2).
Fig. 2 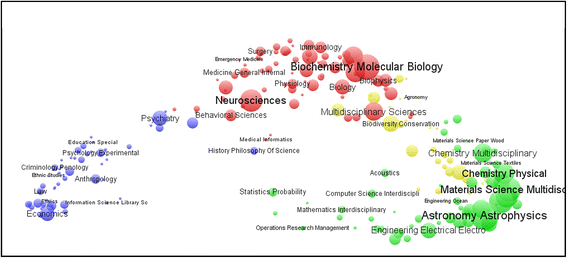
Disciplinary composition of 5,468 citable items (articles, proceedings papers, and reviews) published in 2009 with an address at the University of Cambridge; Rao-Stirling = 0.851. (VOSviewer used for the visualization.)


A PowerPoint file is provided at http://www.leydesdorff.net/overlaytoolkit/basemaps.pptx which allows the user to place the legends on top of the maps and which provides a few examples; these legends can also be edited. An additional routine enables the user to measure Rao-Stirling diversity as an index of the interdisciplinarity in the samples under study (cf. Carley and Porter 2012; Leydesdorff and Rafols 2011; Porter and Rafols 2009; Rafols et al. 2012; Stirling 2007).
By thus adjusting to the new situation, we hope to have provided the community with a means to map inter- and multidisciplinary sets of documents in future research using the new version of the Web of Science (cf. Leydesdorff and Rafols 2009; Melkers and Hicks 2012; Porter and Youtie 2009; Soós and Kampis 2011). A detailed manual for the mapping was provided (at the website) by Ken Riopelle. Additionally, a macro to transform the file “analyze.txt” into the Gephi format was provided by Clement Levallois.
Notes
The same file “wc10.vec” is automatically generated when using the routine ISI.exe for organizing the saved output of the WoS, as specified at http://www.leydesdorff.net/software/isi.
References
Carley, S., & Porter, A. L. (2012). A forward diversity index. Scientometrics, 90(2), 407–427.
Leydesdorff, L., Hammarfelt, B., & Salah, A. A. A. (2011). The structure of the Arts & Humanities Citation Index: A mapping on the basis of aggregated citations among 1,157 journals. Journal of the American Society for Information Science and Technology, 62(12), 2414–2426.
Leydesdorff, L., & Rafols, I. (2009). A global map of science based on the isi subject categories. Journal of the American Society for Information Science and Technology, 60(2), 348–362.
Leydesdorff, L., & Rafols, I. (2011). How do emerging technologies conquer the world? An exploration of patterns of diffusion and network formation. Journal of the American Society for Information Science and Technology, 62(5), 846–860.
Leydesdorff, L., & Rafols, I. (2012). Interactive overlays: A new method for generating global journal maps from web-of-science data. Journal of Informetrics, 6(3), 318–332.
Melkers, J., & Hicks, D. (2012). Bibliometrics as a tool for research evaluation. In A. Link & N. Vornatas (Eds.), Handbook on the Theory and Practice of Program Evaluation. Cheltenham: Edward Elgar.
Porter, A. L., & Rafols, I. (2009). Is science becoming more interdisciplinary? Measuring and mapping six research fields over time. Scientometrics, 81(3), 719–745.
Porter, A. L., & Youtie, J. (2009). How interdisciplinary is nanotechnology? Journal of Nanoparticle Research, 11(5), 1023–1041.
Rafols, I., & Leydesdorff, L. (2009). Content-based and algorithmic classifications of journals: Perspectives on the dynamics of scientific communication and indexer effects. Journal of the American Society for Information Science and Technology, 60(9), 1823–1835.
Rafols, I., Leydesdorff, L., O’Hare, A., Nightingale, P., & Stirling, A. (2012). How journal rankings can suppress interdisciplinary research: A comparison between innovation studies and business & management. Research Policy, 41(7), 1262–1282.
Rafols, I., Porter, A., & Leydesdorff, L. (2010). Science overlay maps: A new tool for research policy and library management. Journal of the American Society for Information Science and Technology, 61(9), 1871–1887.
Soós, S., & Kampis, G. (2011). Towards a typology of research performance diversity: The case of top Hungarian players. Scientometrics, 87, 357–371.
Stirling, A. (2007). A general framework for analysing diversity in science, technology and society. Journal of the Royal Society, Interface, 4(15), 707–719.
Van Eck, N. J., & Waltman, L. (2010). Software survey: VOSviewer, a computer program for bibliometric mapping. Scientometrics, 84(2), 523–538.
Waltman, L., van Eck, N. J., & Noyons, E. (2010). A unified approach to mapping and clustering of bibliometric networks. Journal of Informetrics, 4(4), 629–635.
Acknowledgments
We are grateful to Alan Porter for comments on a previous draft. We acknowledge Thomson Reuters for the use of the data. We acknowledge support from the ESRC grant RES-360-25-0076.
Open Access
This article is distributed under the terms of the Creative Commons Attribution License which permits any use, distribution, and reproduction in any medium, provided the original author(s) and the source are credited.
Author information
Authors and Affiliations
Corresponding author
Rights and permissions
Open Access This article is distributed under the terms of the Creative Commons Attribution 2.0 International License (https://creativecommons.org/licenses/by/2.0), which permits unrestricted use, distribution, and reproduction in any medium, provided the original work is properly cited.
About this article
Cite this article
Leydesdorff, L., Carley, S. & Rafols, I. Global maps of science based on the new Web-of-Science categories. Scientometrics 94, 589–593 (2013). https://doi.org/10.1007/s11192-012-0784-8
Received:
Published:
Issue Date:
DOI: https://doi.org/10.1007/s11192-012-0784-8