
Abstract
We present VOSviewer, a freely available computer program that we have developed for constructing and viewing bibliometric maps. Unlike most computer programs that are used for bibliometric mapping, VOSviewer pays special attention to the graphical representation of bibliometric maps. The functionality of VOSviewer is especially useful for displaying large bibliometric maps in an easy-to-interpret way. The paper consists of three parts. In the first part, an overview of VOSviewer’s functionality for displaying bibliometric maps is provided. In the second part, the technical implementation of specific parts of the program is discussed. Finally, in the third part, VOSviewer’s ability to handle large maps is demonstrated by using the program to construct and display a co-citation map of 5,000 major scientific journals.
Find the latest articles, discoveries, and news in related topics.Avoid common mistakes on your manuscript.
Introduction
Bibliometric mapping is an important research topic in the field of bibliometrics (for an overview, see Börner et al. 2003). Two aspects of bibliometric mapping that can be distinguished are the construction of bibliometric maps and the graphical representation of such maps. In the bibliometric literature, most attention is paid to the construction of bibliometric maps. Researchers for example study the effect of different similarity measures (e.g., Ahlgren et al. 2003; Klavans and Boyack 2006a; Van Eck and Waltman 2009), and they experiment with different mapping techniques (e.g., Boyack et al. 2005; Van Eck and Waltman 2007b; White 2003). The graphical representation of bibliometric maps receives considerably less attention. Although some researchers seriously study issues concerning graphical representation (e.g., Chen 2003, 2006; Skupin 2004), most papers published in the bibliometric literature rely on simple graphical representations provided by computer programs such as SPSS and Pajek. For small maps containing no more than, say, 100 items, simple graphical representations typically yield satisfactory results. However, there seems to be a trend towards larger maps (e.g., Boyack et al. 2005; Klavans and Boyack 2006b; Leydesdorff 2004; Van Eck et al. 2006, in press), and for such maps simple graphical representations are inadequate. The graphical representation of large bibliometric maps can be much enhanced by means of, for example, zoom functionality, special labeling algorithms, and density metaphors. This kind of functionality is not incorporated into the computer programs that are commonly used by bibliometric researchers. In this paper, we therefore introduce a new computer program for bibliometric mapping. This program pays special attention to the graphical representation of bibliometric maps.
The computer program that we introduce is called VOSviewer. VOSviewer is a program that we have developed for constructing and viewing bibliometric maps. The program is freely available to the bibliometric research community (see www.vosviewer.com). VOSviewer can for example be used to construct maps of authors or journals based on co-citation data or to construct maps of keywords based on co-occurrence data. The program offers a viewer that allows bibliometric maps to be examined in full detail. VOSviewer can display a map in various different ways, each emphasizing a different aspect of the map. It has functionality for zooming, scrolling, and searching, which facilitates the detailed examination of a map. The viewing capabilities of VOSviewer are especially useful for maps containing at least a moderately large number of items (e.g., at least 100 items). Most computer programs that are used for bibliometric mapping do not display such maps in a satisfactory way.
To construct a map, VOSviewer uses the VOS mapping technique (Van Eck and Waltman 2007a), where VOS stands for visualization of similarities. For earlier studies in which the VOS mapping technique was used, we refer to Van Eck and Waltman (2007b) and Van Eck et al. (in press). VOSviewer can display maps constructed using any suitable mapping technique. Hence, the program can be employed not only for displaying maps constructed using the VOS mapping technique but also for displaying maps constructed using techniques such as multidimensional scaling. VOSviewer runs on a large number of hardware and operating system platforms and can be started directly from the internet.
In the remainder of this paper, we first discuss for what type of bibliometric maps VOSviewer is intended to be used. We then provide an overview of VOSviewer’s functionality for displaying bibliometric maps. We also elaborate on the technical implementation of specific parts of the program. Finally, to demonstrate VOSviewer’s ability to handle large maps, we use the program to construct and display a co-citation map of 5,000 major scientific journals.
Types of bibliometric maps
Two types of maps can be distinguished that are commonly used in bibliometric research.Footnote 1 We refer to these types of maps as distance-based maps and graph-based maps. Distance-based maps are maps in which the distance between two items reflects the strength of the relation between the items. A smaller distance generally indicates a stronger relation. In many cases, items are distributed quite unevenly in distance-based maps. On the one hand this makes it easy to identify clusters of related items, but on the other hand this sometimes makes it difficult to label all the items in a map without having labels that overlap each other. Graph-based maps are maps in which the distance between two items need not reflect the strength of the relation between the items. Instead, lines are drawn between items to indicate relations. Items are often distributed in a fairly uniform way in graph-based maps. This may have the advantage that there are less problems with overlapping labels. In our opinion, a disadvantage of graph-based maps compared with distance-based maps is that it typically is more difficult to see the strength of the relation between two items. Clusters of related items may also be more difficult to detect.
In Table 1, we list some mapping techniques that are used in bibliometric research to construct distance-based and graph-based maps. For constructing distance-based maps, multidimensional scaling (e.g., Borg and Groenen 2005) is by far the most popular technique in the field of bibliometrics. An alternative to multidimensional scaling is the VOS mapping technique (Van Eck and Waltman 2007a, b; Van Eck et al. 2006). In general, this technique produces better structured maps than multidimensional scaling (Van Eck et al. 2008). Another technique for constructing distance-based maps is VxOrd (Davidson et al. 2001; Klavans and Boyack 2006b).Footnote 2 This technique is especially intended for constructing maps that contain very large numbers of items (more than 700,000 items in Klavans and Boyack 2006b). A disadvantage of VxOrd is that a complete specification of how the technique works is not available. A fourth technique for constructing distance-based maps was proposed by Kopcsa and Schiebel (1998). This technique is implemented in a computer program called BibTechMon.
For constructing graph-based maps, researchers in the field of bibliometrics (e.g., de Moya-Anegón et al. 2007; Leydesdorff and Rafols 2009; Vargas-Quesada and de Moya-Anegón 2007; White 2003) usually use a mapping technique developed by Kamada and Kawai (1989). Sometimes an alternative technique proposed by Fruchterman and Reingold (1991) is used (e.g., Bollen et al. 2009; Leydesdorff 2004). A popular computer program in which both techniques are implemented is Pajek (De Nooy et al. 2005). Some researchers (e.g., de Moya-Anegón et al. 2007; Vargas-Quesada and de Moya-Anegón 2007; White 2003) combine the Kamada–Kawai technique with the technique of pathfinder networks (Schvaneveldt 1990; Schvaneveldt et al. 1988). Two other computer programs that can be used to construct graph-based maps are CiteSpace (Chen 2006) and the Network Workbench Tool. Even more programs are available in the field of social network analysis (for an overview, see Huisman and Van Duijn 2005).
Distance-based and graph-based maps both have advantages and disadvantages. In VOSviewer, we have chosen to support only distance-based maps. VOSviewer can be employed to view any two-dimensional distance-based map, regardless of the mapping technique that has been used to construct the map. One can employ VOSviewer to view multidimensional scaling maps constructed using statistical packages such as SAS, SPSS, and R, but one can also employ VOSviewer to view maps constructed using other, less common techniques. Because the VOS mapping technique shows a very good performance (Van Eck et al. 2008), this technique has been fully integrated into VOSviewer. This means that VOSviewer can be used not only to view VOS maps but also to construct them. Hence, no separate computer program is needed for constructing VOS maps.
Functionality of VOSviewer
In this section, we provide an overview of VOSviewer’s functionality for displaying bibliometric maps.Footnote 3 We use a data set that consists of co-citation frequencies of journals belonging to at least one of the following five closely related subject categories of Thomson Reuters: Business, Business-Finance, Economics, Management, and Operations Research & Management Science. The co-citation frequencies of journals were determined based on citations in articles published between 2005 and 2007 to articles published in 2005. A journal was included in the data set only if it had at least 25 co-citations. There were 232 journals that satisfied this condition. Based on a clustering technique, the journals in the data set were divided into five clusters. The data set is available at www.vosviewer.com.
Two maps constructed based on the journal co-citation data set are shown in Figs. 1 and 2. The figures were obtained using, respectively, SPSS and Pajek, which are both commonly used computer programs for bibliometric mapping. The map shown in Fig. 1 is a distance-based map constructed using multidimensional scaling. The map shown in Fig. 2 is a graph-based map constructed using the Kamada–Kawai technique (Kamada and Kawai 1989). As can be seen, SPSS and Pajek both provide rather simple graphical representations of bibliometric maps. The programs both have serious problems with overlapping labels. Due to these problems, maps can be difficult to interpret, especially in the details. In the rest of this section, we demonstrate how VOSviewer overcomes the limitations of simple graphical representations provided by programs such as SPSS and Pajek.

Map obtained using SPSS

Map obtained using Pajek
A screenshot of the main window of VOSviewer is shown in Fig. 3. Depending on the available data, VOSviewer can display a map in three or four different ways. The different ways of displaying a map are referred to as the label view, the density view, the cluster density view, and the scatter view. We now discuss each of these views:

Screenshot of the main window of VOSviewer
-
Label view. In this view, items are indicated by a label and, by default, also by a circle. The more important an item, the larger its label and its circle. If colors have been assigned to items, each item’s circle is displayed in the color of the item. By default, to avoid overlapping labels, only a subset of all labels is displayed. The label view is particularly useful for a detailed examination of a map.
An example of the label view is shown in Fig. 4. The map shown in this figure was constructed based on the journal co-citation data set discussed at the beginning of this section. Colors indicate the cluster to which a journal was assigned by the clustering technique that we used. As can be seen, there is a strong agreement between the structure of the map and the clustering obtained using our clustering technique. The clustering also has a straightforward interpretation. The five clusters correspond with the following research fields: accounting/finance, economics, management, marketing, and operations research.Footnote 4 It is clear that the map shown in Fig. 4 is much easier to interpret than the maps shown in Figs. 1 and 2. This demonstrates one of the main advantages of VOSviewer over commonly used computer programs such as SPSS and Pajek.
Fig. 4 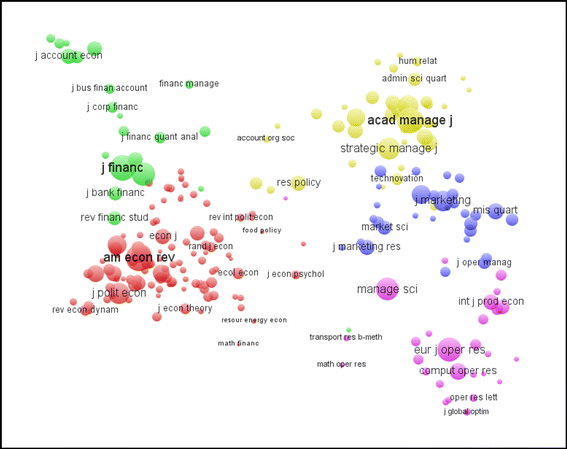
Screenshot of the label view
-
Density view. In this view, items are indicated by a label in a similar way as in the label view. Each point in a map has a color that depends on the density of items at that point. That is, the color of a point in a map depends on the number of items in the neighborhood of the point and on the importance of the neighboring items. The density view is particularly useful to get an overview of the general structure of a map and to draw attention to the most important areas in a map. We will discuss the technical implementation of the density view later on in this paper.
An example of the density view is shown in Fig. 5. The map shown in this figure is the same as the one shown in Fig. 4. The density view immediately reveals the general structure of the map. Especially the economics and management areas turn out to be important. These areas are very dense, which indicates that overall the journals in these areas receive a lot of citations. It can also be seen that there is a clear separation between the fields of accounting, finance, and economics on the one hand and the fields of management, marketing, and operations research on the other hand. Like Fig. 4, Fig. 5 demonstrates VOSviewer’s ability to provide easy-to-interpret graphical representations of bibliometric maps.
Fig. 5 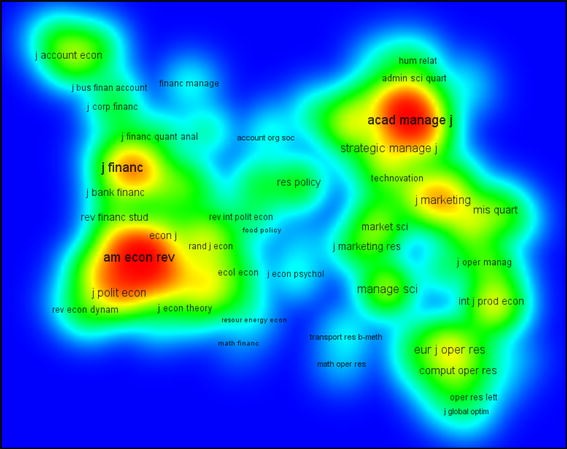
Screenshot of the density view
-
Cluster density view. This view is available only if items have been assigned to clusters. The cluster density view is similar to the ordinary density view except that the density of items is displayed separately for each cluster of items. The cluster density view is particularly useful to get an overview of the assignment of items to clusters and of the way in which clusters of items are related to each other. We will discuss the technical implementation of the cluster density view later on in this paper.
Unfortunately, the cluster density view cannot be shown satisfactorily in black and white. We therefore do not show an example of the cluster density view.
-
Scatter view. This is a simple view in which items are indicated by a small circle and in which no labels are displayed. If colors have been assigned to items, each item’s circle is displayed in the color of the item. The scatter view focuses solely on the general structure of a map and does not provide any detailed information.


In addition to the four views discussed above, another important feature of VOSviewer is its ability to handle large maps. VOSviewer can easily construct maps that contain several thousands of items, and it can display maps that contain more than 10,000 items. VOSviewer has functionality for zooming, scrolling, and searching, which facilitates the detailed examination of large maps. When displaying a map, VOSviewer uses a special algorithm to determine which labels can be displayed and which labels cannot be displayed without having labels that overlap each other. The further one zooms in on a specific area of a map, the more labels become visible. Later on in this paper, we will demonstrate VOSviewer’s ability to handle large maps by using the program to construct and display a co-citation map of 5,000 major scientific journals. In the next two sections, however, we will first elaborate on the technical implementation of specific parts of VOSviewer.
Construction of a map
VOSviewer constructs a map based on a co-occurrence matrix. The construction of a map is a process that consists of three steps. In the first step, a similarity matrix is calculated based on the co-occurrence matrix. In the second step, a map is constructed by applying the VOS mapping technique to the similarity matrix. And finally, in the third step, the map is translated, rotated, and reflected. We now discuss each of these steps in more detail.
Step 1: similarity matrix
The VOS mapping technique requires a similarity matrix as input. A similarity matrix can be obtained from a co-occurrence matrix by normalizing the latter matrix, that is, by correcting the matrix for differences in the total number of occurrences or co-occurrences of items. The most popular similarity measures for normalizing co-occurrence data are the cosine and the Jaccard index. VOSviewer, however, does not use one of these similarity measures. Instead, it uses a similarity measure known as the association strength (Van Eck and Waltman 2007b; Van Eck et al. 2006). This similarity measure is sometimes also referred to as the proximity index (e.g., Peters and Van Raan 1993; Rip and Courtial 1984) or as the probabilistic affinity index (e.g., Zitt et al. 2000). Using the association strength, the similarity s ij between two items i and j is calculated as
where c ij denotes the number of co-occurrences of items i and j and where w i and w j denote either the total number of occurrences of items i and j or the total number of co-occurrences of these items. It can be shown that the similarity between items i and j calculated using (1) is proportional to the ratio between on the one hand the observed number of co-occurrences of items i and j and on the other hand the expected number of co-occurrences of items i and j under the assumption that occurrences of items i and j are statistically independent. We refer to Van Eck and Waltman (2009) for an extensive discussion of the advantages of the association strength over other similarity measures, such as the cosine and the Jaccard index.
Step 2: VOS mapping technique
We now discuss how the VOS mapping technique constructs a map based on the similarity matrix obtained in Step 1. A more elaborate discussion of the VOS mapping technique, including an analysis of the relation between the VOS mapping technique and multidimensional scaling, is provided by Van Eck and Waltman (2007a). Some results of an empirical comparison between the VOS mapping technique and multidimensional scaling are reported by Van Eck et al. (2008). A simple open source computer program that implements the VOS mapping technique is available at www.neesjanvaneck.nl/vos/.
Let n denote the number of items to be mapped. The VOS mapping technique constructs a two-dimensional map in which the items 1,…,n are located in such a way that the distance between any pair of items i and j reflects their similarity s ij as accurately as possible.Footnote 5 Items that have a high similarity should be located close to each other, while items that have a low similarity should be located far from each other. The idea of the VOS mapping technique is to minimize a weighted sum of the squared Euclidean distances between all pairs of items. The higher the similarity between two items, the higher the weight of their squared distance in the summation. To avoid trivial maps in which all items have the same location, the constraint is imposed that the average distance between two items must be equal to 1. In mathematical notation, the objective function to be minimized is given by
where the vector x i = (x i1, x i2) denotes the location of item i in a two-dimensional map and where ||•|| denotes the Euclidean norm. Minimization of the objective function is performed subject to the constraint
The constrained optimization problem of minimizing (2) subject to (3) is solved numerically in two steps. The constrained optimization problem is first converted into an unconstrained optimization problem. The latter problem is then solved using a so-called majorization algorithm. The majorization algorithm used by VOSviewer is a variant of the SMACOF algorithm described in the multidimensional scaling literature (e.g., Borg and Groenen 2005). To increase the likelihood of finding a globally optimal solution, the majorization algorithm can be run multiple times, each time using a different randomly generated initial solution.
Step 3: translation, rotation, and reflection
The optimization problem discussed in Step 2 does not have a unique globally optimal solution. This is because, if a solution is globally optimal, any translation, rotation, or reflection of the solution is also globally optimal (for a discussion of this issue in the multidimensional scaling context, see Borg and Groenen 2005). It is of course important that VOSviewer produces consistent results. The same co-occurrence matrix should therefore always yield the same map (ignoring differences caused by local optima). To accomplish this, it is necessary to transform the solution obtained for the optimization problem discussed in Step 2. VOSviewer applies the following three transformations to the solution:
-
Translation. The solution is translated in such a way that it becomes centered at the origin.
-
Rotation. The solution is rotated in such a way that the variance on the horizontal dimension is maximized. This transformation is known as principal component analysis.
-
Reflection. If the median of x11,…,xn1 is larger than 0, the solution is reflected in the vertical axis. If the median of x12,…,xn2 is larger than 0, the solution is reflected in the horizontal axis.
These three transformations are sufficient to ensure that VOSviewer produces consistent results.
Density view and cluster density view
In this section, we discuss the technical implementation of the density view and the cluster density view. Recall that in VOSviewer the cluster density view is available only if items have been assigned to clusters.
Density view
We first consider the density view (see also Van Eck and Waltman 2007b). Similar ideas can be found in the work of, for example, Eilers and Goeman (2004) and Van Liere and De Leeuw (2003).
In the density view, the color of a point in a map is determined based on the item density of the point. Let \( \bar{d} \) denote the average distance between two items, that is,
The item density D(x) of a point x = (x 1, x 2) is then defined as
where K: [0, ∞) → [0, ∞) denotes a kernel function, h > 0 denotes a parameter called the kernel width,Footnote 6 and w i denotes the weight of item i, that is, the total number of occurrences or co-occurrences of item i. The kernel function K must be non-increasing. VOSviewer uses a Gaussian kernel function given by
It follows from (5) that the item density of a point in a map depends both on the number of neighboring items and on the weights of these items. The larger the number of neighboring items and the smaller the distances between these items and the point of interest, the higher the item density. Also, the higher the weights of the neighboring items, the higher the item density. We note that the calculation of item densities using (5) is similar to the estimation of a probability density function using the technique of kernel density estimation (e.g., Scott 1992).
Item densities calculated using (5) are translated into colors using a color scheme. By default, VOSviewer uses a red–green–blue color scheme (see Fig. 5). In this color scheme, red corresponds with the highest item density and blue corresponds with the lowest item density.
Finally, we note that the above-described calculation of the color of a point in a map is performed only for a limited number of points. These points are located on a grid. The colors of points that do not lie on this grid are obtained through interpolation.
Cluster density view
We now consider the cluster density view. In this view, the item density of a point in a map is calculated separately for each cluster. The item density of a point x for a cluster p, denoted by D p(x), is defined as
where I p(i) denotes an indicator function that equals 1 if item i belongs to cluster p and that equals 0 otherwise. Like in the ordinary density view, K denotes the Gaussian kernel function given by (6).
After calculating item densities, the color of a point in a map is determined in two steps. Each cluster is associated with a color. In the first step, the colors of the clusters are mixed together. This is done by calculating a weighted average of the colors, where the weight of a color equals the item density for the corresponding cluster, as given by (7). In the second step, the color obtained in the first step is mixed with the (black or white) background color of the cluster density view. The proportion in which the two colors are mixed depends on the total item density of a point, which is given by (5). The lower the total item density of a point, the closer the color of the point is to the background color.
Large-scale application of VOSviewer
To demonstrate VOSviewer’s ability to handle large maps, we use the program to construct and display a co-citation map of 5,000 major scientific journals. For earlier studies in which journal maps of similar size were presented, we refer to Bollen et al. (2009), Boyack et al. (2005), and Leydesdorff (2004).
The journal co-citation map was constructed as follows. In the Web of Science database, we collected all citations from documents published in 2007 to documents published between 1997 and 2006. We only took into account documents of types article, note, and review. In total, we obtained about 17.5 million citations. It is well known that different scientific fields can have quite different citation practices. To correct for this, we source normalized all citations. By this we mean that if a document cites m other documents, we weighed each of the m citations by 1/m (cf. Small and Sweeney 1985). 10,603 journals turned out to have been cited at least once. Out of these journals, we selected the 5,000 journals with the largest number of source normalized citations. By multiplying the source-normalized citation matrix for these 5,000 journals with its transpose, we obtained a source-normalized co-citation matrix. We used this matrix as input for VOSviewer. Based on the co-citation matrix, VOSviewer constructed the journal co-citation map that is shown in Fig. 6. The interested reader may want to examine the map in full detail using VOSviewer. To do so, visit www.vosviewer.com/journalmap/.

Co-citation map of 5,000 major scientific journals (label view)
Our journal co-citation map provides an overview of the structure of the scientific world. Clusters of related journals can be identified in the map, and these clusters can be linked to scientific fields. Clusters that are located close to each other in the map indicate closely related fields. As can be seen in Fig. 6, the map has a more or less circular structure. The center of the map is relatively empty. At a global level, the interpretation of the map is fairly straightforward. The right part of the map covers the medical sciences. Moving counterclockwise from the medical sciences, the following major fields can be identified: life sciences, chemistry, physics, engineering, mathematics, computer science, social sciences, and psychology. Psychology is again closely related to the medical sciences, which completes the circular structure of the map.
There seems to be only one earlier study in which distance-based journal maps of similar size as our map were presented. This study was done by Boyack et al. (2005). Boyack et al. presented two kinds of journal maps, namely maps based on journal-to-journal citation data and maps based on journal co-citation data. Comparing the global structure of the maps of Boyack et al. with the global structure of our map, there turn out to be both some similarities and some differences. On the one hand, the way in which major scientific fields are located relative to each other is fairly similar in the maps of Boyack et al. and in our map. On the other hand, the general shape of the maps of Boyack et al. is quite different from the general shape of our map. In the maps of Boyack et al., clusters of journals are located more or less equally distributed within an almost perfect circle. This seems to be a structure that has been imposed by the VxOrd mapping technique used by Boyack et al. A disadvantage of this structure is that in the center of the maps of Boyack et al. different fields can be identified that do not really seem to have much in common. In our map constructed using VOSviewer, we cannot find any indications of a structure that has been imposed by the mapping technique. The general shape of our map seems to have been determined by the data rather than by the mapping technique that we used. A noticeable difference between our map and the maps of Boyack et al. is the relatively empty center of our map. Due to the relatively empty center, fields between which there are no strong relations are clearly separated from each other.
To show the importance of VOSviewer’s viewing capabilities, we examine one particular area in our journal co-citation map in more detail. Suppose that we are interested in the interface between the sciences and the social sciences. As can be seen in Fig. 6, an area where the sciences and the social sciences come together is between the fields of computer science (Lecture Notes in Computer Science) and economics (American Economic Review). However, Fig. 6 does not provide any detailed insight into this area. We therefore use VOSviewer to zoom in on the area. This yields Fig. 7. It is clear that Fig. 7 shows much more detail than Fig. 6. Unlike Figs. 6, Fig. 7 allows us to exactly identify the fields that are at the boundary between the sciences and the social sciences. These fields include artificial intelligence and machine learning (e.g., Lecture Notes in Artificial Intelligence and Machine Learning), operations research (e.g., European Journal of Operational Research and Management Science), statistics (e.g., Journal of the American Statistical Association), and transportation (e.g., Transportation Research Record).Footnote 7 Fig. 7 illustrates the importance of VOSviewer’s viewing capabilities. Without the zoom functionality of a computer program such as VOSviewer, only the global structure of a map can be inspected and detailed examinations of large maps such as our journal co-citation map are not possible.

The area between the fields of computer science and economics
Conclusion
In this paper, we have presented VOSviewer, a freely available computer program for constructing and viewing bibliometric maps. Unlike programs such as SPSS and Pajek, which are commonly used for bibliometric mapping, VOSviewer pays special attention to the graphical representation of bibliometric maps. The functionality of VOSviewer is especially useful for displaying large bibliometric maps in an easy-to-interpret way.
VOSviewer has been used successfully in various projects carried out by the Centre for Science and Technology Studies. In future research on bibliometric mapping, we expect to rely heavily on VOSviewer. By making VOSviewer freely available to the bibliometric research community, we hope that others will benefit from it as well.
Notes
We do not consider maps that are primarily intended for showing developments over time. Such maps are for example provided by the HistCite software of Eugene Garfield (e.g., Garfield, 2009).
A computer implementation of VxOrd is available at www.cs.sandia.gov/~smartin/software.html as part of the DrL toolbox.
For a more extensive discussion of the functionality of VOSviewer, we refer to the VOSviewer manual, which is available at www.vosviewer.com.
Although this is not directly visible in Fig. 4, we note that there is a large overlap in the map between the Business and Management subject categories of Thomson Reuters. This indicates an important difference between the clustering that we found and the clustering provided by the subject categories of Thomson Reuters.
The VOS mapping technique can also be used to construct maps in more than two dimensions. However, VOSviewer does not support this. The VOS software available at www.neesjanvaneck.nl/vos/ does support the construction of maps in more than two dimensions.
By default, VOSviewer uses h = 0.125. This generally seems to work fine. However, if necessary, the value of h can be changed.
Notice that Scientometrics is also visible in Fig. 7 (in the right part of the figure).
References
Ahlgren, P., Jarneving, B., & Rousseau, R. (2003). Requirements for a cocitation similarity measure, with special reference to Pearson’s correlation coefficient. Journal of the American Society for Information Science and Technology, 54(6), 550–560.
Bollen, J., Van de Sompel, H., Hagberg, A., Bettencourt, L., Chute, R., Rodriguez, M. A., et al. (2009). Clickstream data yields high-resolution maps of science. PLoS ONE, 4(3), 4803.
Borg, I., & Groenen, P. J. F. (2005). Modern multidimensional scaling (2nd ed.). Berlin: Springer.
Börner, K., Chen, C., & Boyack, K. W. (2003). Visualizing knowledge domains. Annual Review of Information Science and Technology, 37, 179–255.
Boyack, K. W., Klavans, R., & Börner, K. (2005). Mapping the backbone of science. Scientometrics, 64(3), 351–374.
Chen, C. (2003). Mapping scientific frontiers. Berlin: Springer.
Chen, C. (2006). CiteSpace II: Detecting and visualizing emerging trends and transient patterns in scientific literature. Journal of the American Society for Information Science and Technology, 57(3), 359–377.
Davidson, G. S., Wylie, B. N., & Boyack, K. W. (2001). Cluster stability and the use of noise in interpretation of clustering. In Proceedings of the IEEE symposium on information visualization 2001, pp. 23–30.
de Moya-Anegón, F., Vargas-Quesada, B., Chinchilla-Rodríguez, Z., Corera-Álvarez, E., Munoz-Fernández, F. J., & Herrero-Solana, V. (2007). Visualizing the marrow of science. Journal of the American Society for Information Science and Technology, 58(14), 2167–2179.
De Nooy, W., Mrvar, A., & Batagelj, V. (2005). Exploratory social network analysis with Pajek. Cambridge: Cambridge University Press.
Eilers, P. H. C., & Goeman, J. J. (2004). Enhancing scatterplots with smoothed densities. Bioinformatics, 20(5), 623–628.
Fruchterman, T. M. J., & Reingold, E. M. (1991). Graph drawing by force-directed placement. Software: Practice and Experience, 21(11), 1129–1164.
Garfield, E. (2009). From the science of science to Scientometrics visualizing the history of science with HistCite software. Journal of Informetrics, 3(3), 173–179.
Huisman, M., & Van Duijn, M. A. J. (2005). Software for social network analysis. In J. Scott, S. Wasserman, & P. J. Carrington (Eds.), Models and methods in social network analysis (pp. 270–316). Cambridge: Cambridge University Press.
Kamada, T., & Kawai, S. (1989). An algorithm for drawing general undirected graphs. Information Processing Letters, 31(1), 7–15.
Klavans, R., & Boyack, K. W. (2006a). Identifying a better measure of relatedness for mapping science. Journal of the American Society for Information Science and Technology, 57(2), 251–263.
Klavans, R., & Boyack, K. W. (2006b). Quantitative evaluation of large maps of science. Scientometrics, 68(3), 475–499.
Kopcsa, A., & Schiebel, E. (1998). Science and technology mapping: A new iteration model for representing multidimensional relationships. Journal of the American Society for Information Science, 49(1), 7–17.
Leydesdorff, L. (2004). Clusters and maps of science journals based on bi-connected graphs in Journal Citation Reports. Journal of Documentation, 60(4), 371–427.
Leydesdorff, L., & Rafols, I. (2009). A global map of science based on the ISI subject categories. Journal of the American Society for Information Science and Technology, 60(2), 348–362.
Peters, H. P. F., & Van Raan, A. F. J. (1993). Co-word-based science maps of chemical engineering. Part I: Representations by direct multidimensional scaling. Research Policy, 22(1), 23–45.
Rip, A., & Courtial, J.-P. (1984). Co-word maps of biotechnology: An example of cognitive scientometrics. Scientometrics, 6(6), 381–400.
Schvaneveldt, R. W. (Ed.). (1990). Pathfinder associative networks. Westport: Ablex.
Schvaneveldt, R. W., Dearholt, D. W., & Durso, F. T. (1988). Graph theoretic foundations of pathfinder networks. Computers and Mathematics with Applications, 15(4), 337–345.
Scott, D. W. (1992). Multivariate density estimation. London: Wiley.
Skupin, A. (2004). The world of geography: Visualizing a knowledge domain with cartographic means. Proceedings of the National Academy of Sciences, 101(Suppl 1), 5274–5278.
Small, H., & Sweeney, E. (1985). Clustering the Science Citation Index using co-citations. I. A comparison of methods. Scientometrics, 7(3–6), 391–409.
Van Eck, N. J., & Waltman, L. (2007a). VOS: A new method for visualizing similarities between objects. In H.-J. Lenz & R. Decker (Eds.), Advances in data analysis: Proceedings of the 30th annual conference of the German Classification Society (pp. 299–306). Heidelberg: Springer.
Van Eck, N. J., & Waltman, L. (2007b). Bibliometric mapping of the computational intelligence field. International Journal of Uncertainty, Fuzziness and Knowledge-Based Systems, 15(5), 625–645.
Van Eck, N. J., & Waltman, L. (2009). How to normalize cooccurrence data? An analysis of some well-known similarity measures. Journal of the American Society for Information Science and Technology, 60(8), 1635–1651.
Van Eck, N. J., Waltman, L., Dekker, R., & Van den Berg, J. (2008). An experimental comparison of bibliometric mapping techniques. Paper presented at the 10th International Conference on Science and Technology Indicators, Vienna.
Van Eck, N. J., Waltman, L., Noyons, E. C. M., & Buter, R. K. (in press). Automatic term identification for bibliometric mapping. Scientometrics.
Van Eck, N. J., Waltman, L., Van den Berg, J., & Kaymak, U. (2006). Visualizing the computational intelligence field. IEEE Computational Intelligence Magazine, 1(4), 6–10.
Van Liere, R., & De Leeuw, W. (2003). GraphSplatting: Visualizing graphs as continuous fields. IEEE Transactions on Visualization and Computer Graphics, 9(2), 206–212.
Vargas-Quesada, B., & de Moya-Anegón, F. (2007). Visualizing the structure of science. New York: Springer.
White, H. D. (2003). Pathfinder networks and author cocitation analysis: A remapping of paradigmatic information scientists. Journal of the American Society for Information Science and Technology, 54(5), 423–434.
Zitt, M., Bassecoulard, E., & Okubo, Y. (2000). Shadows of the past in international cooperation: Collaboration profiles of the top five producers of science. Scientometrics, 47(3), 627–657.
Acknowledgment
We thank Ed Noyons, Cathelijn Waaijer, and two anonymous referees for valuable comments on earlier drafts of this paper.
Open Access
This article is distributed under the terms of the Creative Commons Attribution Noncommercial License which permits any noncommercial use, distribution, and reproduction in any medium, provided the original author(s) and source are credited.
Author information
Authors and Affiliations
Corresponding author
Rights and permissions
Open Access This is an open access article distributed under the terms of the Creative Commons Attribution Noncommercial License (https://creativecommons.org/licenses/by-nc/2.0), which permits any noncommercial use, distribution, and reproduction in any medium, provided the original author(s) and source are credited.
About this article
Cite this article
van Eck, N.J., Waltman, L. Software survey: VOSviewer, a computer program for bibliometric mapping. Scientometrics 84, 523–538 (2010). https://doi.org/10.1007/s11192-009-0146-3
Received:
Published:
Issue Date:
DOI: https://doi.org/10.1007/s11192-009-0146-3