
Abstract
Long-term biological time series are essential to evaluate previous responses of organisms to alterations in the environment. Biochronological methods based on archival fish otoliths allow setting such time series, but their predictive potential as proxies of past environmental conditions is still underexploited. In this study, we reconstructed growth variation in European sprat (Sprattus sprattus) in the Baltic Sea from 1956 to 2020 based on measurements of the archived otoliths. We used otolith annual increment widths as a proxy of fish somatic growth. We showed significant negative relationships between sprat growth and sprat spawning stock biomass (SSB) associated with strong intraspecific competition for limited food resources. We also identified a link between sprat growth and water salinity—indicator of the ecosystem's hydrological situation. For the first time, we estimated the SSB prior to the period of available historical data based on the otolith-derived information on the past growth variation. This estimation was based on the strong relationships between SSB and fish growth, complemented with temperature and salinity variables as predictors (R2 = 0.62). A model trained on at least 40 years of data from the more recent past allows us to robustly back-estimate SSB. This study provides new multidecadal data, giving insights into environmental factors affecting the growth of Baltic sprat, and demonstrates the potential of otolith-based biochronology for the provisioning of independent indices of the historical fish stock size. The proposed methodological approach broadens the portfolio of possible applications of the biochronology time series to indicate past changes in the aquatic environment.
Graphical abstract

Introduction
Obtaining information about fish growth and stock dynamics and evaluating the relationships between these biological parameters and the environmental conditions over longer periods (i.e., multiple decades, or centuries) are among the key tasks in the current ecology and fisheries research (Free et al. 2019). Such long-term time series are still limited in aquatic, and especially in the marine environments (Richardson and Poloczanska 2008), hindering robust evaluation of previous dynamics of populations and their responses to the alterations in environmental conditions (Poloczanska et al. 2013). This scarcity of long-term environmental or fisheries data leads to risks of ‘shifting baseline syndrome’ where the perception of the status of the environment or resources is based only on limited, recent data (Pauly 1995; Pinnegar and Engelhard 2008). The biochronological methods based on measurements of otoliths have the potential for the development of independent long-term time series which allows for extending our scope back in time and appreciation of the past life-history, demographic, and environmental information (Morrongiello et al. 2012; Reis-Santos et al. 2022).
Otoliths are calcified structures located in the inner ear of fish that grow as the fish grow and commonly show increments corresponding to annual growth patterns (Campana and Thorrold 2001). For many fish species, otolith size is highly correlated with fish size (Harvey et al. 2000). Therefore, the width of an increment can be used as a proxy for somatic growth (Smoliński and Mirny 2017). An increasing number of studies use this biochronology approach to reconstruct fish growth variation over a longer time span (Denechaud et al. 2020). Since an enormous number of fish otoliths are collected every year and maintained in the archives worldwide (Campana and Thorrold 2001), they are becoming a resource for developing such a time series across a range of ecosystems and species, allowing for multi-sites and multi-taxa comparisons (Morrongiello et al. 2012).
Currently, the dominant perspective in studies using otolith-based biochronology of fish growth is oriented toward investigating the relationships between fish growth and environmental conditions and identifying the most important growth factors (Tao et al. 2018; Smoliński 2019a). However, over the past decade, many biochronology studies, beyond those in fishery science, have been dedicated to developing and optimizing environmental proxies (Peharda et al. 2021). The use of organisms’ hard parts (e.g. clams, skeletons) to hindcast the variability of the conditions in the aquatic environments is mainly limited to the sessile species, especially corals and mollusks (Morrongiello et al. 2012). The measurements of hard parts of these organisms permit reconstruction of the variability in a broad range of environmental factors, such as temperature, dissolved oxygen level, ocean circulation dynamics, or primary productivity (Peharda et al. 2021). We believe that this focus on reconstructing the environmental histories—as successfully applied in the case of sessile organisms—is largely overlooked in the biochronological studies based on fish otoliths (Morrongiello et al. 2012). Indeed, a study by Thresher et al. (2014) demonstrated the significant potential of otoliths as a tool to reconstruct past ocean conditions. By using otolith biochronology as a temperature proxy, they were able to determine intermediate water mass temperatures in both the Northern and Southern Hemispheres since the mid-1800s.
To the best of our knowledge, there are currently no attempts to investigate the applicability of the biochronological time series for the reconstruction of the past fish stock size. Since the correlation between adult growth and stock size is relatively strong and stable over time in pelagic fish (Rindorf et al. 2022), these species seem ideal candidates for such reconstructions. European sprat (Sprattus sprattus) is among these candidates—it is a dominating fish species in the Baltic ecosystem that feeds mainly on zooplankton in the pelagic zone (ICES 2022a). It has been shown previously that the high stock size causes strong intraspecific competition, which affects fish growth mainly through the modulation of the availability of mesozooplankton species (Cardinale et al. 2002; Möllmann et al. 2005; Casini et al. 2011). Therefore, it is reasonable to expect that an environmental signal associated with the changes in stock size can be detected through otolith-based growth studies (Smoliński et al. 2020) and can provide solid predictive power in the modeling of historical stock size.
In this study, we developed a multidecadal, annually resolved otolith-based biochronology of growth in European sprat. We hypothesized that a significant part of the variation in fish growth is related to intraspecific competition. We tested if this relationship is robust enough to enable the reconstruction of fish stock size based on growth biochronology. The newly developed multidecadal data on fish growth provides new knowledge and a long-term perspective on the growth responses of pelagic fish to environmental variability. We reconstructed the stock dynamics based on the biochronology of fish growth, reaching back before the period of available official estimates and indicating the potential of otolith-based biochronology for the provisioning of independent indices of the past stock size. The proposed methodological approach broadens the portfolio of possible applications of the biochronology time series to indicate past changes in the aquatic environment.
Materials and methods
Otolith data
We collected sagittal otolith samples mainly from the archives of the National Marine Fisheries Research Institute in Gdynia, Poland. We supplemented them from the Institute of Baltic Sea Fisheries in Rostock, Germany. Following the stratified sampling scheme, we aimed to achieve at least 10 otoliths of fish at different ages per collection year to better capture population demography and the variability of growth phenotypes (Morrongiello et al. 2012; Smoliński et al. 2020). Since otoliths from the years 1971–1977 were missing in the archives, we increased the number of samples from the years 1978–1980 to ~ 20 in order to increase the number of otolith measurements in the preceding period and allow for more robust estimation of interannual growth variation (Fig. 1b). Archival materials covered fish sampled from the commercial and research catches in two areas of the Baltic Sea—Gdańsk Basin and Bornholm Basin (Fig. 1a). These areas are important regions of the European sprat distribution in the Baltic Sea and the main fishing grounds (ICES 2022a). We selected samples collected from trawl catches to avoid problems of different gear types and associated size selectivity (Morrongiello et al. 2012). We aimed to extract otoliths from fish caught mainly in the 4th quarter of the year. This approach ensured easier interpretation of the last otolith annual increment which is typically well-formed in the autumn. This, in turn, helped in properly dating all annual increments to the year of their formation. Historical biological data on the age, sex, and length at the capture of selected fish individuals, as well as the date and location of sampling, was gathered together with the otolith materials.

Map of the study area (a), the temporal range of the otolith samples (b), and time series of spawning stock biomass (SSB) of sprat (c), mean annual water temperature (d), and mean annual water salinity (e). In (a) solid line indicates the sprat sampling area and the dashed line indicates the area over which temperature and salinity data were aggregated. In (b) each horizontal bar represents one sample (otolith) used in the analysis
We took special care in this study to mitigate age estimation errors that may introduce biases in the estimates of environmental effects on growth and distort the environmental signals present in the biochronological data sets (Smoliński et al. 2020). Age reading and increment measurements were conducted by one experienced age reader, resulting in consistent age estimations and increment measurements across multiple decades of biological material. This approach enabled us to remove inter-reader errors typically present in the biochronological data covering such a long period (Denechaud et al. 2020; Campana 2023). Additionally, the use of otoliths from short-lived species proved beneficial, as they are less influenced by age estimation errors compared to otoliths from long-lived species (Smoliński et al. 2020).
We captured high-resolution digital images of each otolith in reflected light using a stereomicroscope (Leica M 205 C) with a digital camera (Leica DFC 450). We interpreted counts of annual increments (pairs of opaque and translucent bands) as fish age, taking into account the date of capture and valid assessment of marginal increments (Morrongiello et al. 2014). We calculated the year of hatch using the information on the year of capture and age at capture and assigned each annual otolith increment to a year of formation. We measured the width of each annual otolith increment using an open-access, dedicated set of ObjectJ macros developed for the software ImageJ (Schneider et al. 2012; Denechaud et al. 2020). The measurements were conducted along the specified measurement axis, from the nucleus to the pararostral edge of the otolith. We discarded the first and the last increments from the analyses because they do not represent a whole year of fish growth due to the varying hatching and capture time (Smoliński 2019a; Barrow et al. 2021).
Environmental and fish stock data
We obtained the data on spawning stock biomass (SSB) of sprat in the Baltic Sea from the databases of the International Council for the Exploration of the Sea (ICES 2022b). We used SSB considering it an important indicator of the stock size. Since 93% of age 2 sprat are already mature at the spawning time (ICES 2022a) and the first years of growth (first annual increments) were excluded from the analysis, the use of SSB rather than total stock biomass was more reasonable. Available assessment data for sprat stock are based on the Virtual Population Analysis using the Extended Survival Analysis method (ICES 2022a). These official estimates of SSB are available from 1974 to the present (Fig. 1c). We complemented them with the reconstructed sprat SSB (reaching 1960) from the study by Eero (2012) based on the extended analytical stock assessment. These SSB estimates were taken as “observed”.
Based on the results of previous studies, we predicted that the growth of European sprat and stock size is mainly related to two key hydrological factors: temperature and salinity (Cardinale et al. 2002; Casini et al. 2011). Therefore, we obtained the most recent Met Office Hadley Centre EN series of temperature and salinity data (Good et al. 2013) from the KNMI Climate Explorer (Trouet and Van Oldenborgh 2013). EN data have a high geographical resolution (i.e. 1° × 1° grid) and spatial completeness enhanced using statistical methods. These data provide monthly averages of hydrological variables by approximately 10 m depth layers from the nineteenth century to the present, covering the whole period of available sprat growth data. The average annual hydrological conditions experienced by the studied fish were calculated for the area (Fig. 1a, d, e) selected using available information on the distribution of sprat in the Baltic Sea (ICES 2023) and the migration routes of this species (Aro 1989). Water temperature and salinity values were averaged between 0 and 100 m depth reflecting the depths occupied by sprat in this area (Orlowski 2005; Casini et al. 2011).
Data analysis
Because the otolith growth is tightly coupled to growth in fish length in Baltic stock of European sprat (R = 0.95, t = 17.373, df = 36, p < 0.001, Fig. S1), measured annual increment widths (n = 2446) were used as a proxy of somatic growth (Campana 1990). The fish length was not back-calculated (Campana 1990; Francis 1990) as the primary aim of the research was the assessment of the rates of change, while growth can be confounded by the size attained (Weisberg et al. 2010; Morrongiello et al. 2014, 2019).
We developed linear mixed-effects models (Zuur et al. 2009; Bates et al. 2015; Morrongiello and Thresher 2015) to properly decompose the observed variation in fish growth into different intrinsic (e.g. age, sex) and extrinsic environmental sources of variation and estimate interannual variability in growth (Weisberg et al. 2010; Morrongiello and Thresher 2015). This statistical method is appropriate for modeling fish growth when measurements of annual increments are taken repeatedly from one individual or within one year as random effect structures can more accurately represent the data’s hierarchy and interdependence of measurements (Weisberg et al. 2010; Morrongiello and Thresher 2015). Furthermore, the inclusion of random intercept and age slope for each fish allows for fitting individual age-dependent growth trajectories for each sample and minimizes the variations caused by the potential inconsistencies in the course of the axes used for otoliths measurements (Smoliński and Mirny 2017).
We used the widths of annual increment as the response variable. We log-transformed increment width, age, and age at capture (AAC) variables prior to the modeling. We selected the most optimal random effect structure in the model based on the Akaike Information Criterion (AIC; Burnham and Anderson 2004; Weisberg et al. 2010) including all potential fixed effects. Then, we developed a series of models with different fixed effects, i.e. age, sex, AAC, area (statistical subdivision of the ICES), and interaction between age and sex, and selected the most optimal model representing the growth of sprat using AIC. We compared random effect structures using the restricted maximum likelihood (REML) and fixed effect structures using the maximum likelihood approach. The final selected model was then refitted using REML.
We extended the basic growth model developed in the previous step to integrate extrinsic environmental factors. We included water temperature, water salinity, and sprat SSB as additional fixed effects in the model. Similar to the previous procedures, we developed a series of models incorporating different environmental effects and selected the optimal one with the AIC. We estimated the parameters of the extended environmental model with REML (Zuur et al. 2009). We calculated the conditional and marginal coefficient of determination (R2) of the final model in order to assess its quality (Nakagawa and Schielzeth 2013).
We refitted the environmental growth model without the sprat SSB term and extracted the best linear unbiased predictors (BLUP) of the year random effects from the model (Henderson 1975). The obtained time series of BLUP can be treated as a long-term index of the interannual sprat growth changes related to the factors unaccounted for in the model (Weisberg et al. 2010; Morrongiello and Thresher 2015; Smoliński et al. 2020). With this approach, the variation in fish growth associated with the hydrological effects was "filtered out" from the BLUP time series. However, the variation primarily related to the sprat stock biomass changes was preserved. This new time series is therefore a proxy that can be used in predicting the stock size. Hence, we refer to it as the growth-based stock index hereafter. A similar approach to the decomposition of growth variation has been applied in the previous study on Baltic herring (Smoliński 2019a).
We developed a linear model to backward estimate the stock size prior to the available stock data (before 1974), including water temperature, water salinity, and developed growth-based stock index. We utilized all available data for training the model, including official assessment estimates of the sprat stock size (ICES 2022a) and results from the extended analytical assessment (Eero 2012). We used partial coefficients of determination (R2) to evaluate the variance explained by each predictor (Edwards et al. 2008). We assessed the minimal length of required training SSB and hydrological (salinity and temperature) time series for a reliable reconstruction of the stock dynamics by measuring the performance of the models fitted with different lengths of time series (i.e. 20, 30, 40, 50, and 60 years of the most recent data) with the coefficient of determination (R2) and root mean squared error (RMSE).
We conducted the analyses and data visualization using the open-source R scientific computing language (R Core Team 2022) with packages lme4 (Bates et al. 2015) and MuMin (Bartoń 2019) for the development of models. We checked and satisfied the basic assumptions of the models using standard diagnostics.
Results
Fish otoliths selected for this study (n = 649) were collected in the years 1961–2021 (Figs. 1b, S2a). The annual otolith increments measured in this analysis (n = 2446) reflect the fish growth in the period 1956–2020 with a data gap in the years 1970–1973 (Figs. 1b, S2b). On average, there were 45 increment measurements per year, ranging from 27 to 72 increment measurements per year (Fig. S2b). The sampled fish ranged in age from 2 to 9 years, with the majority being 4 and 5 years old (Fig. S3). The average width of the otolith annual increment measured was 78.5 μm, with a range of 11.2–317.6 μm, showing a clear age-related decrease (Fig. S4).
SSB of sprat fluctuated considerably in the study period, as estimated from the official (ICES 2022a) and extended (Eero 2012) analytical stock assessment (Fig. 1c). It varied around 600 kt until 1990, increased abruptly in the 1990s (up to 1810 kt in the year 1996) and after the 1990s fluctuated around 940 kt. The mean water temperature showed a clear increasing trend with an average temperature of ~ 5.0 °C in the 1950s and ~ 6.0 °C in the 2010s (Fig. 1d). The mean water salinity varied significantly over the study period, with a noticeable downward shift at the end of the 1980s and abrupt increase in the years 2002–2007 (Fig. 1e).
The growth model with the lowest AICc included random intercepts for the year and fish ID, and random slope of age effect for each fish ID (Table S1). Comparisons of AICc values of alternative intrinsic models supported the inclusion of age and sex effects (Table S2). Among the models with environmental variables, the model with sprat SSB and mean water salinity achieved the lowest AICc (Table S3). The age effect explained most of the growth variation with a common age-related decline in fish growth (Table 1, Fig. 2a). Females showed faster growth than males (Table 1, Fig. 2b). Fish growth was negatively related to SSB and mean water salinity (Table 1, Fig. 2c, d). As predicted by the developed environmental model, within the observed range of stock size (199–1810 kt) and water salinity (10.46–11.19), individual growth changed by 33.6 and 10.2%, respectively. The optimal environmental model explained 82.8% of the variance in fish growth.
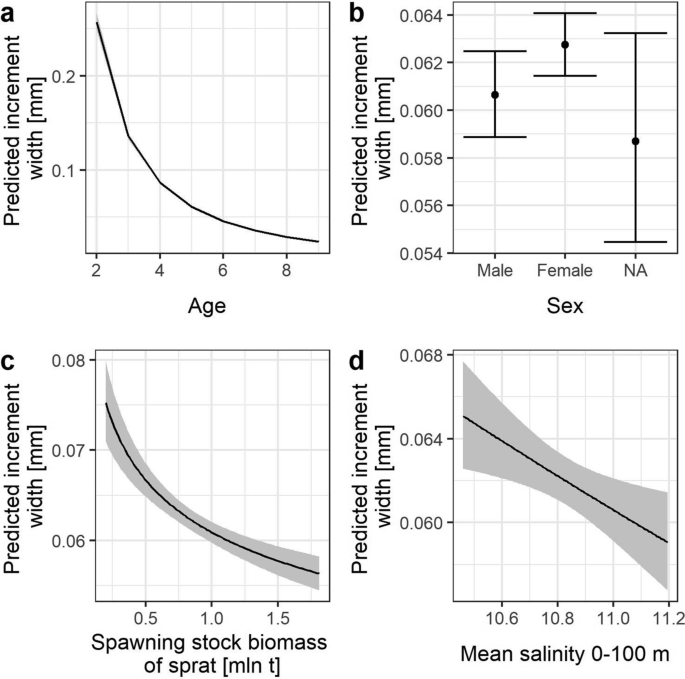
Predicted effect of age (a), sex (b), spawning stock biomass (c), and mean water salinity (d) on sprat growth. Shaded areas and error bars indicate 95% confidence intervals
The growth-based stock index, which was the BLUP of the year random effect extracted from the environmental model after the exclusion of the SSB effect, showed a high coherence with the SSB time series (Fig. 3). The signal retained in this time series indicated three periods with higher values (1964–1966, 1979–1981, 1988–1990) followed by a considerable decrease in the years 1990–1997, a return to the long-term average in the years 2000–2014, and another sharp decrease in the years 2014–2017 (Fig. 3a). A significant correlation between the growth-based stock index and sprat SSB (R = − 0.59, t = − 5.4149, df = 55, p value < 0.001) was observed (Fig. 3b).

Time series of growth-based stock index and spawning stock biomass (SSB) of sprat (a) and relationships between growth-based stock index and sprat SSB (b). Growth-based stock index is the best linear unbiased predictor extracted from the optimal environmental model after excluding the SSB effect, thus representing SSB effects and other effects that were not accounted for in this model. Solid and open points show official analytical stock assessment results for 1974-present (ICES 2022a) and extended 1960–1973 estimates (Eero 2012). Shaded areas depict mean ± standard error in (a) and 95% confidence intervals in (b)
The optimal linear model of sprat SSB included all three candidate variables with the growth-based stock index explaining the highest proportion of variance (45.6%) in the response variable, followed by water salinity (36.2%) and water temperature (10.4%). Overall the model explained 62.2% of the variance in the historical sprat SSB (Table 2). The comparison of “observed” sprat SSB and estimates predicted by alternative models, which were fitted with different numbers of the most recent years of training data, revealed that 40 years was sufficient to achieve relatively accurate estimates of the stock size (Fig. 4a). Although the model fitted with 30 years of data allowed for the reasonable reconstruction of the SSB time series in the last 30 years (period of data used to fit this model), it failed in the reconstruction of SSB in the earlier period. Sprat SSB reconstructed with at least 40 years of data followed well interannual fluctuations and matched the highest observed stock size (years 1996–1997) and the lowest stock size (years 1980–1981) observed in the original data (Fig. 4b). Sprat SSB predicted for the pre-assessment era with all three models trained with at least 40 years of data fitted well with the time series reconstructed in the independent study (Eero 2012) (Fig. 4b).

Comparison of predicted and “observed” sprat spawning stock biomass (SSB). Solid and open points show official analytical stock assessment results for 1974-present (ICES 2022a) and extended 1960–1973 estimates (Eero 2012)—both considered as “observed”. The number of most recent years of training data used to fit the model is indicated with colors and their temporal range with horizontal bars in (b). The thin diagonal grey line in (a) indicates perfect agreement, while thick color lines show a linear model fitted to the points. In (b) shaded areas depict 95% confidence intervals and the vertical dashed line indicates the start of the official ICES estimates on SSB
Discussion
In this study, we reconstructed the growth variation in Baltic sprat over 65 years and identified the factors influencing growth by measuring annual increments in archival otoliths. We observed an expected age-related decline in growth, a common feature of many fish species (Morrongiello et al. 2012; Smoliński 2019a). We also noted differences in the growth between males and females possibly associated with the variations in the age of maturation and growth-reproduction trade-offs. As sprat males appear to become mature at a smaller size (Grygiel and Wyszyński 2003), due to the earlier reproductive investment, their post-maturation growth can be lower than in females (Enberg et al. 2012).
We identified that among environmental factors, stock size, and hydrological conditions have high importance for the sprat individual growth. Our results are consistent with previous observations showing that sprat growth in the Baltic Sea was primarily determined by intraspecific competition for the limited zooplankton species constituting main prey items for fish (Horbowy and Swinder 1989; Möllmann et al. 2005; Casini et al. 2011). These include small-sized copepods Pseudocalanus sp., Temora longicornis, Eurytemora affinis, and Acartia spp. (Möllmann et al. 2004; Ojaveer et al. 2018). Negative density dependence effects on growth, where growth decreases with increasing stock density, is a common feature in many pelagic fish species, but these effects are visible mainly during the adult period (Rindorf et al. 2022). In the case of sprat, competition for limited food resources can intensify with age, as the diet spectrum is narrower in larger and older individuals, thereby reinforcing the competition among adults (Ojaveer et al. 2018).
Previous studies suggested that sprat condition (not linear body growth) may be affected by both intraspecific and interspecific competition (Cardinale et al. 2002; Casini et al. 2006). These effects have been measured by considering the total abundance of clupeids (sprat and herring Clupea harengus) in the Baltic Sea as a predictor. In our study, the inclusion of the herring biomass as an additional variable or incorporation of a variable representing all clupeids biomass did not improve the sprat growth model fit (additional tests, not presented). We hypothesize that in the Baltic ecosystem, the general consequences of exploitative competition between pelagic species are predominantly asymmetric. Specifically, Baltic herring growth is influenced by competition from sprat, as indicated e.g. in a previous biochronological study (Smoliński 2019a). The opposite influence of herring on sprat is generally weaker because herring is less efficient in finding and consuming prey and cannot outcompete sprat during foraging (Casini et al. 2011; Ojaveer et al. 2018). Moreover, sprat currently dominates over herring in the Baltic Sea in terms of biomass (ICES 2022a), thus thoroughly utilizing the available food niche for clupeids. However, these interspecific interactions can vary spatially (Cardinale et al. 2002; Casini et al. 2011). Nevertheless, studies unequivocally demonstrate the significant impact of sprat on the dynamics of the Baltic ecosystem (Möllmann et al. 2009; Tomczak et al. 2022).
We identified water salinity as the second environmental variable selected for our model, which had a negative effect on sprat growth. It has been shown that periods of major inflows of saline and cold waters deteriorate living conditions in some areas of the Baltic Sea, presumably forcing part of the sprat stock to migrate (Ojaveer and Kalejs 2010). This redistribution of individuals can increase density and strengthen density-dependent effects resulting in lower growth of individuals. Since sprat is a euryhaline species, we interpret the water salinity as a proxy of the overall hydrological situation in the Baltic Sea that modulates the structure and abundance of the zooplankton community and fish distribution rather than as a direct cause of the changes in the metabolism and growth of sprat (MacKenzie et al. 2007). Nevertheless, in line with previous studies, hydroclimatic effects had rather secondary importance for the growth of sprat (Casini et al. 2011). The influence of water salinity was found to be less significant compared to the stock size effect; the predicted growth change within the observed range of values was threefold smaller for salinity than for sprat SSB. Thus, this effect should be interpreted with caution.
Pinnegar and Engelhard (2008) found that, worldwide, most fisheries assessments and time series of biomass estimates were less than 30 years old. Extending time series of stock dynamics utilizing conventional data-demanding techniques for many fish stocks may prove challenging due to the limited availability of historical data (Eero and MacKenzie 2011; Eero 2012). For this reason, developing alternative methods, such as otolith-based biochronologies, can play a role in bridging this data gap. In this study, we extended the stock biomass estimates back in time, before the period of analytical assessment, based on the developed otolith biochronology time series representing past fish growth variations. The developed growth-based stock index was the most powerful predictor of sprat SSB among those used in the model. Sprat SSB was negatively related to the mean growth of the individuals in the stock due to the strong intraspecific competition for limited food resources (Horbowy and Swinder 1989; Möllmann et al. 2005; Casini et al. 2011) discussed above in the context of the growth model. The inclusion of mean annual water temperature and salinity improved the reconstruction accuracy as they are important factors of the sprat stock biomass dynamics (MacKenzie et al. 2008; Ojaveer and Kalejs 2010). The higher temperature has a positive effect on the recruitment of sprat and for consequent spawning stock biomass, e.g., by direct effects on mortality, growth, the timing of maturation, or egg production as well as indirectly by reinforcing spring production of zooplankton constituting essential prey both for larvae and adult sprat (MacKenzie et al. 2008; Smoliński 2019b). We identified a negative effect of water salinity that explained a moderate part of the variance in the sprat SSB. In the freshening periods, an additional volume of water with sufficient oxygen and temperature conditions is formed in different regions of the Baltic Sea which creates a favorable environment for sprat leading to extraordinarily high biomass and abundance (Ojaveer and Kalejs 2010). Moreover, inflows of saline and cold waters into the Baltic result in increased egg mortality caused by the hydrographic conditions (Voss et al. 2011), which can reduce recruitment success and, with a certain time lag, also negatively influence spawning stock biomass (MacKenzie et al. 2008).
Although water temperature and salinity, combined with the growth-based stock index developed here explained a large part of the variation in historical sprat stock biomass, further incorporation of the environmental data could improve the accuracy of model predictions. However, we consciously limited predictors to these two common hydrological variables freely available for most of the marine areas in reasonable spatial resolution (Good et al. 2013) to demonstrate that such biochronological techniques have the potential to be applied in other parts of the global ocean. Likewise, gridded air temperature and precipitation data can be used to derive water temperature and flow proxies and integrated into similar modeling of freshwater species growth and stock size.
Validation of the method with the times series of different lengths showed that 40 years of the SSB data was needed to fit a relatively robust model of SSB for sprat in the Baltic Sea. We suspect that, in general, the required length of SSB data depends on the strength of the relationships between fish growth and stock size, and the relative contribution of different sources of variation, including other environmental conditions. Interestingly, since the increase in the Baltic sprat SSB is typically observed after successful recruitment (at age 1) with one year lag, high SSB predicted for 1957, 1959, and 1961 in our model with at least 40 years of data match well with successful recruitment events in 1956, 1958, and 1960 estimated during extended analytical assessment by Eero (2012). This demonstrates that the stock size signal was well preserved early in the time series and can be reconstructed by the model even with the limited time span of training data.
The model used to reconstruct past stock SSB is based on the assessment model output, which is inevitably associated with uncertainty (Brooks and Deroba 2015). Although quality controlled, gridded hydrological data can also be unreliable, especially during periods and in areas where direct observations are limited (Good et al. 2013). Other sources of uncertainty that may affect the accuracy of the final stock biomass reconstructions include errors in the age estimation based on the otoliths and measurements of the otolith increments, as well as errors in estimates of the year random effects in the model that are used as a growth-based index of stock size (Smoliński et al. 2020). These uncertainties, which propagate into secondary analyses, are hard to quantify and are rarely investigated in ecological studies. There are also potential difficulties in the prediction of past SSB outside of the observed range of variables. In many cases, only data from the period of already fished stock are available. Under the fishing pressure, typical stock size is already limited and extrapolation of the predictions into the higher stock sizes in the pre-fisheries era may be problematic. This also relates to the general problem of the assumptions on the equal ecosystem and stock productivity over time (Eero and MacKenzie 2011; Horbowy and Tomczak 2017) and the constant relationships between growth and SSB. Possible changes in the productivity of the ecosystem are partially accounted for in this study by the integration of additional hydrological variables which modulate the ecosystem state. After the inclusion of water temperature and salinity, we corrected the temporal pattern of the residuals observed in the initial predictive model developed with growth information only.
In this study, we showed a new methodological concept that can serve as a basis for the further development of the techniques for the reconstruction of the fish stock size in the past. This proposed methodological approach broadens the portfolio of possible applications of the biochronological time series for the indication of the changes in the aquatic environment. This method can potentially be applied in stocks where the time series representing stock size are constrained only to the most recent periods, but archival collections of calcified structures (e.g. otoliths, scales, or vertebrae) are available (Morrongiello et al. 2012). Our study demonstrates that utilization of the calcified structures to hindcast the variability of the conditions in the aquatic environments is not necessarily limited to the sessile organisms, like corals and mollusks. Moreover, we believe that it can be successfully applied in freshwater ecosystems, where density-dependence effects are also present (Amundsen et al. 2007; Lorenzen 2008). Under certain assumptions, similar biochronological approaches can be used in paleoecological investigations to indicate potential fluctuations in past stock sizes (Leonhard and Agiadi 2023). This type of information can be used in the research on the functioning of the whole ecosystem, e.g., to parameterize ecosystem models in long-term simulations or studies aimed at ecosystem regime shift detection (e.g. Tomczak et al. 2022), but also for improving and validating the models of stock development under future environmental change (Eero 2012). Further extension of the stock dynamic time series into the pre-fishing period can help in disentangling the simultaneous, sometimes synergistic, environmental (e.g. hydrological, climatic) and fishing influences on the population dynamics (Pinnegar and Engelhard 2008). Extension of the temporal perspective in ecological studies will help us to avoid the risk of ‘‘shifting baseline syndrome’’, where information from the present or recent past is used as the quality standard for ecological status (Pauly 1995; MacKenzie et al. 2011).
Availability of data and materials
The data is available on reasonable request.
References
Amundsen PA, Knudsen R, Klemetsen A (2007) Intraspecific competition and density dependence of food consumption and growth in Arctic charr. J Anim Ecol 76:149–158. https://doi.org/10.1111/j.1365-2656.2006.01179.x
Aro E (1989) A review of fish migration patterns in the Baltic Sea. Rapp Proces-Verbaux des Reunions. Cons Int Pour L’explor La Mer 190:72–96
Barrow JS, Yen JDL, Koehn JD et al (2021) Lifetime movement history is associated with variable growth of a potamodromous freshwater fish. J Anim Ecol 90:2560–2572. https://doi.org/10.1111/1365-2656.13561
Bartoń K (2019) Package MuMIn: Multi-Model Inference
Bates DM, Maechler M, Bolker B, Walker S (2015) Fitting linear mixed-effects models using lme4. J Stat Softw 67:1–48. https://doi.org/10.1177/009286150103500418
Brooks EN, Deroba JJ (2015) When “data” are not data: the pitfalls of post hoc analyses that use stock assessment model output. Can J Fish Aquat Sci 72:634–641. https://doi.org/10.1139/cjfas-2014-0231
Burnham KP, Anderson RP (2004) Multimodel inference: understanding AIC and BIC in model selection. Sociol Methods Res 33:261–304. https://doi.org/10.1177/0049124104268644
Campana SE (1990) How reliable are growth back-calculations based on otoliths? Can J Fish Aquat Sci 47:2219–2227
Campana SE (2023) Long-term shifts in otolith age interpretations. Fish Res 263:106681. https://doi.org/10.1016/j.fishres.2023.106681
Campana SE, Thorrold SR (2001) Otoliths, increments, and elements: keys to a comprehensive understanding of fish populations? Can J Fish Aquat Sci 58:30–38. https://doi.org/10.1139/f00-177
Cardinale M, Casini M, Arrhenius F (2002) The influence of biotic and abiotic factors on growth of sprat (Sprattus sprattus) in the Baltic Sea. Aquat Living Resour 15:273–281. https://doi.org/10.11609/JoTT.ZPJ.18.1.982-6
Casini M, Cardinale M, Hjelm J (2006) Inter-annual variation in herring, Clupea harengus, and sprat, Sprattus sprattus, condition in the central Baltic Sea: what gives the tune? Oikos 112:638–650
Casini M, Jonsson P, Cardinale M et al (2011) Spatial and temporal density dependence regulates the condition of central Baltic Sea clupeids: compelling evidence using an extensive international acoustic survey. Popul Ecol 53:511–523. https://doi.org/10.1007/s10144-011-0269-2
Denechaud C, Smoliński S, Geffen AJ et al (2020) A century of fish growth in relation to climate change, population dynamics and exploitation. Glob Chang Biol 26:5661–5678. https://doi.org/10.1111/gcb.15298
Edwards LJ, Muller KE, Wolfinger RD et al (2008) An R2 statistic for fixed effects in the linear mixed model. Stat Med 27:6137–6157. https://doi.org/10.1002/sim.3429
Eero M (2012) Reconstructing the population dynamics of sprat (Sprattus sprattus balticus) in the Baltic Sea in the 20th century. ICES J Mar Sci 69:1010–1018
Eero M, MacKenzie BR (2011) Extending time series of fish biomasses using a simple surplus production-based approach. Mar Ecol Prog Ser 440:191–202. https://doi.org/10.3354/meps09346
Enberg K, Jørgensen C, Dunlop ES et al (2012) Fishing-induced evolution of growth: concepts, mechanisms and the empirical evidence. Mar Ecol 33:1–25. https://doi.org/10.1111/j.1439-0485.2011.00460.x
Francis RICC (1990) Back-calculation of fish length: a critical review. J Fish Biol 36:883–902. https://doi.org/10.1111/j.1095-8649.1990.tb05636.x
Free CM, Thorson JT, Pinsky ML et al (2019) Impacts of historical warming on marine fisheries production. Science 363:979–983. https://doi.org/10.1126/science.aau1758
Good SA, Martin MJ, Rayner NA (2013) EN4: Quality controlled ocean temperature and salinity profiles and monthly objective analyses with uncertainty estimates. J Geophys Res Ocean 118:6704–6716. https://doi.org/10.1002/2013JC009067
Grygiel W, Wyszyński M (2003) Temporal (1980–2001) and geographic variation in the sexual maturity at age and length of herring and sprat inhabiting the southern Baltic. Bull Sea Fish Inst 159:3–34
Harvey JT, Loughlin TR, Perez MA, Oxman DS (2000) Relationship between fish size and otolith length for 63 species of fishes from the Eastern North Pacific Ocean. NOAA Technical Report NMFS 150
Henderson CR (1975) Best linear unbiased estimation and prediction under a selection model. Biometrics 31:423–447
Horbowy J, Swinder M (1989) Growth of Baltic sprat in relation to stock density and food biomass. Rapp P-V Réun Cons Int Explor Mer 190:102–104
Horbowy J, Tomczak MT (2017) Extension of biomass estimates to pre-assessment periods using density dependent surplus production approach. PLoS ONE 12:1–19. https://doi.org/10.1371/journal.pone.0186830
ICES (2022b) ICES Stock Assessment Database. Copenhagen, Denmark. ICES. [Accessed 21.10.2022]. https://standardgraphs.ices.dk
ICES (2022) Baltic fisheries assessment working group (WGBFAS). ICES Sci Rep 4:559
ICES (2023) Working group on Baltic International Fish Survey (WGBIFS; outputs from 2022 meeting). ICES Sci Reports 5:529
Leonhard I, Agiadi K (2023) Addressing challenges in marine conservation with fish otoliths and their death assemblages. Geol Soc London, Spec Publ 529:SP529-2022
Lorenzen K (2008) Fish population regulation beyond “stock and recruitment”: the role of density-dependent growth in the recruited stock. Bull Mar Sci 83:181–196
MacKenzie BR, Gislason H, Möllmann C, Köster FW (2007) Impact of 21st century climate change on the Baltic Sea fish community and fisheries. Glob Chang Biol 13:1348–1367. https://doi.org/10.1111/j.1365-2486.2007.01369.x
MacKenzie BR, Horbowy J, Köster FW (2008) Incorporating environmental variability in stock assessment: predicting recruitment, spawner biomass, and landings of sprat (Sprattus sprattus) in the Baltic Sea. Can J Fish Aquat Sci 65:1334–1341. https://doi.org/10.1139/F08-051
MacKenzie BR, Ojaveer H, Eero M (2011) Historical ecology provides new insights for ecosystem management: eastern Baltic cod case study. Mar Policy 35:266–270. https://doi.org/10.1016/j.marpol.2010.10.004
Möllmann C, Kornilovs G, Fetter ANM (2004) Feeding ecology of central Baltic Sea herring and sprat. J Fish Biol 65:1563–1581. https://doi.org/10.1111/j.1095-8649.2004.00566.x
Möllmann C, Kornilovs G, Fetter M, Köster FW (2005) Climate, zooplankton, and pelagic fish growth in the central Baltic Sea. ICES J Mar Sci 62:1270–1280. https://doi.org/10.1016/j.icesjms.2005.04.021
Möllmann C, Diekmann R, Müller-Karulis B et al (2009) Reorganization of a large marine ecosystem due to atmospheric and anthropogenic pressure: a discontinuous regime shift in the Central Baltic Sea. Glob Chang Biol 15:1377–1393. https://doi.org/10.1111/j.1365-2486.2008.01814.x
Morrongiello JR, Thresher R (2015) A statistical framework to explore ontogenetic growth variation among individuals and populations: a marine fish example. Ecol Monogr 85:93–115
Morrongiello JR, Thresher RE, Smith DC (2012) Aquatic biochronologies and climate change. Nat Clim Chang 2:849–857. https://doi.org/10.1038/nclimate1616
Morrongiello JR, Walsh CT, Gray CA et al (2014) Environmental change drives long-term recruitment and growth variation in an estuarine fish. Glob Chang Biol 20:1844–1860. https://doi.org/10.1111/gcb.12545
Morrongiello JR, Sweetman PC, Thresher RE (2019) Fishing constrains phenotypic responses of marine fish to climate variability. J Anim Ecol 88:1645–1656. https://doi.org/10.1111/1365-2656.12999
Nakagawa S, Schielzeth H (2013) A general and simple method for obtaining R2 from generalized linear mixed-effects models. Methods Ecol Evol 4:133–142. https://doi.org/10.1111/j.2041-210x.2012.00261.x
Ojaveer E, Kalejs M (2010) Ecology and long-term forecasting of sprat (Sprattus sprattus balticus) stock in the Baltic Sea: a review. Rev Fish Biol Fish 20:203–217. https://doi.org/10.1007/s11160-009-9130-5
Ojaveer H, Lankov A, Raid T et al (2018) Selecting for three copepods—feeding of sprat and herring in the Baltic Sea. ICES J Mar Sci. https://doi.org/10.1093/icesjms/fsx249
Orlowski A (2005) Experimental verification of the acoustic characteristics of the clupeoid diel cycle in the Baltic. ICES J Mar Sci 62:1180–1190. https://doi.org/10.1016/j.icesjms.2005.02.013
Pauly D (1995) Anecdotes and the shifting baseline syndrome of fisheries. Trends Ecol Evol 10:430
Peharda M, Schöne BR, Black BA, Corrége T (2021) Advances of sclerochronology research in the last decade. Palaeogeogr Palaeoclimatol Palaeoecol 570:110371. https://doi.org/10.1016/j.palaeo.2021.110371
Pinnegar JK, Engelhard GH (2008) The “shifting baseline” phenomenon: a global perspective. Rev Fish Biol Fish 18:1–16. https://doi.org/10.1007/s11160-007-9058-6
Poloczanska ES, Brown CJ, Sydeman WJ et al (2013) Global imprint of climate change on marine life. Nat Clim Chang 3:919–925. https://doi.org/10.1038/Nclimate1958
R Core Team (2022) R: a language and environment for statistical computing. Austria, Vienna
Reis-Santos P, Gillanders BM, Sturrock AM et al (2022) Reading the biomineralized book of life: expanding otolith biogeochemical research and applications for fisheries and ecosystem-based management. Rev Fish Biol Fish 33:411–449. https://doi.org/10.1007/s11160-022-09720-z
Richardson AJ, Poloczanska ES (2008) Under-resourced, under threat. Science 320:1294–1295
Rindorf A, van Deurs M, Howell D et al (2022) Strength and consistency of density dependence in marine fish productivity. Fish Fish 23:812–828. https://doi.org/10.1111/faf.12650
Schneider C, Rasband W, Eliceiri K (2012) NIH image to ImageJ: 25 years of image analysis. Nat Methods 9:671–675. https://doi.org/10.1007/978-1-84882-087-6_9
Smoliński S (2019a) Sclerochronological approach for the identification of herring growth drivers in the Baltic Sea. Ecol Indic 101:420–431. https://doi.org/10.1016/j.ecolind.2019.01.050
Smoliński S (2019b) Incorporation of optimal environmental signals in the prediction of fish recruitment using random forest algorithms. Can J Fish Aquat Sci. https://doi.org/10.1139/cjfas-2017-0554
Smoliński S, Mirny Z (2017) Otolith biochronology as an indicator of marine fish responses to hydroclimatic conditions and ecosystem regime shifts. Ecol Indic 79:286–294. https://doi.org/10.1016/j.ecolind.2017.04.028
Smoliński S, Morrongiello J, Van Der Sleen P et al (2020) Potential sources of bias in the climate sensitivities of fish otolith biochronologies. Can J Fish Aquat Sci 77:1552–1563. https://doi.org/10.1139/cjfas-2019-0450
Tao J, Kennard MJ, Jia Y, Chen Y (2018) Climate-driven synchrony in growth-increment chronologies of fish from the world’s largest high-elevation river. Sci Total Environ 645:339–346. https://doi.org/10.1016/j.scitotenv.2018.07.108
Thresher R, Morrongiello J, Sloyan BM et al (2014) Parallel decadal variability of inferred water temperatures for Northern and Southern Hemisphere intermediate water masses. Geophys Res Lett 41:1232–1237. https://doi.org/10.1002/2013GL058638
Tomczak MT, Müller-Karulis B, Blenckner T et al (2022) Reference state, structure, regime shifts, and regulatory drivers in a coastal sea over the last century: the Central Baltic Sea case. Limnol Oceanogr 67:S266–S284. https://doi.org/10.1002/lno.11975
Trouet V, Van Oldenborgh GJ (2013) KNMI climate explorer: a web-based research tool for high-resolution paleoclimatology. Tree-Ring Res 69:3–13. https://doi.org/10.3959/1536-1098-69.1.3
Voss R, Hinrichsen HH, Stepputtis D et al (2011) Egg mortality: predation and hydrography in the central Baltic. ICES J Mar Sci 68:1379–1390. https://doi.org/10.1093/icesjms/fsr061
Weisberg S, Spangler G, Richmond LS (2010) Mixed effects models for fish growth. Can J Fish Aquat Sci 277:269–277. https://doi.org/10.1139/F09-181
Zuur AF, Ieno EN, Walker NJ et al (2009) Mixed effects models and extensions in ecology with R. Springer, New York
Acknowledgements
We acknowledge the Thünen Institute of Baltic Sea Fisheries, Germany, especially Mario Koth, for providing the otoliths collected from 1978 to 1980. We are indebted to the many individuals, who have helped gather the samples through the years. We thank the editor and anonymous reviewers for their comments and suggestions that improved the manuscript.
Author information
Authors and Affiliations
Contributions
SS: Conceptualization; Methodology; Formal analysis; Writing-original draft; Writing-review and editing. JG: Investigation; Writing- review and editing.
Corresponding author
Ethics declarations
Conflict of interest
The authors have no relevant financial or non-financial interests to disclose. No special funding was received for conducting this study.
Additional information
Publisher's Note
Springer Nature remains neutral with regard to jurisdictional claims in published maps and institutional affiliations.
Supplementary Information
Below is the link to the electronic supplementary material.
Rights and permissions
Open Access This article is licensed under a Creative Commons Attribution 4.0 International License, which permits use, sharing, adaptation, distribution and reproduction in any medium or format, as long as you give appropriate credit to the original author(s) and the source, provide a link to the Creative Commons licence, and indicate if changes were made. The images or other third party material in this article are included in the article's Creative Commons licence, unless indicated otherwise in a credit line to the material. If material is not included in the article's Creative Commons licence and your intended use is not permitted by statutory regulation or exceeds the permitted use, you will need to obtain permission directly from the copyright holder. To view a copy of this licence, visit http://creativecommons.org/licenses/by/4.0/.
About this article

Cite this article
Smoliński, S., Gutkowska, J. Otolith biochronology for the long-term reconstruction of growth and stock dynamics of fish. Rev Fish Biol Fisheries 34, 405–419 (2024). https://doi.org/10.1007/s11160-023-09820-4
Received:
Accepted:
Published:
Issue Date:
DOI: https://doi.org/10.1007/s11160-023-09820-4