
Abstract
The European single market in electricity has been promoted vigorously by the European Commission since 1996. We discuss how national electricity markets and cross-border electricity markets have been reshaped by the process. We examine the Commission’s own work on evaluating the benefits of the single market. We look at the wider evidence of impact on prices, security of supply, the environment, and innovation. We conclude that the institutional changes are extensive and there has been significant market harmonisation and integration. However, the measured benefits are difficult to identify, but likely to be small. This is partly because over the same period there has been a large rise in subsidised renewable generation that is driven by the decarbonisation agenda.
1 Background to the Single Market in Electricity
As early as 1988 the European CommissionFootnote 1 began considering how the Single European Act of 1986—which paved the way for the European Single Market—might be applied in the energy sector, specifically to electricity and gas supply. This began a long process of opening national wholesale and retail electricity and gas markets to trade and competition across the single market area.
What has happened to national electricity markets in Europe since then is a fascinating economic story and is a textbook case study in how the process of European market integration has worked and the difficulties to be overcome in achieving such integration. Globally electricity is not a heavily traded good. Of all gross electricity production only around 3% was exported across national borders in 2015, and most of this trade occurred in Europe (with a significant share of the rest being between the US and Canada).Footnote 2 This makes electricity much less heavily traded than oil, gas, and coal.
While electricity trading across European borders is a key part of the single market in electricity story, it is by no means all of it. National electricity systems and policies have been significantly altered by the requirements of the single market; and indeed these effects have been at least as important as what has happened to cross-border trading of wholesale electricity. Here the requirement for national policies to adhere to the requirements of European directives have affected the organization of the sector and its regulation. Combined with other EU energy policies—towards carbon trading (which covers the electricity sector); 2020 renewable electricity and energy targets; and energy security and energy efficiency—national electricity sectors have gone through profound changes.
The primary legislative means by which the EU has brought about this change is through three single electricity market directives in 1996 (96/92/EC), 2003 (03/54/EC) and 2009 (09/72/EC): These directives have required member states (and Norway as a non-EU member of the single electricity marketFootnote 3) to meet certain requirements in their national legislation, as well as setting out pan-European policy. The electricity sector comprises of a number of elements, each of which has been affected by the directives: generation (power plants); transmission (high voltage wires); distribution (lower voltage wires); retail suppliers (who bill final customers); customers (who might choose suppliers); the degree of unbundling (both horizontal and vertical between generation, transmission, distribution, retail); and cross-border trading over interconnectors.Footnote 4
Prior to the 1996 directive a few single market countries—such as Norway, Sweden, and the UK—had liberalized their electricity sectors to create wholesale power markets and introduced competition in the early 1990s. However, across most of the EU, generation, transmission, distribution, and retail supply were largely in the hands of incumbent domestic monopolists (such as EdF in France, or ENEL in Italy). Horizontal bundling was the norm, with no competition in each segment of the industry. Often incumbent monopolists ranged across generation, transmission, distribution, and retail; they exhibited large degrees of vertical bundling of assets.
Customers of these monopolists had no choice of supplier, no matter how large the customers were. Cross-border trade was controlled by bilateral monopolists on both sides of the border, which were able to set cross-border tariffs and allocate cross-border transfer capacity. The only example of cross-border trading on a market basis was between Norway, Sweden, and later Finland, within a market arrangement called NordPool.
The directives changed this radically by establishing a process of opening the market to competition across the EU. Essentially this process forced all member countries both to follow the example of the early market-reforming states nationally and to promote a genuine cross-border market.
The 1996 directive envisaged that by the end of 1999 all generation would be either subject to free entry into a wholesale market arrangement or competitively procured by a single buyer under a tendering procedure; all access to the transmission and distribution system would be subject to negotiated or regulated third party (RTP) access on common terms, in the absence of a single buyer; retail suppliers could freely compete with one another to acquire customers; the largest customers—representing about 1/3 of demand—could choose their retail supplier; all remaining vertically bundled transmission and distribution businesses would have to produce separate accounts (so called ‘accounting unbundling’); and all cross-border trade would be subject to at least negotiated third party access.
The 1996 directive offered a number of options that countries could take—such as the choice of negotiated or regulated third-party access—as a way of persuading initially reluctant reformers (such as France) to begin their reform process. Individual EU member states (MSs) were free to adopt the more competitive arrangements more quickly and indeed to go further than the minimum that was required by the directive: such as giving all customers free choice of retail supplier, which happened in the UK in 1999.
The 2003 directive (03/54/EC) envisaged that by the end of 2007Footnote 5: all generation would be subject to free entry into a wholesale market arrangement; all access to the transmission and distribution system would be subject to regulated third-party access on common terms; retail suppliers could freely compete with one another to acquire customers; all customers, including households of any size, could choose their retail supplier; all remaining vertically bundled transmission and distribution businesses would have to be held in legally separate business units (legal unbundling); and all cross-border trade would be subject to regulated third-party access.
The 2003 directive extended the scope of wholesale and retail competition and was a way of forcing slowly reforming MSs to go further in an environment where leading countries were already completing their own internal market in electricity (see Jamasb and Pollitt 2005). The 2003 directive also required MSs to have a national electricity regulator with a degree of independence from government responsible for regulating the charges of the incumbent transmission and distribution companies and ensuring non-discriminatory network access.
A very visible effect of the directives (and of the Single Market more generally) was that it unleashed a wave of mergers across the EU of electricity and gas companies. EdF, RWE, E.ON, Iberdrola, ENEL, and Vattenfall expanded substantially outside their home markets in both generation and retail. In the UK, for instance, EdF, RWE, and E.ON became the three largest generators and three of the largest retailers. By the mid-2000s many of the smaller European generators and retailers had been taken over by major pan-European companies.
What followed the enforcement of the 2003 directive was a growing realization that while much progress had been made in reforming national electricity markets and the internationalization of ownership, very little progress had been made in creating a genuine single market in electricity with wholesale markets extending across borders. In 2004, the European Commission began to support what became known as the ‘target model’,Footnote 6 which envisaged the gradual integration of national electricity markets, through a system of market coupling, whereby national markets would be merged or coordinated.
Prior to market coupling a trader that wished to sell electricity between two markets would need to buy the power in one market, sell the power in another, and separately procure the transfer capacity on the interconnector between them. This was a costly and inaccurate process—especially if trading periods were not coordinated across the three transactions.
Under market coupling, available transfer capacity is declared to the markets, and power can be bought and sold between the two markets—subject to one market-clearing algorithm. If there is enough transfer capacity, the prices in the two markets will be the same; if there is a transmission capacity constraint, power should be seen to flow from the low-price market to high-price market.
The period since 2004 has seen a large increase in the degree of coordination between day-ahead wholesale markets as a result of the extension of individual markets and the coupling between markets.
Progress on market design has been assisted by pan-European competition policy in electricity. MSs have traditionally been somewhat reluctant to increase imports of electricity, so as to protect their domestic generators (from increased competition) and partly for reasons of energy security (by making it easier for national system operators to manage their system by simply adjusting national supply and demand). This has led to allegations that transfer capacity was not being allocated efficiently at the border and that available capacity was not being offered to the market.
In response to this and other concerns about the slow progress in the creation of single market, the European Commission began a major energy sector competition inquiry in 2005. The inquiry reported in 2007 (European Commission 2007) and spurred competition enforcement action and the third electricity single market directive in 2009. This directive significantly strengthened the unbundling requirements on transmission businesses and created a preferred model of ownership unbundling. It also established a pan-European regulatory agency for electricity and gas (Agency for the Cooperation of Energy Regulators-ACER).Footnote 7 This agency was charged with dispute regulation between national regulators and the monitoring of cross-border competition. Since then there has been a significant move towards the unbundling of German transmission assets, which has helped to promote cross-border trading and the efficient allocation of transmission capacity in central Europe (which will be discussed in the next section).
Two other sets of policies also affect the single electricity market:
Several incidents have highlighted the vulnerability of interconnected national electricity markets. In 2003, a series of blackouts across the globe drew attention to the need for increased coordination between system operators across different interconnected systems.
As a result, the European Commission now lists as one of its policies for energy security an increase in national electricity interconnection from its current average level of 8% of peak capacity to 15% by 2030 (having had a target of 10% by 2020).Footnote 8 To promote this policy the Commission has been actively promoting projects of common interest (PCIs) that increase transmission capacity between nations, in particular with respect to Baltic (Lithuania, Latvia, and Estonia) and Iberic (Spain—and by implication Portugal—and France) isolation.Footnote 9 In some areas, such as across the North Sea, there has been a significant increase in transmission capacity. Increased interconnection for security reasons promotes wholesale market integration and expansion.
The renewables and decarbonisation agenda are having a significant impact on the electricity industry. The 2001 renewable electricity directive (2001/77/EC) and the 2009 renewable energy directive (2009/28/EC) have together massively increased the requirement for electricity generation to come from renewable electricity sources—such as bio-energy, wind, and solar. These have been heavily subsidized by national governments and have significantly reduced the amount of generation that is being competitively added on the basis of predicted future wholesale market prices. Meanwhile the introduction of the EU Emissions Trading Scheme (EU ETS) in 2005—which included electricity within a traded carbon allowance system—has seen significant incentives at different times to favour gas-fired power generation over coal fired power generation (and sometimes vice versa).Footnote 10
The overall context for current energy and climate policy to 2020 is the 20–20–20 targets for 2020 that were agreed upon in 2007 and were enacted in 2009: a 20% reduction in CO2 (from 1990 levels); 20% of gross final energy consumption to come from renewable energyFootnote 11; and a 20% increase in energy efficiency (energy demand relative to levels projected around 2005). The European Union agreed in 2014 to set a 40–27–30 set of targets for 2030 (more precisely: − 40% greenhouse gas (GHG) emissions; > 27% renewable energy; and > 30% increase in energy efficiency), with primacy given to the 40% reduction in greenhouse gas emissions.Footnote 12 The EU wide targets for CO2e reduction and renewables share are disaggregated into national-level targets (some greater or less than the aggregate target), whereas all member states are expected to meet the energy efficiency target. These targets are themselves in the process of further tightening at the beginning of 2019.Footnote 13
As noted in Pollitt (2009), much of the initial implementation of these policies to meet energy and climate targets across the EU was ‘patchy’, with big differences between the enthusiastic reformers and lagging states.
A 4th Energy Package was tabled by the European Commission on 30th November 2016: ‘Clean Energy for All Europeans’. These measures are intended to lead to a new Electricity Directive and include three main goals: ‘Putting energy efficiency first; Achieving global leadership in Renewable energies; and Providing a fair deal for consumers.’Footnote 14
2 The Evolution of the Single Market in Electricity
The individual member states of the EU single market have very different national electricity resources: Germany, France, UK, Italy, and Spain have large national markets—significantly larger than other countries. France is dominated by nuclear; Germany has a significant share of coal; while the UK, Spain, and Italy have relatively more gas in their electricity mix. Norway has significant hydro capacity. Many other national markets are small but located close to much larger countries.Footnote 15 This immediately suggests that there must be significant room for trading to exploit relative price differentials from the different marginal generation technologies, non-coincident peaks in demand, and the sharing of reserve capacity.
In addition to the underlying differences in technology and demand characteristics, the move to a single market can increase the number of firms that effectively compete in wholesale and retail markets: either by simply increasing the size of the market (via coupling national electricity markets) or by encouraging cross-entry between former monopoly incumbents in neighbouring member states. The electricity directives encouraged this by removing barriers to entry into national electricity markets. This increased the number of effective competitors and reduced the effective market share of incumbent firms.
A significant part of this process was the harmonisation of the rules for new connection, third-party access to transmission and distribution systems, and retailing electricity to final consumers. The rise of independent energy regulators tasked with promoting domestic electricity market competition and with incentive regulation of electricity networks facilitated increasing competition in line with the intention of the directives. A deep process of national network harmonisation is currently underway, with oversight from ACER (and largely due for completion by 2019).Footnote 16
The process of opening national electricity markets has been a gradual one. Globally many lessons have been learned along the way (see Joskow 2008, for a review of the international experience). In the EU, as elsewhere, continuing vertical integration between transmission, distribution, and generation resulted in difficulties in new generators’ getting access to networks and hence the ability to supply their customers; this was a particular issue for new entrant Enron in France and Germany in the early days of reform.Footnote 17
Within electricity wholesale markets there were examples of tacit collusion between generators: e.g., within the UK, where the regulator had imposed a price cap on the two leading generators in 1996.Footnote 18 There were problems with access to congested transmission links, with incumbent generators’ hoarding their historic access rights in order to limit cross-border trading (something which explained the initially low or non-economic cross-border power flows). This inefficient utilisation of cross-border transmission links was a major driver behind the competition enquiry into the operation of the wholesale electricity and gas markets that were launched by the European Commission in 2005.
The energy sector inquiry published its final report in January 2007.Footnote 19 It found that there was: ‘too much market concentration in most national markets; a lack of liquidity, preventing successful new entry; too little integration between Member States’ markets; an absence of transparently available market information, leading to distrust in the pricing mechanisms; an inadequate current level of unbundling between network and supply interests which has negative repercussions on market functioning and investment incentives; customers being tied to suppliers through long-term downstream contracts; current balancing markets and small balancing zones which favour incumbents’.Footnote 20
The inquiry led to a number of recommendations including competition enforcement action where necessary: the unbundling of transmission network ownership from generation; increased powers for regulators; increased cross-border regulatory coordination; improved market transparency; removal of regulated retail tariffs; and competitive allocation of cross-border interconnector capacity.Footnote 21
The Commission pursued a case against the integrated German incumbent E.ON, which eventually resulted in a voluntary settlement that involved E.ON’s divesting some generation plant in Germany and putting its transmission business up for sale in 2008.Footnote 22
The Energy Inquiry was a significant driver behind the ‘Third Energy Package’, which gave rise to the 3rd Single Electricity Market directive in 2009 and the creation of the pan-European regulatory agency (ACER). Transparency has been increased by the 2011 REMIT Regulation (No. 1227/2011), which covers oversight of interconnectors and abuse of markets, and is overseen by ACER.Footnote 23
However national markets have been increasingly integrated. In 1976 only around 6% of the electricity that was produced in the ENTSO-E area was traded across national borders. In 2015 nearly 14% of the electricity that was produced in the ENTSO-E area was traded across national borders. This figure was itself significantly higher than in 1996.Footnote 24
In 2016 ACERFootnote 25 reported that across the European Union 86% of available commercial interconnector capacity was being allocated in the ‘right’ direction (from low- to high-price areas) direction via the coupled day-ahead markets. However, it also estimated that there were still unrealised gains of €203 m per year if market coupling extended to remaining borders. However, for a selection of borders that ACER looked at in more detail, only 50% of intraday capacity was being allocated in the ‘right’ direction, and 19% of balancing action flows were in the ‘right’ direction.
3 The European Commission’s Assessment of the Single Market in Electricity
1999 and 2003 and 2009 are the key dates of implementation of the various stages of the single electricity market so far. The Commission has undertaken various Benchmarking and State of the Market Reports.Footnote 26 These reports mostly focus on the implementation of various parts of the directives—such as unbundling rules. However, there is remarkably little serious analysis by the Commission (or indeed cited by the Commission) of the effects of the single-market-in-electricity project relative to what might have happened in the absence of its interventions.
European Commission (2014a) finds that wholesale electricity prices fell 35% between 2008 and 2012. However, households and industrial customers did not see lower bills because over this period network charges went up 18.5% and 30% for households and industry, respectively, while taxes and levies rose by 36% and 127% for households and industry, respectively. This highlights the important issue that over the period there has been a significant imposed cost of renewables and climate policy, which obscures any impact of the single market on underlying costs and margins. It also shows the importance of network charges for final bills—especially for households. These remain regulated by national regulators, and the determination of how generous these are remains outside the remit of the European Commission.
A further observation is that wholesale prices remain subject to commodity price fluctuations for both gas and coal. 2008–2012 was a period of falling commodity prices; by contrast 2004–2008 was a period of significantly increased commodity prices. Figure 1 shows the underlying rise in nominal commodity prices for coal and gas in Europe over the period we are considering, and the large fluctuations that have occurred.

Source: BP (2017)
Nominal index of coal and gas prices: 1999 = 100.
It is interesting to compare Europe with the US with respect to electricity prices. US prices are lower, but over the long run EU prices show no convergence with them. Figure 2 shows the evolution of industrial electricity prices in Europe versus the US. While prices converged a little in nominal terms to around 2001, the ratio of the EU/US industrial electricity prices in Euros has increased from around 2 in 1991 to 2.3 in 2016.

Source: US EIA and Eurostat data
Industrial electricity price per kW h (Exchange rates from ofx.com).
Figure 3 shows the evolution of residential electricity prices in Europe versus the US. While prices converged a little in nominal terms to around 2001, the ratio of the EU/US residential electricity prices in Euros has increased from around 1.7 in 1991 to 1.8 in 2016.

Source: US EIA and Eurostat data
Residential price per kW h (Exchange rates from ofx.com).
The impact of the single market on aggregate prices and welfare since 1999 is difficult to ascertain—as the above charts suggest. Commodity prices have risen significantly, and the overall price trend is upwards in both the US and Europe and for both industrial and residential consumers. Taxes and levies on electricity (which are included in the discussion above) are also up remarkably in the EU (but also in the US).Footnote 27 According to Eurostat figures in 1991, 18% of the industrial price of electricity was taxes and levies; by 2016 this had risen to 43%. For households, the comparable figures were 15% in 1991 and 36% in 2016. Thus, pre-tax and pre-levies electricity prices for industry and households have risen only 6% and 20% (in nominal terms) in 25 years. By contrast the Euro area CPI rose by 42% between 1996 and 2016.Footnote 28 This suggests significant decreases in the real pre-tax, pre-levies price of electricity in Europe over the period.
Copenhagen Economics (2005) provided an early assessment for the Commission of the possible effects of market opening in electricity with the use of a general equilibrium model that employs data from 1990–2003. They do this in stages: measuring market opening at the national level; then econometrically estimating the effects of market opening on individual countries electricity sector performance; and finally estimating the overall impact on the economy with the use of their general equilibrium model of the European economy. They did find significant impacts from market opening on national productivity and estimated that the long-run impact in electricity could be as great as 7–8% price reductions.
More recently, working for the Commission, the impacts of the single market have been analysed by Booz & Company (2013).Footnote 29 They identify the period before 2004 as one of mainly national-based reforms. From 2004, there was an increasing trend towards coupling national markets at the wholesale level (the ‘target model’). Market coupling appears to have significant and dramatic benefits. As an example, they cite earlier evidence from Moss (2009) who examines the coupling of the power flows between the Netherlands and France before and after the coupling of the APX and PowerNext power exchanges in November 2006. In 2005/2006 wholesale prices were more than €10/MWh different 39% of the time; in 2007/2008 this had fallen to 14% of the time. By contrast, prices were less than €1/MWh different 10% of the time in 2005/2006, but 72% of the time in 2007/2008.
Booz & Company (2013)Footnote 30 suggest that the total value of electricity trading is roughly €16bn p.a. (308 TWh @ €50/MWh) and that the value of full market coupling is around one-quarter of this (based on the degree of price convergence seen at borders) or €4bn p.a. They find that if market coupling covers 58–66% of the market the current benefits are €2.5bn p.a. A further €1.5bn p.a. of benefits is therefore possible if all interconnectors within the EU are coupled.
But the current market coupling covers only short-term day-ahead trading. Extending market coupling of interconnectors to cover shorter-term intra-day trading of electricity, balancing services, and reserve capacity and financial transmission rights would produce further gains beyond the day-ahead market. Booz & Company (2013) suggest large additional gains from these measures under different scenarios of renewable penetration. However, these are yet to be realized.
Overall the impression one gets from the Commission’s own evidence is that of limited gains so far in terms of proven price and productivity effects, coupled with an emphasis on the potential for much larger future gains.
In the next section, we look at some of the wider academic evidence on the impact of the single market in electricity project.
4 Assessing the Impact of the Single Market in Electricity
The measurement of the overall impact of the single electricity market, on prices, costs, and wider GDP is difficult—as the attempts by the Commission to study this illustrate.
We can start by thinking about how the single market is supposed to have an effect, through bringing about pro-competitive structural change and improving the quality of sector regulation, before looking at the measured economic impact.
4.1 Pro-competitive Structural Change and the Quality of Sector Regulation
The OECD Product Market Regulation (PMR) index provides a relative measure of the degree of deregulation of a nation’s electricity sector.Footnote 31 The index has a range of 0–6, where 0 is most liberalised and 6 would be an unreformed integrated government monopoly. This index puts one-quarter weights each on: (a) entry regulation; (b) the percentage of public ownership; (c) the degree of vertical separation; and (d) the market share of the largest company in the sector.
For entry (a), a combination of free-entry regulation, regulated third-party access (TPA), a liberalised wholesale power market, and no minimum threshold on the size at which a customer can chose its supplier would give the lowest possible liberalisation score of 0. Under vertical integration (c), ownership separation gives the lowest possible liberalisation score of 0 (legal separation scores 3). Under market structure (d), a combined generation/import and supply share of less than 50% for the largest firm gives a score of zero. If 100% of the shares in the firms across generation/import, transmission, distribution, and supply were government-owned (b), this would score 6.
The implementation of the single electricity market directives should result in a 0 score for entry regulation (a) and for market share of largest firm in the sector (d) and a maximum of 3 for vertical integration (c) and less than 6 (due to some entry) for public ownership (b). This should imply that the maximum EU member state score under the PMR is 2.3. Indeed between 2008 and 2013 the PMR score for EU electricity did improve from 2.4 to 2.1, relative to 2.6 to 2.4 for the OECD.Footnote 32
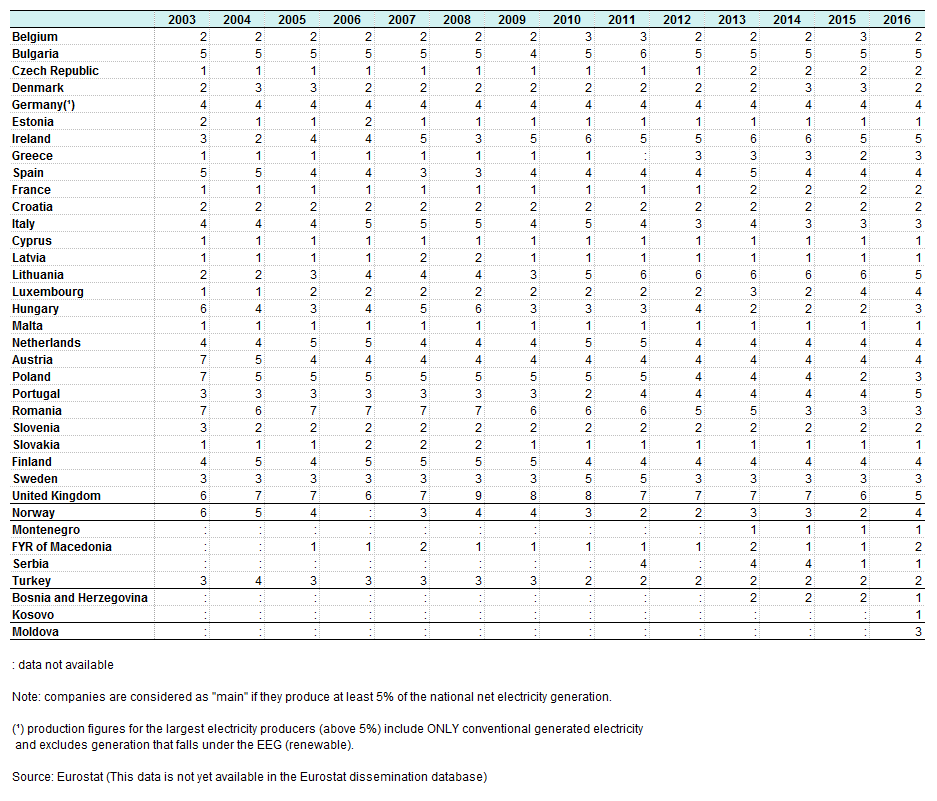
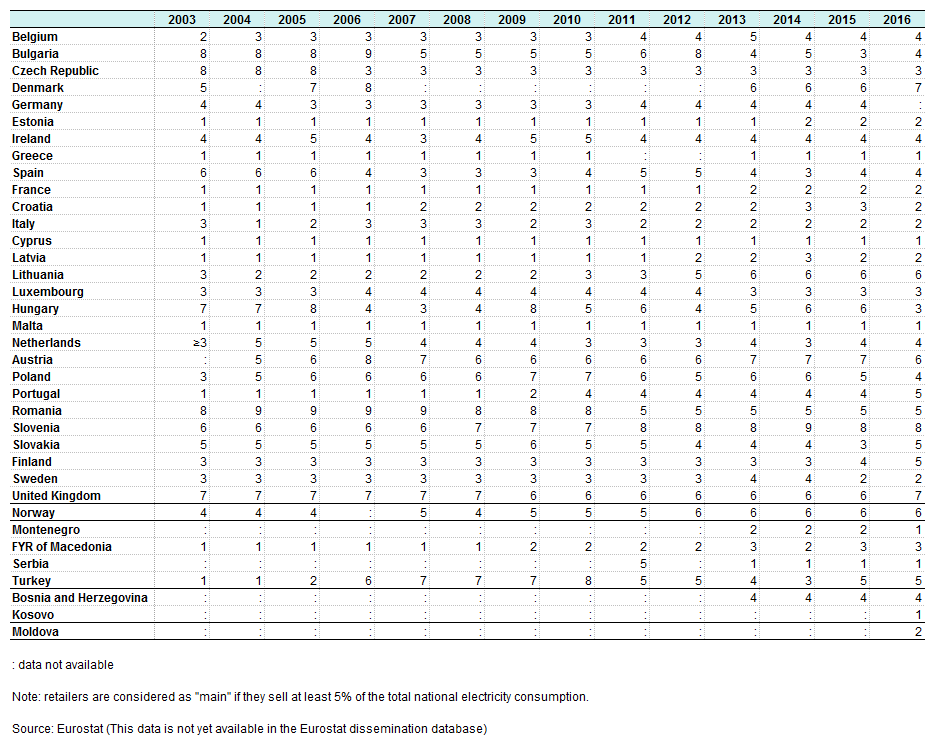
Since 1999, there has been a significant increase in generation competition within MSs: The Czech Republic, France, Greece, and Luxembourg have all increased their number of main generators (a main generator is company that produces at least 5% of national production) from 1 in 2003 to an average of 2.75. Effective competition has also significantly increased in Germany due to increased renewables.Footnote 33 Estonia, France, Croatia, Latvia, and Portugal have increased their number of main (with 5% of national consumption) retailers from 1 in 2003 to an average of 2.6.Footnote 34
A developing theme of the single market in electricity project has been the need to improve the quality of both national and EU level regulation of the sector. This is discussed in Green et al. (2009). They point out the importance of improving the form, process, and outcomes of energy-sector regulation.
The form of regulation can be measured on the basis of the strength of the regulator in terms its separation from government and its ability to regulate the industry. Jamasb and Pollitt (2005) scored ex ante regulation—no ministerial involvement in decision making, network access conditions set by the regulator (rather than elsewhere), dispute settlement by the regulator, and strong information acquisition powers—at 5 out 5, for regulatory strength. In terms of the scope of the regulator’s functions, Larsen et al. (2005) found that 15 European regulators had from 1 to 7 different legislative objectives.Footnote 35 Overall, Pollitt (2009) notes improvements in the form of regulation at the national level since the beginning of the single market project.
The process of regulation focuses on: the degree of transparency that is exhibited by the regulator; the amount of stakeholder engagement; the procedural efficiency in coming to regulatory decisions; and the quality of the underlying techniques that are utilised in carrying out their functions. Regulators are thought to have better processes when they: are more transparent in their decision making; deliver their decisions in a timely way; undertake good levels of stakeholder engagement; and use best-practice techniques of regulation.Footnote 36 Transparency has increased significantly with respect to regulation across the single market area.Footnote 37
The outcomes of regulation are more difficult to measure. This is because regulators do operate under different rules and objectives. Process in a democracy matters for its own sake: Stakeholders do like and need to be consulted. Regulatory decisions can only be evaluated ex post, and it is not clear how to do this, given that there is very unlikely to be an unbiased, statistically identifiable measure of impact. Nillesen and Pollitt (2007) discuss a case study of the miscalculation of price controls in the Netherlands and how much this cost Dutch customers. It is possible to try to benchmark regulator costs across countries, but this would need to be corrected for the number of regulatory functions and economies of scale in regulation (see Domah and Pollitt 2001).
The single electricity market project has undoubtedly spread good practice in the form, process, and outcomes of regulation—especially initially, as noted by Jamasb and Pollitt (2005). The directives have promoted independent sector regulation of electricity—notably forcing Germany to have an electricity regulator, when it initially did not. CEER (the industry association of regulators) and ACER have been the fora for the spread of good regulatory practice, and many European countries have much better regulators then they would otherwise have had.
4.2 The Measured Economic Impact of the Single Electricity Market
We examined this question in earlier papers (Jamasb and Pollitt 2005; Pollitt 2009). In what follows we review more recent work. We examine economic impact under a number of headings: prices, costs, return on capital, and fuel-related income distribution; quality of service; impact on the environment (via renewables and decarbonisation); and the impact on innovation. The first three can be summarized as: affordability, security of supply and the environment (the so called ‘energy trilemma’). The fourth is about dynamic efficiency. We conclude this section by revisiting overall assessments.
4.3 Prices, Costs, Rate of Return on Capital, and Fuel-Related Income Distribution
Has the single market reduced average prices (relative to business as usual) and price dispersion as we would expect from theory—especially in the wholesale power market?
Measuring the average price effect is hard because of the confounding impact of fossil fuel price fluctuations, renewables support policy, and network expenditure. There is some limited evidence of liberalization’s reducing household electricity prices, based on data for 23 EU countries from 2000 to 2014 (da Silva and Cerqueira 2017). This is in line with earlier studies that suggest limited price effects due to the introduction of a wholesale power market and the unbundling of transmission and generation.
There is more recent support for price convergence. The EU does measure the relative standard deviation of retail electricity prices in the EU member states. Industrial prices do show a degree of convergence over the period 2014–2018 (see European Commission 2017b, 2018, p. 29). Market coupling does appear to be associated with strong price correlations. Ouraichi and Spataru (2015) find high price correlations between national markets within four regional markets (CWE, CEE, MIBEL, and NordPool)Footnote 38 and high price correlations between countries in each of two different regional markets. They conclude that the flow-based market coupling policy of the EU has had promising—if incomplete—results; for instance, CWE (Belgium, France, Germany, Luxembourg, and the Netherlands) countries exhibit only 74% correlation within the region. Using a different measure (fractional cointegration analysis) of price convergence, de Menezes and Houllier (2016) also find evidence of price convergence between European electricity markets.
We would expect that prices and costs would move in parallel: decreases in prices likely imply decreases in costs. We can observe prices; but costs are more difficult to observe. They can be observed only indirectly: by examining returns on equity as well as prices. If returns stay constant, costs and prices move together; if returns fall but prices stay the same, then costs must be rising—though the cost of capital may be falling—and vice versa. We would expect liberalization to reduce overall returns to capital in the electricity sector; but it is possible that the profit-maximizing firms are good at price discriminating across their customer base, or at bargaining with their suppliers.
Jamasb and Pollitt (2005) produced some early evidence of falling returns in the electricity sector following liberalization, as well as falling costs. More recent studies that examine returns find mixed evidence of any change in underlying profitability.
Mergers in the electricity sector have created more value for European acquirers over the period 1998–2013 (Kishimoto et al. 2017). This would seem to indicate that the benefits of the single market are being brought about by the takeover of inefficient domestic firms by more efficient firms, and is consistent with the ability of mergers to create larger firms with greater economies of scale and scope. OECD (2016, chapter 5) shows a declining trend in clean energy returns on equity (relative to the cost of equity) in Europe over the period 2004–2015; this might be indicative of tougher conditions for renewables procurement—though this is not necessarily directly related to liberalization.
Tulloch et al. (2018) find declining returns for European electricity and gas utilities over the period 1996–2013, with a larger effect from the 2003 directives. They suggest that their results are consistent with evidence that the markets are becoming more competitive, albeit with some offsetting increase in risk. CEER (2017) find continuing wide variation in the target rates of return (WACC) used in electricity distribution and transmission, indicating a lack of standardization of network investment risks across Europe.
Since the beginning of the reform period fuel-related income distribution (‘fuel poverty’) has emerged as a big issue in some EU countries: notably, the UK. Conventionally defined as involving those spending 10% or more of their household expenditure on electricity and gas, this issue has become a focus of government policy on energy pricing. There is little evidence that this has systematically increased since 1996; but there is no doubt that energy remains a significant expenditure item for many households across the EU.Footnote 39
4.4 Quality of Service
The willingness to pay for continuity of service—avoiding outages—in electricity is very high: typically, of the order of 50–100 times more than the value of the retailed price of electricity.Footnote 40 This suggests that small improvements in the quality of service can be very valuable. For instance, the avoidance of an outage of just half an hour in customer minutes could be worth as much as 0.5% of the total value of electricity sold in the year.Footnote 41 Most interruptions to customer supply are local, due to problems at local substations. Regulators are also concerned about transmission system availability as this may be an indication of more serious failings in the transmission grid and the risk of wide-area blackouts.
CEER has been monitoring the quality of service at the EU level (see CEER 2018). There does seem to be a general decrease in customer minutes that were lost over the period 2002–2016, based on data that were reported to them. Measuring this is not straightforward, as it depends on how interruptions are monitored and reported—with different national definitions of what constitutes an interruption and different qualities of national reporting systems—and on exogenous drivers of interruption, such as extreme weather events.
Transmission system reliability also seems to have improved for several countries. One measure is the average interruption time (AIT). However, this measure started from very low levels: Spain improved from 2.006 min in 2002 to 0.14 min in 2016 (CEER 2016, p. 46; 2018 p. 36).
One quality issue is whether increased power flows between countries and system operator areas increases the risk of wider area blackouts. This is because one system operator has full visibility on the scheduling of generators and loads only within its control area, while interconnectors in an alternating current (AC) power system are subject to unscheduled loop flows as power that is transacted between areas A and B, may actually travel via a third area (from A to C to B, without area C having sight of the transaction between A and B).Footnote 42 This situation is especially difficult to manage if there is an unplanned transmission line outage that affects flows through C.
This problem is examined in Bialek (2004), who reviews the 2003 blackouts that involved six wide area blackouts in 6 weeks that affected 112 million people: five of the blackouts were in Europe; the sixth covered a large part of the Northeast of the US, including New York City. These included a blackout involving large parts of Denmark/Sweden and the whole of Italy—which was the largest blackout in Europe since 1945.
Bialek reviews the New York, Denmark/Sweden, and Italy incidents and concludes that while increased cross-border trading did not directly cause the blackouts it did necessitate an upgrading of inter-system operator communication: In both the Italy case and the similar case in New York, outdated communications infrastructure contributed to the slow communication of evolving problems in one system, which ultimately had serious consequences for interconnected systems. There have been other internationally power outage incidents, such as on the 4th November 2006 incident when a power line in Northern Germany had to be switched off to let a ship pass underneath it and caused a blackout in several European countries (see UCTE 2007).
Europe has made significant efforts to improve inter-transmission system operator (TSO) coordination to reduce these sorts of problems. The association of European TSOs (ENTSO-E) has overseen the establishment of regional security coordinators (RSCs), which are made up of groups of national TSOs (see ENTSO-E 2017a, b). These RSCs undertake regional operational security coordination, regional outage coordination, coordinated capacity calculation, and capacity adequacy assessments and provide dynamic asset information. The largest of these RSCs is CORESO, which began in 2008 and covers a population of 279 m [which is a private joint venture of REE (Spain), Elia (Belgium), RTE (France), National Grid (UK), Terna (Italy), 50 Hertz (Germany), and REN (Portugal)]. These RSCs are designed to reduce the risks that led to the international incidents in 2003 and 2006.
4.5 Environmental Impact
The European electricity system has experienced a profound transition with respect to its environmental impact. Between 2004 and 2016, the share of electricity generation from renewable sources has doubled from 14.3 to 29.6%. Hydro-electricity has barely changed in absolute quantity over this period. The increase is almost entirely due to an increase in wind, solar, biofuels, and other renewables; total generation has fallen by around 1%.Footnote 43
The emissions intensity and energy efficiency of EU electricity has also improved significantly.Footnote 44 The carbon emissions intensity was 431 g of CO2/kW h in 1990; 371 g/kW h in 1999; and 276 g/kW h in 2014—a decline of 36% between 1990 and 2014. The increased share of renewables and the increased use of more efficient gas-fired power generation and reduced use of coal in electricity generation has contributed to average power plant efficiency’s increasing from 36% in 1990 to 44% in 2014.Footnote 45
Jamasb and Pollitt (2005) noted impressive improvements in emissions of sulphur and nitrous oxides from the power sector in the period from 1990 up to 2003. Between 2004 and 2015, emissions have fallen by 77% for sulphur dioxide; 49% for nitrous oxides; and 81% for particulates.Footnote 46
The econometric evidence—presented in Asane-Otoo (2016)—suggests that for individual countries CO2, NOX, and SO2 intensity all decline with more liberalization (as measured by PMR—Product Market Regulation—indicators for private ownership, vertical integration and market entry), though not always significantly, over the period 1990–2012. Other econometric evidence from Vona and Nicolli (2014) suggests that countries with greater amounts of liberalization in their electricity sector have higher penetration of wind and solar power. Two channels for these effects might be: First, greater reliance on market forces to guide generation investment resulted in faster coal to gas substitution in the EU (and across the non-Europe OECD); and, second, that the initial efficiency gains from liberalization (discussed in Pollitt 2009) were partly spent on supporting renewables.
What is certainly true is that a combination of market liberalization (which initially favoured gas over coal), carbon pricing (which also favours gas over coal), the Large Combustion Plant DirectiveFootnote 47 (which forced higher emissions standards on existing and new coal fired power plants and raised their costs), and renewables support policies (which have led to renewables’ increasingly reducing wholesale electricity prices for both coal- and gas-fired power plants) have largely ended the building of new coal-fired power plants in the EU (see Caldecott et al. 2017).
4.6 Impact on Innovation
It is possible that over such a long period (1999–2018) the EU single market in electricity may have produced some positive short-run effects that mask negative long-run effects: Static gains may be offset by dynamic losses. One channel for this might be the impact of liberalization on the quantity of investment in research and development (R&D), or indeed on the productivity of R&D.
This is very difficult to measure because the rate of technological progress in electricity is slow and significantly affected by environmental regulation (and other types of regulation, such as nuclear safety).Footnote 48 However Jamasb and Pollitt (2008) discuss how one would expect liberalization to reduce R&D expenditure by electricity companies in theory: e.g., due to reductions in size and incentives to invest in R&D; they subsequently showed how this effect has played out in the UK (Jamasb and Pollitt 2011, 2015) and evidence of similar effects across the world—notably in the US.
One significant issue is the extent to which declines in electricity company R&D actually reduce aggregate energy R&D and the productivity of energy R&D expenditure. R&D may shift to the supply chain and away from former monopoly incumbent utilities. Marino et al. (2017) find that the deregulation of electricity initially increases but then reduces electricity patents across 31 OECD countries over the period 1985 to 2010. They conclude that this is evidence for an inverted-U relationship between the strength of liberalization and patenting.
The general equilibrium effect of the release of R&D resources to other sectors and the specific impact of higher expenditure on renewables linked to reform makes it very difficult to say what the aggregate dynamic effect of European electricity liberalization might be—even if aggregate energy R&D has declined.
4.7 Overall Assessments of the Impact of the Single Electricity Market
It is striking how little large-scale evidence has been produced for the overall impacts of the single market in electricity. It is even more striking that the most convincing evidence is simulated. Simulation studies can show the benefits of market coupling and changing the pricing behavior of incumbent players. These studies find that reducing market power in pricing can have substantial benefits: e.g., Hobbs et al. (2005) who examine Netherlands-Belgium market coupling. A move from strategic interaction to perfect competition can be shown to yield big impacts, reducing the profits of incumbents significantly—Lise et al. (2006) show the profits of EdF and Tractabel falling by a third—if there is enough interconnection between countries. However, these theoretical gains from more perfect competition may not be realizable in a second-best word.
As to how actual overall reform effects can be assessed: There are a number of ways to assess the overall impact of a liberalization package, such as that represented by the single electricity market project (as noted in Pollitt 2012). These include: performance metric regressions on panel data (e.g. Steiner 2001); simple statistical tests of before and after performance using t tests (e.g., following D’Souza and Megginson 1999); social cost–benefit analyses of reform (following Jones et al. 1990) with reform as the public investment project; and macro studies of reform that attempt to find effects with the use of general equilibrium models of the economy (e.g. Chisari et al. 1999 and Copenhagen Economics 2005).
Remarkably, not all of these methods have been applied clearly to the EU single market project, as opposed to electricity reform in the OECD more generally. Fiorio et al. (2007) attempts panel data regression on reform variables to show evidence of modest productivity improvements—but ambiguous price impacts—for 15 EU countries.
Reform evidence—both for samples of countries and for specific case studies—seems to support the view (in Pollitt 2012) that market liberalisation reduces costs somewhat but may not affect prices. This positive view on productivity has recently been disputed by Polemis and Stengos (2017), who suggest that for their sample of OECD countries over the period 1975–2013 electricity liberalisation does not increase their measures of productivity—which include generation per capita and labour productivity—in already liberalised countries. However a standard problem with panel data analysis is that reform is a package and identification of its effects is a problem, given that multiple significant policy impacts happen simultaneously: for instance, cost-increasing environmental policy and cost-reducing market reform.
What is more clear is that public dissatisfaction with liberalised energy markets in Europe remains strong. Fiorio and Florio (2011) showed that in Europe private ownership of electricity assets was correlated with increased public dissatisfaction with the industry. This dissatisfaction explains the remaining significant public ownership in European electricity—in spite of the single electricity market—and the fact that in at least half of EU countries residential price controls still exist for some household customers: something that ACER continues to condemn as limiting the impact of the single market project.Footnote 49
5 Conclusions
If one reflects on the development of the EU single market in electricity, it is difficult not to be impressed with it in terms of the structural changes since 1996. National markets that were once dominated by a single incumbent generator and a single incumbent retailer have been opened to competition. Independent regulation has been significantly increased: both at the national and at the level of the EU itself. There has been significant enforcement action by the European Commission’s competition authority (DG Competition) to promote further reform. Legislation has evolved through successor directives and a new directive is under discussion (as of late 2018).
In parallel there has been the development of power exchanges and market coupling, as well as the emergence of non-discriminatory access to the transmission system with robust legal and ownership unbundling of transmission and increased coordination between national system operators. The ownership of the industry has been reorganized, with large numbers of pan-European mergers and acquisitions and the entry of gas incumbents into electricity. Cross-border trading of electricity has increased. There has been a high degree of ‘regulatory convergence’ in electricity among member states—at a higher level than might have been imagined in the absence of the single market. At the same time the environmental agenda has been promoted with the introduction of a carbon market in 2005 and massive financial support for renewables—which have significantly affected prices—which is bringing about a genuine ‘energy transition’.
The electricity industry has been transformed—especially for countries with less favourable initial attitudes to competition in electricity.
However, while the level of structural and institutional change is impressive, the quantification of the costs and benefits of the single market is extremely hard, and the evidence that we do have suggests that the overall gains in terms of price, cost, and quality of service impacts are modest—especially if we consider the 25-year time frame.
Our review indicates that the difficulty of doing econometrically robust analysis of actual data on the single electricity market is high. This is not helped by the multiple reform elements—horizontal and vertical unbundling, wholesale market developments, and privatization—that have been happening at more-or-less the same time. And one should add the cost-increasing effect of renewables support and the underlying fluctuations in wholesale gas, coal, and carbon prices.
Furthermore, the EU itself is not the same: it had 15 members in 1996; but this had expanded to 28 by 2013. Any single-market study suffers from a lack of compatible data, combined with multiple confounding factors and highly partial analysis of a narrow range of impacts.Footnote 50 Putting different econometric studies together to gain an overall picture involves comparing studies that were conducted over different numbers of countries and different time periods. Some of the best studies on single market-type impacts don’t look at just the EU, but often the wider OECD.
An obvious econometric approachFootnote 51 to studying reform effects is to adopt a difference-in-difference approach to measuring the impact of various policy change variables on the outcome variables—electricity prices, electricity costs, innovation, etc.—that the policy is trying to effect. In an economic reform context such as the single market, this is premised on identifying a group of treated countries and a control group of untreated countries. Some of the studies that we have examined have attempted to do this (e.g., Polemis and Stengos 2017).
Our review of the literature suggests some avenues for future research of this type: First, more attention might be given to better identification of the appropriate control group. Individual countries within the single market area might be matched with ‘similar’ countries (real or synthetically created) that reformed less. More broadly, there are few econometric studies that systematically compare European single-market countries with non-European countries—most obviously unreformed US states.
Second, econometric studies need to consider jointly the market impact and the environmental impact. Multiple outcome variable (or comprehensive outcome variable) studies would seem to be important given the significance of the decarbonisation of the European electricity system over the timeframe of the single electricity market.
Third, explicit modeling of the relationships between market reform and environmental commitment to higher renewables share and deeper decarbonisation is important for addressing the obvious endogeneity issue, where the most pro-reform countries are likely to have incurred the highest environmental costs.
However, given the quality and size of the data that researchers have to work with—a maximum of 28 diverse countries over 25 years—getting robust (and believable) results from improved econometrics remains challenging. Indeed, this is likely to be the reason why so few exercises of this type have been undertaken.
What one can say on the basis of the available evidence is that the ‘proven’ overall impacts on welfare would seem to be small. The evidence indicates some small productivity improvement, some wholesale price convergence, and limited (if any) retail price reductions. The studies on which the European Commission relies—notably Copenhagen Economics (2005), and Booz & Company (2013)—significantly rely on simulation of future impacts and give limited attention to actual data. Given that the measured overall impacts seem to be small, this suggests the need for more careful attention to measuring impacts than most current studies are capable of. Indeed, in line with Pollitt (2012), it suggests little substitute for detailed cost–benefit analysis of individual European country case studies of reform.
In fairness to the European Commission as architects of the single electricity market, it is important to say that the Commission does continually emphasize the fact that the single electricity market remains a work in progress.Footnote 52 The Commission—together with its sector regulatory organisations (ACER and the CEER)—stress that more needs to be done. The fourth energy package is a commitment to doing more. Indeed, one of the genuinely good reasons that the Commission may not have emphasized studies of past gains from the process is precisely to keep the focus on what needs to be done in the future.
Another—more ambiguous—reason for the Commission’s reluctance, may be the desire not to draw attention to cost of European climate policy, which has been significantly borne by Europe’s electricity consumers. Careful analysis is likely to draw attention to the apparent fact that much—if not all—of the gain from the single electricity market has been spent on climate policy.
However, this is not to say that the documentation of single market gains (and losses) is unimportant. Simulation studies can always show potential gains from extending markets towards a first-best world; but we all live in the here-and-now: in the second-best.
Notes
See European Commission (1988).
In 2016, 54% of global exports of electricity occurred from OECD Europe, and 10% of global exports were from Canada to the US [see IEA (2018, p. II.5)].
Switzerland is physically interconnected with the single market, but it is not a full member of the single market in electricity.
See Jamasb and Pollitt (2005) for a longer discussion.
Except for certain MSs that were granted limited time extensions to comply with the directive.
See www.acer.europa.eu.
See European Commission (2014b, p. 10).
See European Commission (2014b, p. 24).
See Koenig (2011).
European Commission (2006) https://eur-lex.europa.eu/legal-content/EN/TXT/PDF/?uri=CELEX:52006DC0545&from=EN and Directive 2012/27/EU http://eur-lex.europa.eu/LexUriServ/LexUriServ.do?uri=OJ:L:2012:315:0001:0056:en:PDF.
For a review of progress, see European Commission (2017a).
See https://ec.europa.eu/energy/en/topics/energy-strategy-and-energy-union/clean-energy-all-europeans. Accessed 15 January 2019. This notes agreement on more ambitious 2030 targets: to increase the renewables share to 32% and the energy efficiency target to 32.5%, with the implication that GHG emissions would be reduced by 45%.
See https://ec.europa.eu/energy/en/news/commission-proposes-new-rules-consumer-centred-clean-energy-transition. Accessed 24 March 2018.
See IEA (2018).
See Dale (2016).
See Bergman et al. (1999).
See Newbery (2005).
See European Commission (2007).
See European Commission website: http://ec.europa.eu/competition/sectors/energy/2005_inquiry/index_en.html. Accessed 16 March 2018.
See European Commission (2007, pp. 9–15).
See Chauve et al. (2009).
See ACER (2016) for example.
ACER/CEER (2017).
Disentangling the impact of taxes and levies so as to compare prices in the US and EU before taxes and levies does not appear to be possible on the basis of the official statistics.
Source: tradingeconomics.com. The Euro area inflation rate is not available before 1996.
This study was subsequently published as Newbery et al. (2016).
See https://ec.europa.eu/energy/sites/ener/files/documents/20130902_energy_integration_benefits.pdf. Accessed 24 March 2018.
Koske et al. (2015, p. 63).
Koske et al. (2015).
See Eurostat data on number of main generating companies at http://ec.europa.eu/eurostat/statistics-explained/images/7/7a/Number_of_main_electricity_generating_companies-T2.png. Accessed 20 September 2018.
http://ec.europa.eu/eurostat/statistics-explained/images/5/57/Number_of_main_electricity_retailers-T6.png. Accessed 20 September 2018.
Such as ‘promotion of competition’ and ‘socially responsible prices’.
See, for example, Brophy Haney, and Pollitt (2013) who compare regulators on the quality of the benchmarking techniques that they use to measure the efficiency of their regulated transmission companies.
Green et al. (2009)—as a crude measure—looked at whether MS regulators had a website in English. Of the four countries that did not in 2009, only one (Luxembourg) does not in 2018 (20 September 2018).
CWE = Central West Europe; CEE = Central and Eastern Europe; MIBEL = Iberia; and NordPool = Nordic countries.
See Thomson et al. (2016) for a discussion.
See Arnold et al. (2007).
0.5 * 100/8760 = 0.5%.
Bonnard (2003) reports the unplanned flows through Belgium on a day in 1999 when unidentified flows (to the Belgium system operator) increased from 600 to 2000 MW within 4 h and were two-thirds of all flows. This is because, for instance, some of power that is transacted between France and Germany will flow through Belgium. See ENTSO-E (2017a, p. 20) for a map of the European transmission system.
See http://ec.europa.eu/eurostat/web/energy/data/shares. Accessed 20 September 2018.
See https://www.eea.europa.eu/data-and-maps/indicators/overview-of-the-electricity-production-2/assessment. Accessed 20 September 2018.
This is across all power plants where, for example, wind would be 100% efficient, nuclear around 33%.
See https://www.eea.europa.eu/data-and-maps/indicators/emissions-of-air-pollutants-from/assessment-1. Accessed 20 September 2018.
2001/80/EC.
This is a phenomenon that was noted by Jorgenson and Wilcoxen (1990) for a range of industries in the US (including electricity) over the period 1973–1985.
See, for example, ACER/CEER (2017, p. 8), which discusses the impact of supplier-of-last-resort mechanisms that limit switching behaviour in the residential energy market.
One referee of this paper asked me to think about including some tables and figures. However even the simplest comparative figure—such as electricity prices in the US and the EU over the last 25 years— is not actually available on an internally consistent basis, because the data on the EU-28 start only from 2004.
I am very grateful to a referee for highlighting the points in this paragraph.
See for example European Commission (2017, pp. 1–2).
References
ACER. (2016). ACER’s annual report on its activities under regulation (EU) no 1227/2011 on wholesale energy market integrity and transparency (REMIT) in 2015. Ljubljana: ACER.
ACER, CEER. (2017). Annual report on the results of monitoring the internal electricity and gas markets in 2016 summary October 2017. Ljubljana: ACER/CEER.
Arnold, S., Hunt, A., & Markandya, A. (2007). Section 1—National and EU level estimates of energy supply externalities, Project No 518294 SES6, deliverable D.5.1.
Asane-Otoo, E. (2016). Competition policies and environmental quality: Empirical analysis of the electricity sector in OECD countries. Energy Policy, 95, 212–223.
Bergman, L., Pollitt, M., et al. (1999). Monitoring European deregulation: A European market for electricity? (Vol. 2). London: Centre for Economic Policy Research.
Bialek, J. (2004). Recent blackouts in US and continental Europe: Is liberalisation to blame? Working Paper CMI EP 34 Department of Applied Economics, University of Cambridge.
Bonnard, P. (2003). Power system collapse: European utility experience. In IEEE Trans. Distr. Conf. Cited in Bialek (2004).
Booz & Company. (2013). Benefits of an integrated European energy market. Amsterdam: Booz & Company.
BP. (2017). Statistical review of world energy 2017. London: BP.
Brophy Haney, A., & Pollitt, M. G. (2013). International benchmarking of electricity transmission by regulators: a contrast between theory and practice? Energy Policy, 62, 267–281.
Caldecott, B., Tulloch, D. J., Bouveret, G., Pfeiffer, A., Kruitwagen, L., McDaniels, J., et al. (2017). The fate of European coal-fired power stations planned in the mid-2000s: Insights for policymakers, companies, and investors considering new coal. Working paper. Smith School of Enterprise and the Environment, Oxford.
CEER. (2016). 6th CEER benchmarking report on the quality of electricity and gas supply 2016. Brussels: CEER.
CEER. (2017). CEER report on investment conditions in European countries Ref:C17-IRB-30-03. Brussels: CEER.
CEER. (2018). CEER benchmarking report 6.1 on the continuity of electricity and gas supply data update 2015/16. Brussels: CEER.
Chauve, P., Godfried, M., Kovács, K., Langus, G., Nagy, K., & Siebert, S. (2009). The E.ON electricity cases: An antitrust decision with structural remedies. Competition Policy Newsletter, 1, 51–54.
Chisari, O., Estache, A., & Romero, C. (1999). Winners and losers from the privatization and regulation of utilities: Lessons from a general equilibrium model of Argentina. World Bank Economic Review, 13(2), 357–378.
Copenhagen Economics. (2005). Market opening in network industries: Part I: Final report. Brussels: European Commission.
da Silva, P. P., & Cerqueira, P. A. (2017). Assessing the determinants of household electricity prices in the EU: a system-GMM panel data approach. Renewable and Sustainable Energy Reviews, 73, 1131–1137.
Dale, L. (2016). The IEM integration process. In Presentation to EPRG workshop on ‘Implications of brexit for UK and EU energy and climate policy’. 6 Sept 2016.
de Menezes, L. M., & Houllier, M. A. (2016). Reassessing the integration of European electricity markets: A fractional cointegration analysis. Energy Economics, 53, 132–150.
Domah, P., & Pollitt, M. G. (2001). Restructuring and privatisation of electricity distribution and supply businesses in England and Wales: A social cost-benefit analysis. Fiscal Studies, 22(1):107–146.
D’Souza, J., & Megginson, W. L. (1999). The financial and operating performance of privatized firms during the 1990s. Journal of Finance, 54(4), 1397–1438.
ENTSO-E. (2012). Statistical yearbook 2011. Brussels: ENTSO-E.
ENTSO-E. (2017a). Yearly statistics and adequacy retrospect 2015. Brussels: ENTSO-E.
ENTSO-E. (2017b). Annual report 2016. Brussels: ENTSO-E.
European Commission. (1988). Energy in Europe: The internal energy market. Brussels: European Commission.
European Commission. (2006). Action plan for energy efficiency: Realising the potential, 19.19.06. Brussels: European Commission.
European Commission. (2007). Communication from the Commission: Inquiry pursuant to Article 17 of Regulation (EC) No 1/2003 into the European gas and electricity sectors (Final Report). Brussels, 10.1.2007 COM(2006) 851 final.
European Commission. (2011). Public consultation on the governance framework for the European day-ahead market coupling. 28 November 2011 D(2011) 1176339, European Commission, Brussels.
European Commission. (2014a). Progress towards completing the Internal Energy Market. 13.10.2014 COM (2014) 634 Final, European Commission, Brussels.
European Commission. (2014b). European Energy Security Strategy. 28.05.14, European Commission, Brussels.
European Commission (2017a). Third report on the state of the energy union. 23 Nov 2017 COM(2017) 688 final.
European Commission. (2017b). Quarterly report on european electricity markets Q3 2017. Brussels: European Commission.
European Commission. (2018). Quarterly report on european electricity markets Q1 2018. Brussels: European Commission.
Fiorio, C. V., & Florio, M. (2011). Would you say that the price you pay for electricity is fair? Consumers’ satisfaction and utility reforms in the EU15. Energy Economics, 33(2), 178–187.
Fiorio, C.V., Florio, M., & Doronzo, R. (2007). The electricity industry reform paradigm in the European Union: Testing the impact on consumers. In Paper delivered at consumers and utility reforms in the European union conference, Milan, 8–9 Jun 2007.
Green, R., Lorenzoni, A., Pérez, Y., & Pollitt, M. (2009). ‘Policy assessment and good practices’. In Glachant, J.-M. and L´vêque, F. (Eds.), Electricity reform in Europe—Towards a single energy market (pp.172–205). Cheltenham: Edward Elgar.
Hobbs, B. F., Fieke, A. M. R., & Boots, M. G. (2005). The more cooperation, the more competition? A Cournot analysis of the benefits of electric market coupling. The Energy Journal, 26(4), 69–97.
IEA. (2018). Electricity information 2018. Paris: OECD.
Jamasb, T., & Pollitt, M. (2005). Electricity market reform in the European union: Review of progress toward liberalization and integration. The Energy Journal, 26, 11–41.
Jamasb, T., & Pollitt, M. (2008). Liberalisation and R&D in network industries: The case of the electricity industry. Research Policy, 37(6–7), 995–1008.
Jamasb, T., & Pollitt, M. G. (2011). Electricity sector liberalisation and innovation: an analysis of the UK’s patenting activities. Research Policy, 40(2), 309–324.
Jamasb, T., & Pollitt, M. (2015). Why and how to subside energy R + D: Lessons from the collapse and recovery of electricity innovation in the UK. Energy Policy, 83, 197–205.
Jones, L. P., Tandon, P., & Vogelsang, I. (1990). Selling public enterprises: A cost–benefit methodology. Cambridge: MIT Press.
Jorgenson, D. W., & Wilcoxen, P. J. (1990). Environmental regulation and U.S. economic growth. Rand Journal of Economics, 21(2), 314–340.
Joskow, P. L. (2008). Lessons learned from electricity market liberalization. The Energy Journal, 2, 9–42.
Kishimoto, J., Goto, M., & Inoue, K. (2017). Do acquisitions by electric utility companies create value? Evidence from deregulated markets. Energy Policy, 105, 212–224.
Koenig, P. (2011). Modelling correlation in carbon and energy markets, EPRG Working Paper no.1107.
Koske, I., Wanner, I., Bitetti, R., & Barbiero, O. (2015). The 2013 update of the OECD Product Market Regulation Indicators: Policy insights for OECD and non-OECD countries, OECD Economics Department Working Papers, 1200/2015.
Larsen, A., Pedersen, L. H., Sorensen, E. M., & Olsen, O. J. (2005). Independent regulatory authorities in Europe. In Presentation to SESSA conference on regulation, Bergen, March.
Lise, W., Linderhof, V., Kuik, O., Kemfert, C., Östling, R., & Heinzowe, T. (2006). A game theoretic model of the Northwestern European electricity market—market power and the environment. Energy Policy, 34(15), 2123–2136.
Marino, M., Parrotta, P., & Valletta, G. (2017). Electricity (de)regulation and innovation. Strasbourg: BETA.
Moffatt Associates. (2007). Market coupling: Key to EU power market integration (pp. 5–9). Autumn: APX Energy Viewpoints.
Moss, I. (2009). APX-ENDEX market coupling & BritNed. In Presentation at the BritNed connect seminar, London, 8th Dec 2009.
Newbery, D. M. (2005). Electricity liberalization in Britain: The quest for a satisfactory wholesale market design (pp. 43–70). Special Issue: The Energy Journal.
Newbery, D., Strbac, G., & Viehoff, I. (2016). The Benefits of integrating European electricity markets. Energy Policy, 94, 253–263.
Nillesen, P. H. L., & Pollitt, M. G. (2007). The 2001–2003 electricity distribution price control review in the Netherlands: regulatory process and consumer welfare. Journal of Regulatory Economics, 31(3), 261–287.
OECD. (2016). Business and finance outlook 2016. Paris: OECD.
Ouraichi, A., & Spataru, C. (2015). Integrating regional electricity markets towards a single European market. In 12th international conference on the European Energy Market (EEM).
Polemis, M. L., & Stengos, T. (2017). Electricity sector performance: A panel threshold analysis. The Energy Journal, 38(3), 141–158.
Pollitt, M. G. (2009). Electricity liberalisation in the European Union: A progress report, EPRG Working Paper, No. 0929.
Pollitt, M. (2012). The role of policy in energy transitions: Lessons from the energy liberalisation era. Energy Policy, 50, 128–137.
Steiner, F. (2001). Regulation, industry structure and performance in the electricity supply industry. OECD Economic Studies, 32(1), 143–182.
Thomson, H., Snell, C., & Liddell, C. (2016). Fuel poverty in the European Union: A concept in need of definition? People, Place and Policy, 10(1):5–24.
Tulloch, D. J., Diaz-Rainey, I., & Premachandra, I. M. (2018). The impact of regulatory change on EU energy utility returns: the three liberalization packages. Applied Economics, 50(9), 957–972.
UCTE (2007). Final report: System disturbance on 4 Nov 2006. Brussels: UCTE.
Vona, F., & Nicolli, F. (2014). Energy market liberalization and renewable energy policies in OECD countries, IEB Working Paper 14/18.
Acknowledgements
The author wishes to thank the participants at the joint Review of Industrial Organization and CEPR conference ‘Celebrating 25 years of the EU Single Market’ conference that was held at the Cambridge Judge Business School in April 2018 for their feedback on an earlier presentation of this paper. He also wishes to thank David Newbery, Larry White and two anonymous referees for helpful comments. All errors are his own.
Author information
Authors and Affiliations
Corresponding author
Additional information
Publisher's Note
Springer Nature remains neutral with regard to jurisdictional claims in published maps and institutional affiliations.
Rights and permissions
OpenAccess This article is distributed under the terms of the Creative Commons Attribution 4.0 International License (http://creativecommons.org/licenses/by/4.0/), which permits unrestricted use, distribution, and reproduction in any medium, provided you give appropriate credit to the original author(s) and the source, provide a link to the Creative Commons license, and indicate if changes were made.
About this article

Cite this article
Pollitt, M.G. The European Single Market in Electricity: An Economic Assessment. Rev Ind Organ 55, 63–87 (2019). https://doi.org/10.1007/s11151-019-09682-w
Published:
Issue Date:
DOI: https://doi.org/10.1007/s11151-019-09682-w