
Abstract
It is a widely known theoretical derivation, that the firm’s leverage is negatively related to volatility of stock returns, although the empirical evidence is still outstanding. To empirically evaluate the leverage we first complement previous simulation studies by deriving theoretical predictions of leverage changes on the volatility smile. Even more important, we empirically test these predictions with an event study using intra-day Eurex option data and a unique data set of 138 ad-hoc news. For our theoretically derived predictions we observe that changes in leverage of DAX companies from 1999 to 2014 cause significant changes to the implied volatility smile.
1 Introduction
The fact that changes in leverage lead to changes in volatility of stock returns is even before the publication of Modigliani Millers seminal paper a well-known phenomenon. The main idea behind the theory of this phenomenon is that a firm holds assets and issues equity. The equity holders claim the residual, of which riskiness positively depends on the leverage. Due to option’s implied volatility being linked to realized stock volatility, the implied volatility should also depend on the leverage as a ratio of market value of debt and equity. Hence, increases in stock prices yield in lower leverages accompanied by lower volatilities and vice versa.
Black (1976) was the first to show empirically a negative correlation between stock price returns and the volatility of stock returns, whereas Christie (1982) was the first who termed this observation leverage effect. However, Black (1976) also gave an alternative explanation on correlation between stock returns and volatility which he called the volatility feedback hypothesis. According to him as well as Pindyck (1984), French et al. (1987), Campbell and Hentschel (1992), or Bekaert and Wu (2000) the volatility feedback hypothesis explains the increase in volatility after some unexpected bad news regarding markets or a particular company. The resulting feedback leads to fluctuating stock prices and induces by statistical definition a higher standard deviation of the stock prices. Due to volatility persistence, investors revise their expected conditional variance. Lastly, the revised variance yields in higher expected returns which implies negative stock returns, strengthening the initial shock caused by the new market information. All in all, similar to the leverage effect the volatility feedback hypothesis implies a negative correlation between stock returns and volatility, since the effect is less pronounced in case of positive returns.
However, in this paper we concentrate on the leverage effect. According to the leverage effect the volatility of the stock returns is a function of the level of the stock price. This is in contradiction to the assumption of the Black and Scholes model, where the volatility is constant. On account of being an estimator of the future volatility, the implied volatility is conditional on the stock returns and prices and lastly on the moneyness of options. Hence, the characteristic skew of implied volatilities as a function is an inherent result of the leverage.
Several papers empirically analyze the relationship between stock returns and mostly realized or expected volatility, not bearing in mind the leverage effect. Hence, they concentrate on the asymmetric behavior of volatility and differ in terms of the explicit modelling of a stochastic process for the volatility as well as the frequency of data in use. Regarding the first point, most of the studies in this category often model the volatility explicitly as stochastic process, including a non-zero correlation of stock returns and volatility. Contrarily to models like Geske (1979) or Leland and Toft (1996), they apply for example an autoregressive model, a GARCH-model, a quadratic variation, or the Heston model in order to find variables that influence volatility. In addition, the leverage of a firm in their studies is often only one of several explanatory variables. In particular, the earlier authors such as Christie (1982), Schwert (1989), Duffee (1995) or Bekaert and Wu (2000) often apply their methods on daily or monthly data and paint a more or less ambiguous picture of the correlation between stock returns and volatility. More recent papers build upon Bollerslev et al. (2006) use more advanced methods and come to the conclusion, that there is a negative relationship between stock returns and volatility. The main idea of Bollerslev et al. (2006) is that we are only able to observe the continuous stochastic process at discrete times. Hence, by approximating the stochastic process of stock returns the results may be biased because of the so called discretization error. After the application of bias correction methods, Aït-Sahalia et al. (2013) demonstrate that it is possible to uncover the presence of a strong leverage effect in high-frequency data. Again based on high-frequency data, Wang and Mykland (2014) suggest adding time-varying leverage in order to explain the variation and clustering in volatility prediction models. In so doing, the authors worked on a second important aspect of the leverage effect, the time-dependency, which implies that the leverage changes if book or market values of equity and debt do so as well.
Additionally, there is also a strand of papers which tests the leverage effect with respect to implied volatilities as one of several determinants. Among others, Branger and Schlag (2004) state that the greater the risk-neutral probability for a decline in stock prices, the steeper the volatility smile. Ciliberti et al. (2009) reveal an over-reacting of implied volatilities to changes in stock prices. Again, most of the tests focus on the asymmetric behavior of volatility and do not have explicitly in mind the leverage effect.
With regard to the literature outlined above, two major ideas for analyzing the leverage hypothesis emerge. While one part of the studies presented above investigates the relationship between realized volatility and stock returns, the other part uses stock returns as one determinant among several drivers of the implied volatilities. Hence, most of the papers we referred to measure the leverage effect in an indirect way, because they do not explicitly use the leverage as a variable in their estimation equation. They use past or contemporaneous stock returns as proxy for the leverage.
Direct tests like Christie (1982) use a proxy for the leverage, when applying book value of debt in relation to market value of equity to define the leverage. He confirms a positive correlation between leverage and realized volatility of stock returns. In contrast, Figlewski and Wang (2000) use implied volatilities to estimate the leverage effect and find ambiguous results. Again, their analysis foots on book leverage and they do not control for changes in asset volatility. Contrarily, Choi and Richardson (2016) include the asset volatility in their estimation equation and measure the leverage with the help of bonds outstanding, equity market value as well as estimated market value of loans. They are able to prove a clear impact of the leverage on implied volatility of options. To a similar conclusion come Toft and Prucyk (1997) by going one step ahead. They find out that the skew of implied volatilities as a function of moneyness is more pronounced in case of highly leveraged companies than of more equity financed companies. An alternative testing strategy is adopted by Geske et al. (2016), who compare the pricing error of the Black-Scholes model with the error of the compound option model of Geske (1979), whereby the latter model comprises the leverage effect as a key component. Due to the mere fact that they approximate the leverage by the book leverage, they are able to show that the leverage effect affects call option prices and reduces pricing errors.
In a nutshell, there is evidence that the form of the implied volatility as function of the moneyness, especially the level and slope is driven by the leverage. However, some authors apply a specific model, yet other studies do not control for changes in asset volatilities. Last but not least, all studies have a more or less static proxy for the leverage as market value of debt over equity. Although some studies measure the market value of debt by bond and credit spread data, they ground their estimation on the nominal amounts for the debt at the balance sheet date.
In contrast to previous literature and approaches mentioned, we apply a completely different method. We use an event study based on the change of the implied volatility smiles before and after an event dealing with changes in the capital structure of a company e.g. events like a takeover, a selling of shares, an increase of equity, an increase of debt, or a share buyback. Hence, we are able to isolate the leverage effect from asset value changes as well as from changes in nominal amount of debt since last disclosure date. In addition, due to using measures of the smile as transformed option price (level, slope and curvature) we do not ground our study on a specific model. As events we use the informational content of ad-hoc news relating to the capital structure of DAX companies between 01.01.1999 and 31.12.2014. Benchmarking the individual companies changes in the implied volatility smile with the market’s implied volatility smile allows us to analyze the relation between the idiosyncratic (stock specific) implied volatility and the leverage effect. Thus, we avoid biases caused by systematic risk (market wide) changes. With the theoretically developed model and the empirical analysis, we can demonstrate the existence of the leverage effect for all event types, like takeovers, selling of assets, equity and debt increases, or share buybacks. Furthermore, our analysis clearly points at a size effect, meaning that the extent of the capital structure change significantly impacts the implied volatility smile.
Therefore, we clearly differ from Geske et al. (2016) as we avoid static balance sheet data which was already criticized in research in former times. Moreover, we are not limited on the Geske (1979) model as we use transformed option prices in our empirical analysis. Insofar we contribute to literature in two research areas: Firstly, to the leverage effect strand and secondly, to the literature strand analyzing the determinants of the smile. Consequently, we add explicitly to Pẽna et al. (1999), who mention e.g. transaction costs (bid-ask spread), maturity, or relative market momentum as explanatory factors for the curvature of the implied volatility smile. We enrich the literature which uses stock returns as proxy for leverage for example Branger and Schlag (2004) or Ciliberti et al. (2009) do.
Thirdly, we contribute to the theoretical models by deriving a method to differentiate the implied volatility function with respect to the moneyness. To this day only numerical solutions are applied (see Toft and Prucyk 1997). By varying the market value of debt and equity, and therefore the leverage of a company in the Geske (1979) compound option model, we theoretically demonstrate the effect of changes of the capital structure on the level, the slope, and the curvature of the implied volatility smile.
The paper is structured as follows. In Sect. 2 we develop the conceptual framework for predicting effects of changes of the capital structure changes respectively of the leverage effect in the implied volatility smile based on the Geske (1979) compound option model. Section 3 presents the approach for testing the theoretical model and therefore the design of the event study itself, and the selection of the events, explains the implied volatility smile, and the measuring thereof. Later on in Sect. 4, we introduce the enormous data set of ad-hoc news, Eurex, and Xetra data. We continue in Sect. 5 with the results and discuss in Sect. 6 their impact in relation to previous literature. The last section gives a short summary and conclusions of our findings.
2 Theoretical background
Our goal is to describe the influence of leverage on the implied volatility. Hence, we need a model of market value debt and equity allowing at the same time options on equity. Academic literature provides several kinds of option pricing approaches to model the market value of equity or debt of a firm. While Merton (1974), Black and Cox (1976), Longstaff and Schwartz (1995), or Briys and de Varenne (1997) focus on the valuation of corporate debt on the basis of Black and Scholes (1973) firm value dynamics, Leland and Toft (1996) estimate the optimal leverage for a firm and the therewith associated corporate debt prices. Toft and Prucyk (1997) include corporate taxes and bankruptcy costs in their option pricing model of the equity of a leveraged firm. Hull et al. (2004) extend the Merton (1974) model by an implied volatility calibration approach. Ericsson and Reneby (2005) evaluate the Merton (1974), Briys and de Varenne (1997), and Leland and Toft (1996) models with regard to the estimation possibilities via a Monte Carlo simulation. In contrast, Geske (1979) develops a compound option model in which the stock price itself is an option written on the assets of the firm with the debt as the exercise price.
While Leland and Toft (1996) or Toft and Prucyk (1997) use simulation studies, we prefer a comparative static analysis. Therefore, to derive our hypotheses we build on the compound option model by Geske (1979) as one possibility of including leverage in an option pricing model and describe a method which could also be applied for other models to derive implied volatility functions. Hereafter, we follow Occam’s razor and use this model due to its simplicity and ability to derive clear-cut predictions. Thus, we take the Geske (1979) model, consider the comments on it by Lajeri-Chaherli (2002) and Chen and He (2015), and define the price of the stock S of a firm as
where \(h_{j\pm }=[\text {ln}(V/{\bar{V}}_j)+(r \pm 0.5\sigma _V^2)T_j]/(\sigma _V\sqrt{T_j})\) for \(j=1, 2\), and V is the value of the assets of the firm, M the face value of the debt (zero bond), \(\sigma _V^2\) the instantaneous variance of the return of the firm’s assets, r the risk-free interest rate, \(N_1(\cdot )\) cumulative standard normal distribution, and \(T_2\) the maturity of the debt (note: in this notation \({\bar{V}}_2=M\)).
Consequently, the price of the call option \(C^{G}\) on S in the compound option model is given by
where \(N_2(\cdot , \cdot , \rho _G)\) is the bivariate cumulative standard normal distribution with \(\rho _G=\sqrt{T_1/T_2}\), K the exercise price of the compound option, and \(T_1\) the maturity of \(C^G\). For \(h_1\pm \), \({\bar{V}}_1\) represents the value V of the firm, implying the stock price of the firm is equal to the exercise price of the compound option \(S_{{\bar{T}}}-K={\bar{V}}_1N_1({\bar{h}}_{2+})-Me^{-r{\bar{T}}} N_1({\bar{h}}_{2-})-K=0\), with \({\bar{h}}_{2\pm }=[\text {ln}({\bar{V}}_1/M)+(r\pm 0.5\sigma _V^2) {\bar{T}}]/(\sigma _V\sqrt{{\bar{T}}})\) and \({\bar{T}}=T_2-T_1\). For the put option \(P^G\) case on S and also all the corresponding hypotheses we refer to “Appendix E”.
To reveal the impact of a change in leverage of a company on the implied volatility smile of observed option prices, we first define the leverage and second the implied volatilities. For the leverage, we follow the classical definition of the leverage ratio in corporate finance \((L=M/S)\) and define an increase in leverage by an increase of M. The reason for this decision is a purely technical one, due to a comfortable handling in terms of financial mathematics. Second, according to the literature the implied volatility \(\sigma ^{imp}\) is given as an implicit function IMP
with \(C^{BS}\) as the call price obtained by the BS model resp. observed in the market. To analyse the impact of changes in ratio L on the implied volatility smile, we differentiate the given implied volatility with respect to M. Using the rules for differentiation of inverse and implicit functions as well as several instances of the chain rule
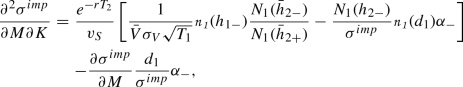
Altogether, after substituting the partial derivatives this yields toFootnote 1
where \(\nu _S\) is the option’s vega. For details, refer to “Appendix A”. The partial derivatives in the equation coincide with the economically expected argumentation. Higher leverage leads ceteris paribus to either less equity and ergo lower stock and call prices, whereas the latter implies lower implied volatility due to strictly positive vega of the option and the former leads to higher implied volatility given a call price. It can be shown that the lower stock price and therefore higher implied volatility effect strictly dominates (see “Appendix A”), hence the derivative is always positive. This yields our first hypothesis:
H1: If the leverage of a firm increases, the implied volatility increases accordingly.
To derive our second hypothesis, we need a measure for the slope of the implied volatility curveFootnote 2 (implied volatility as a function of strike) with respect to the strike price. We find this measure by differentiating the implied volatility with respect to the strike K. By applying the differentiation of the implicit function as well as of the inverse function, we formulate the slope of the curve as follows
One can see that the slope resolves to zero when the second summand, the Geske call price \(C^{G}\), is substituted by the BS model call price \(C^{BS}\), which is the well-known result of a flat implied volatility curve in the BS model. This formula can be easily interpreted: starting with the first summand, an increase in the strike leads to an increase in implied volatility given a fixed call price. In addition, an increase in the strike results in a lower Geske call price \(C^{G}\), which is ceteris paribus followed by a lower implied volatility. In the Geske model one can show that the effect of lowering the implied volatility dominates leading to negative slopes as expected (see “Appendix B” for the proof).
To analyse the impact of a change in leverage, we must differentiate the slope with respect to M. To simplify differentiations, we apply the theorem of Schwarz for continuously differentiable functions and calculate
After inserting the partial derivatives this leads to a solution as follows
whereby
\(\alpha _{-}=\frac{1}{K\sqrt{T_1}}-d_2\) and
 is the univariate standard normal probability density function. As can be seen in “Appendix C”, the slope of the implied volatility curve decreases with rising leverage what means a stronger pronounced volatility curve. Altogether, we can formulate the second hypothesis:
H2: If the leverage of a firm increases, the slope of the implied volatility curve decreases and therefore the implied volatility curve is more pronounced.
Now, we derive our third and last hypothesis in which we require a measure for the curvature of the implied volatility curve with respect to the strike price. We find this measure by twice differentiating the implied volatility with respect to the strike K
Note that \(C^{G}\) only depends linearly on the strike, which contradicts the result of the Black and Scholes (1973) formula, in which the underlying price (positive gamma) as well as the strike price influence the option price in higher orders. Inserting the individual derivatives leads to

with
This equation is strictly positive and consequently the function is convex. For a proof, see “Appendix D”. To demonstrate the impact of a leverage increase on the curvature of an implied volatility curve, we use the Schwarz theorem \(\left( \frac{\partial ^3 \sigma ^{imp}}{\partial K^2 \partial M}=\frac{\partial ^3 \sigma ^{imp}}{ \partial M\partial K^2}\right) \) again and differentiate Eq. (7) with respect to K
This derivative depends on several effects. The overall effect is positive, tested by a grid search. Therefore, a higher value of the derivative implies a more convex implied volatility curve. Economically speaking, a higher leverage leads to a more convex volatility curve. These insights are also in line with Toft and Prucyk (1997). Consequently, we formulate our last hypothesis:
H3: If the leverage of a firm increases, the curvature of the implied volatility curve increases and therefore the implied volatility curve is more convex.
As a robustness test for our theoretical model, we use the CEV model by Cox and Ross (1976) and Beckers (1980) (see “Appendix F”).
3 Research design: methodology and data
3.1 Research design
We build the event study on the semi-strong form of market efficiency by Fama (1970, (1991) as the change of a company’s leverage resulting from a corporate action announced via ad-hoc news should be reflected by the market within a short time. This approach coincides with a considerable stream of publications analysing the influence of firm-specific announcements or special political events on option prices resp. on implied volatilities or on stock prices. For example, Patell and Wolfson (1979) investigate the behaviour of option prices around the announcements of annual earnings, Sheikh (1989) focuses on the relation between stock splits and implied volatilities, and Gemmill (1992) looks at the behaviour of FTSE index options around the 1987 election in Great Britain. Furthermore, Jayaraman and Shastri (1993) examine stock returns and implied volatilities around the announcement date of dividend increases and Donders and Vorst (1996) study the implied volatility of call options around scheduled news announcements. Moreover, to conclude the brief event studies overview, there are also studies like Masulis (1980) or Dann (1981) who directly look at the impacts of capital structure changes on stock prices.
The following event study is designed in order to empirically test the impact of changes in the leverage effect on the implied volatility smile, with the goal of analysing the theoretically developed hypotheses in Sect. 2. An event is triggered by ad-hoc news announcing a change in the capital structure of a DAX company due to a corporate action. Basically, ad-hoc news is published in Germany by a specific company, the so-called Deutsche Gesellschaft für Ad-hoc-Publizität mbH (DGAP). This fact ensures that information relevant to stock prices is centrally distributed and that all market participants have access to the same information at the same time. According to Fama (1970, (1991) and the semi-strong form of market efficiency, an information-efficient market will anticipate future volatility immediately after new information is distributed. Therefore, effects on and changes in the market participants’ perceptions on a company’s expected risk can be observed by comparing implied volatility smiles on trading days before and after an event. Since news for multiple specific companies and general market information reach the market, we benchmark the changes against the DAX. To calibrate our models and to evaluate the event study, we use intra-day Eurex equity options, Eurex DAX index options, and Eurex DAX futures, as well as Xetra one-minute tick data. A more detailed description of this data, the events, and the ad-hoc news follows in the next sections.
3.2 Events
We classify ad-hoc news affecting directly or indirectly the leverage of a company into five categories: takeover/buying of shares (takeover), spin-off/selling of shares (selling), increase of equity (equity increase), increase of debt (debt increase), and share buyback (share buyback). Within each category we distinguish between financing activity and its corresponding effect on leverage. Hereinafter, basically “case 1” stands for an increase in leverage and “case 2” represents a decrease in leverage. However, we have to distinguish between direct and indirect effects for “case 1” and “case 2”. Direct effects relate to the market value of debt in relation to market value of equity and indirect effects affect the change of the riskiness of assets which changes the cash flow distribution between debt holders and equity holders (redistribution hypothesis) and hence ratio market value of debt and equity. This indirect effect appears at takeover and selling of asset events in relation with cash activities as the redistribution hypothesis effects from cash flow to equity resp. equity to cash flow and the impacts on leverage can not clearly be separated. Therefore, we consider this particular situation as “case 3” and do not consider these mixed events. Furthermore, if the transaction does not affect the capital structure due to an asset deal in the same business or an equal debt or equity financing of the event, we describe this as “case 4”. However, we do not consider these “case 4” events in the event study evaluations and therefore remove these events from the sample. The degree of leverage is not easy to determine as we consider market instead of balance sheet values. To estimate the degree of leverage resp. the market values of debt and equity, models like Merton (1974), Geske (1979), Leland and Toft (1996), or Toft and Prucyk (1997) etc. are necessary as mentioned at the beginning of Sect. 2. However, this would drastically increase effort. For this reason, we assume a capital structure of 50% equity and 50% debt as starting point.
Clearly a takeover/buying of shares or business units of other companies financed by issuing new debt increases the leverage (“case 1”), whereas a transaction conducted with the help of an equity increase decreases the leverage (“case 2”). A takeover with retained earnings is a special kind of situation. From an accounting perspective, retained earnings are considered as equity, but both balance sheet positions are nearly risk-free and should be transferred to acquire risky shares of another company. In most cases, the acquired company itself is leveraged, which increases this effect in market values. Therefore, we classify this type of event as an increase in leverage (“case 1”). Hence, a spin-off of parts of the company, selling of business units or subsidiaries, or selling other share holdings in order to stabilize the balance sheet (retained earnings resp. equity) reduces the leverage (“case 2”). While receiving additional equity by the shareholders simply decreases the leverage, e.g. by stabilising the balance sheet or paying back some debt (“case 2”), the effects of an increase of debt by obtaining additional cash from the bondholders are more difficult to identify. The classification and conditions of the bonds must be closely examined. Beyond classical bonds increasing leverage (“case 1”), there are some bonds like mandatory convertible bonds, Tier 1 bonds, or contingent convertible bonds, which have equity-like characteristics. Therefore, all these bonds with a clear equity nature are classified as “case 2”. Additionally, many companies issue convertible bonds, offering the bond holders the option to acquire shares of the company instead of the repayment of the bond’s face value. There is a huge discussion about the impact of effects of convertible bonds on a company’s capital structure, as well as on the company’s motivations for issuing, and the corresponding effects on stock markets. Janjigian (1987) shows, by comparing straight debt and convertible bonds, that the equity component of the convertible bond is about 40–70% of its total value and that this could be enough for a decrease in leverage for several companies. Furthermore, Stein (1992) and partially also Bancel and Mittoo (2004) discover in a survey of European companies on financing decisions using convertibles that the primary motivation for companies financing with convertible bonds is to acquire a so called “delayed equity” or “equity through the back door” as well as a “debt sweetener”. However, Mayers (1998) links the issue of convertibles to solving the sequential-financing hypothesis and concludes that although the convertibles bring some equity, new long-term debt is issued within the year of the conversion of the convertible bond, and in general investment activities rise. As a consequence, he regards convertible bonds as a popular and flexible financing opportunity for companies and a good investment opportunity for institutional investors. As there is no clear decision or trend for a definitive acceptance as equity in literature and rating agencies also do not consider convertibles as equity, we decide to classify an increase in leverage for convertible bonds (“case 1”). At last, all share buybacks in our sample are performed using cash/retained earnings and are consequently “case 1”. Table 1 provides a short summary of the corporate actions and the kind of events applied in the event study.
3.3 Estimation of implied volatility smiles
We calculate implied volatilities for European options with the BS model and implied volatilities for American options (with dividends) via the model by Barone-Adesi and Whaley (1987). The implied volatility function is estimated according to the methods suggested by Goncalves and Guidolin (2006), Masset and Wallmeier (2010), or Wallmeier (2015). The time-adjusted moneyness Mo(S, K, T, r, d) of the option is given by
with dividend d only considered for the equity options.
This definition always assigns a moneyness of zero to at-the-money (ATM) options, negative moneyness to in-the-money (ITM) calls resp. out-of-the-money (OTM) puts, and a positive moneyness to OTM calls resp. ITM puts. Afterwards, we calculate the implied volatility function IV(Mo) with the cubic regression function
where \(\mathtt {b}_j\) (\(j=0, \dots , 3\)) are the regression coefficients, \(\varepsilon \) the random error, and Du a dummy variable with
Du enables a better handling for the asymmetric behaviour of the implied volatilities around a moneyness of zero.
Based on the implied volatility function [see Eq. (13)] and insights into the theoretical model in Sect. 2, we build three measures for implications of the leverage effect on the implied volatility smile: the level of the implied volatility (level), the slope (slope), and the curvature (curvature) of Eq. (13). In order to ensure adequate comparisons of each measure and the implied volatility smiles before and after the event as well as with the benchmark, we define an interval with the left (\(b_l\)) and right bound (\(b_r\)) in order to evaluate Eq. (13). It holds that
All calculations of the three measures are done within this interval. This definition leads to a consideration of mainly ITM calls, close OTM calls, OTM puts, and close ITM puts within the implied volatility smiles. A reason for the bounds is that we notice a high trading activity within these bounds for the generally less liquid equity options compared to the DAX index options. In the context of the leverage effect, also risk and therefore hedging aspects play an important role and lead to a focus on the left wing of the smile, which is determined by OTM puts used for hedging [see Bollen and Whaley (2004), in which results are verified for S&P500 index options]. Moreover, using this interval we want to take into account the quite asymmetric behaviour around zero of the time adjusted moneyness, which results from the logarithm. In order to facilitate notation, we avoid using an additional index for the day after the event and the day before the event as well as for equity and index options in the measures. The general procedure is for all measures the same. At first, we calculate each measure for the equity options on the trading day before and after, calculate the relative change, and subsequently benchmark it with the corresponding DAX index option measure. Second, we compare the result from the measure with the prediction of the event (see Table 1).
We measure the level of Eq. (13) with the indicator level. It holds that
where mo is a vector of 100 equidistant points within the interval \([b_l,b_r]\). This approach allows us to evaluate the implied volatility smile behaviour more precisely in the defined interval, than e.g. taking \(\mathtt {b}_0\) of Eq. (13). Next, we look at the slope with the measure (slope). The parameter \(\mathtt {b}_1\) of Eq. (13) is responsible for the slope of the cubic regression. However, we focus on the left wing of the implied volatility smile and not on the whole smile, resulting in a slope measured by the mean over gradient slopes of 100 equidistant points (again vector moFootnote 3) within the interval \([b_l, b_r]\)
Finally, we apply the total curvature (curvature) over the defined interval \([b_l, b_r]\) as our last measure
where curv(Mo) is the curvature at Mo
For a brief overview of the curvature, see e.g. Weisstein (2002). With the help of the three measurements of changes of the implied volatility smiles in connection with the prediction for each event (“case 1” and “case 2”) of the leverage effect (see Table 1), we receive the following effects when the measurement is equal our predictions of the theoretical model and our hypotheses (Table 2).Footnote 4
For evaluation of our event study, a traditional hypothesis test is used. We test our model’s goodness of fit via a binomial distribution. Therefore, we define the hypothesis \(H_0\), that the empirical result resp. probability p is equal or lower \(p_0\) versus the alternative hypothesis \(H_1\)
We choose a level of 0.5 for \(p_0\) because it is exactly the expected probability if the results are randomly drawn from the assumed binomial distribution. Additionally, we do some robustness tests on several sub-samples, which requires taking into account the small size of the samples, especially when testing the sub-samples for the distinction of the event character. Therefore, we first test whether an approximation by the normal distribution is applicable, in accordance with the common rule of thumb \(n_Ep_0(1-p_0) >9\) from Schader and Schmid (1989). \(n_E\) stands for the number of events. In the case that the approximation is not possible, we take the binomial distribution (see Hazewinkel 1987) and directly calculate
\(H_0\) is rejected if the number of correct predictions is greater than the smallest value of \(\mathtt {g}\). All tests are performed at significance levels \(\alpha ^{sig}\) of 1%, 5%, and 10%.
Besides the robustness tests on several sub-samples, we also conduct some additional robustness tests with further models instead of the binomial distribution. We define the difference between the relative change of the implied volatility smile of the company and of the DAX itself as \(\Delta {SMILE}\) for the level, slope, and curvature. \(\Delta {SMILE}\) is positive for an accurate prediction in “case 1” and negative for “case 2” for the level and curvature. This approach is some kind of testing abnormal implied volatility reactions as a results of changes in the capital structure. So far literature is limited to abnormal returns, see e.g. Masulis (1980) or Dann (1981). For the slope, the opposite holds—negative for “case 1” and positive for “case 2”. Based on this, we define the regression model
with
for testing if the differences between the companies’ and the markets’ implied volatility smile are related to the defined events and their size. mc is the relation between transaction volume announced in the ad-hoc news (net effect on leverage) and the market capitalisation of the company at the end of the day before the event. \(med^{case1}\) is the median of mc for “case 1” and \(med^{case2}\) the median of mc for “case 2” events.
The first two tests presented above rely on the sample of events including leverage effects. In contrast to this procedure, we randomly generate a second sample of events (excluding the days of the ad-hoc news announcements and day before/after the event) with the same companies as in the final event sample (definition see Sect. 4). This means, for each company we randomly draw two consecutive days and conduct on these days the same analyses for the implied volatility smiles as for the final event sample. Note that we draw two random days for the implied volatility smiles as long as the implied volatility smiles fulfil the same requirements (definition see section below) as the final sample. Subsequently, we use a Wilcoxon rank sum test (see Wilcoxon 1945) in order to test if the effects (\(\Delta {SMILE}\)) in our event sample are higher than those of the random sample. Accordingly, we perform for the level and the curvature a right-tailed hypothesis test with the null hypothesis that the median of \(\Delta {SMILE}\) of the event sample is smaller than the median of a random sample. Consequently, the alternative hypothesis states that the median of the event sample is greater than the median of a random sample. For the slope, we test the opposite. To avoid defining sub-samples, we multiply the results of \(\Delta {SMILE}\) by minus one for all events of “case 2”. In so doing the correct predictions for \(\Delta {SMILE}\) are equivalent to those of “case 1”.
4 Data
4.1 Ad-hoc news
The event study includes all ad-hoc news published by DGAP for DAX companies with affected capital structure from 01.01.1999 to 31.12.2014. As such, the study covers all events relating to the 30 companies that have been part of the DAX per 31.12.2014. Furthermore, we also take companies into account that were not part of the DAX per 31.12.2014, but were rather part of the DAX earlier in the period, excepting Hoechst AG (left 20.09.1999), Mannesmann AG (left 14.02.2000), Karstadt Quelle AG (left 19.03.2001), Dresdner Bank AG (left 23.07.2001), Degussa AG, (left 23.09.2002), and Epcos AG (entered 14.02.2000 and left 23.12.2002). The reasoning behind the exclusion is a missing listing of options of these six companies on EUREX. All in all, the event study analyses ad-hoc news of 42 companies. Each of these ad-hoc news provides a time stamp with day, hour, minute, and second information. We apply this information for mapping the ad-hoc news with the option data.
In sum, we identified 513 ad-hoc news containing information about capital structure changes. However, much of this news must be winnowed for the following reasons. Often we face confounding events, meaning that the time window of the event study is overlap, or the effect of the ad-hoc news is not clearly contributable to a specific event, as in the case of ad-hoc news simultaneously announcing share buyback programs and quarterly or annual results. Furthermore, in some cases the same corporate action is subject to more than one ad-hoc news. For example, some companies announce a takeover first in one ad-hoc news, containing information that the company is in talks concerning a takeover; then a very short period later, they present more details in a separate ad-hoc news. In this case, we consider the first ad-hoc news solely because this instance contains new market information according to the efficient market hypothesis by Fama (1970) and thereby influences prices of stocks and options. Additionally, for some events it is not possible to identify the effect on the capital structure as clear facts are missing e.g. missing information about the financing structure or the volume of the transaction, as companies decide not to publish the buying/selling price. After finishing this clearing process, we have a sample of 360 ad-hoc news reports on which to start analyses. Unfortunately, 222 events must be additionally removed as there are not enough traded options for the estimation of high quality and robust implied volatility smiles (for definitions, see Sect. 4.4 below). The large number of removed events can be explained as follows. We face a very long period for our event study and at the beginning, trading volume and also trading activity on option markets resp. Eurex was much lower than it is today. Hence, more than two third of the removements occurred before 2007. Moreover, option trading on smaller DAX companies like Fresenius SE, Merck KGaA, or Linde AG is even today significantly lower than on the huge blue chips like Bayer AG, Deutsche Telekom AG, or Siemens SE. All in all, our final sample of ad-hoc news consists of 138 events. Figure 1 provides an overview of the events, classifying them based on mc. It also contrasts the original 360 events and the 138 events remaining after removing the events lacking sufficient trading in options. It becomes apparent that illiquidity affects all intervals, but the final sample of events still covers a broad range of transactions over all intervals. A very positive aspect of the sample is that about half of the transactions (“case 1” as well as “case 2”) are greater than \(5\%\) of mc and about \(10\%\) of the transactions even greater than \(20\%\) of mc. This structure of events allows further research e.g. on potential size effects. Moreover, the final sample covers 74 “case 1” and 64 “case 2” transactions.

Number of events in the event study classified according to mc. This figure shows the number of events of the event study. It differentiates between the number of events with which we started our analysis (left bars) and the number of events remaining after having removed events with too few options (right bars). The events are sorted in various intervals of mc. Note that mc stands for the relation between transaction volume as announced in the ad-hoc news (net effect on leverage) compared to the market capitalisation of the company at the end of the trading day before the event
4.2 Eurex option and Xetra tick data
To estimate the implied volatility smiles of the companies, we use Eurex intra-day option prices from 01.01.1999 to 31.12.2014 and the corresponding Xetra data. The equity options are American style options and include dividends. Trading of equity options is possible at Eurex from 08:55-20:00MEZ. We apply Eurex DAX index options (trading period 08:50-20:30MEZ) and the Eurex DAX futures (trading period 07:50-22:30MEZ) as input for the benchmark. As a corresponding DAX index future does not exist for every DAX index option maturity, we apply the mapping and adjustment approach by Hafner and Wallmeier (2001). In contrast to equity options, the index options are European style options. The intra-day data provides information about trade price, trade size, and an intra-day time stamp up to centisecond for all equity and index options. Our data set covers the equity options of the companies described above as far as they have been already traded on Eurex in the period of the event study. Eurex data is provided by Karlsruhe Kapitalmarktdatenbank.
We map the equity options with one-minute tick data provided by tickdatamarket.com for the period from 2004 to 2014 and intra-day tick data aggregated to one-minute tick data from Karlsruhe Kapital-marktdatenbank for the period from 1999 to 2003. Therefore, the intra-day Xetra data includes all 1-min aggregated trades from 09:00-17:35MEZ for each trading day. One-minute aggregated resp. One-minute tick data means that it reflects only the last trade within a minute timeframe. The corresponding interest rates for calculating the implied volatilities are obtained via the Svensson model (see Svensson 1994) and the necessary parameters provided by Deutsche Bundesbank.
4.3 Dividends and market capitalisation
The equity option data set includes several companies paying dividends within the option maturity. Information about the dividends, like amount and ex-dividend date, comes from Thomson Reuters datastream and is ultimately mapped to the options. The market capitalisation of the DAX companies at the end of the trading day is obtained from Thomson Reuters datastream. The periods of dividends and market capitalisation correspond to the Eurex and Xetra data.
4.4 Mapping events, options, and quality of implied volatility smiles
On the basis of trading hours at Eurex and Xetra, we define a trading day from 09:00-17:35MEZ. The reason for the limitation is the need for Xetra data to calculate implied volatilities. We compute the implied volatility smile over the first complete trading day before and after the event and thereby also look at the publishing time of the ad-hoc news. For example, if the ad-hoc news is published before 09:00MEZ, the trading day after is considered to be the actual day, or if the ad-hoc news is published after 17:35MEZ, then the trading day before is considered the actual day. To collate enough options for the volatility smile, we use the nearest complete trading day before and after for ad-hoc news published during a trading day. Eurex equity options are not as liquid as the highly liquid DAX options for each maturity and each trading day, and especially not for all maturities. In order to obtain stable and robust equity implied volatility smiles, we always focus on the options series with a maturity of at least 20 days before the event. However, the equity options are the essential basis of the event study. To ensure an appropriate quality of the implied volatility smiles and of the results of the event study, we demand a minimum of three different strikes and seven different option prices. Furthermore, the \(R^2\) of the cubic regression [see Eq. (13)] must be at least \(30\%\). These minimum requirements are valid for the equity implied volatility smiles before and after the event. The partly weak trading activity of the equity options leads in some cases to outliers in the option prices compared to other prices, although lower and upper values for option prices are not broken. To obtain a good fit of the equity implied volatility smiles, we eliminate these options with the Cook-distance (see Cook 1977, 1979). For the required critical value in the Cook-distance, we follow Bollen and Jackmann (1990) and use 4/(number of option prices). All events with implied volatility smiles that do not meet these minimum requirements are removed (222 events) and not considered in the results of the event study. Table 3 provides an overview of a descriptive statistics about average different traded strikes and different traded prices for the options contained in the final sample and used for calculating the implied volatility smiles. Moreover, it provides information about the \(R^2\) of the cubic regression for estimating the implied volatility smile. A point of interest emerges concerning the ad-hoc news and the trading activity on Eurex: for the equity options we see an increase of \(5\%\) in different strikes (of respective options) traded and an increase of about \(25\%\) in different prices (of the respective options) traded when comparing the day before to the trading day after the event. The estimation quality of the implied volatility smiles is nearly 80% at a high level which ensures the basis for our three measures is reliable. Of course, the DAX options are much more liquid than equity options and the average \(R^2\) is of a very high quality.
5 Empirical evidence
Analysis of the impact of the leverage effect on the structure of the implied volatility smile focuses on three different measures (level, slope, and curvature) as well as on several sub-samples by clustering according to the type of an event (takeover, selling etc.), an increase (“case 1”) or decrease (“case 2”) prediction, or distinguishing between transaction volume of the events in relation to the market capitalisation of the company (\(>5\%, >10\%,\) and \(>15\%\)). The tests on the sub-samples also provide a kind of robustness check. Furthermore, for several evaluations we look at the “at least 1” or “at least 2” category. This means we take the measurements of the level, slope, and curvature and define that at least one resp. two out of these three measures must be predicted correctly. As there is no statistical significance for the case when three measurements are correctly predicted simultaneously, we renounce it in the tables. After main analysis of the results, it follows two robustness tests: a regression based approach as well as a comparison of the event sample to a random event sample. First, we illustrate the impact of leverage with a typical example, such as a classical increase in equity: Thyssen Krupp AG announces equity increase by 10% (see Fig. 2). We choose this example as it reveals several properties at the same time. It is a perfect example as all three measures can be accurately predicted simultaneously, with emphasis on benchmarking results of the equity implied volatility smile with the DAX index implied volatility smile. Additionally, Fig. 2 demonstrates that there is less trading activity on the right wing of the equity smile and that it is therefore reasonable to prioritise the empirical study on the left wing of the implied volatility smile. For description of effects of this event in more detail, see the notes below Fig. 2.

Thyssen Krupp AG announces equity increase by 10%
In aggregate, our findings reveal a clear and statistically significant existence of the leverage effect on the German market [see Table 4; for all tables concerning the binomial test, we show the number of the original events (column “Events”), the number of events removed due to illiquidity (column “Removed”), and the number of events predicted in the right resp. wrong direction (column “Right” resp. “Wrong”)]. While for the slope and the curvature we even observe highly significant results at a 1% significance level (\(H_0: p\le p_0\) can be rejected), we see weak effects for the level of the implied volatility smile at a 10% significance level. In particular, the high significance of the slope and curvature demonstrates that changes in capital structure affect the left wing of the smile, which consists of OTM put options used for hedging purposes and ITM call options. In the context of hedging, a decrease in leverage reduces the expected future volatility, the therewith associated downside risk, and finally reduces in consequence the hedging costs for market makers. On the other hand, an increase in leverage also increases implied volatility as market makers face higher hedging costs. Bollen and Whaley (2004) find that for S&P500 index options, net buying pressure as a result of institutional investors’ demand for portfolio insurance increases the market makers’ hedging costs and raises implied volatility. Therefore, our results for the equity options in the defined event window in relation to an increase (“case 1”) or decrease (“case 2”) in leverage are similar, as e.g. a decrease of leverage could reduce the net buying pressure of OTM put options by investors. Besides, analyses of the three defined measures, we also look at the significance of one resp. two of the three measures being significant at the same time for an event. For both cases we find highly significant results at a 1% significance level. Particularly, the “at least 2” case shows that our measures work well and that the leverage effect simultaneously affects more than one measure of the implied volatility smile. By considering the “at least 1” case, we see only 11 out of 138 events react in an unpredictable manner. This again highlights the suitable performance of our theoretical model as developed in Sect. 2, verifies our hypotheses, and demonstrates that leverage matters.
Next, we focus on analysis of the different impacts of event types on each measure (see Table 5). The level of implied volatility smile is only significant for takeover events. Selling events are close to but below the 10% significance level. However, for the other events, significant results were not observed. One reason might be that the mentioned measure level is particularly sensitive to huge transactions. The volume involved in e.g. share buyback announcements remains in most cases below 5% of the market capitalisation and only in a few exceptions reaches 10%. Therefore, the announcement’s impact on the option market is not very large. In general, there are not as many events in these three categories as in the takeover or selling announcement categories making it much more difficult to achieve some statistical significance. The slope of the implied volatility smile reveals better results than the level of the implied volatility smile does. We see significant impact on the selling and debt increase events and notice the takeover and share buyback events are only marginally in the area of non-significance; however, a clear tendency does appear. The curvature obviously provides the best results. Four out of the five event categories are statistically significant. Even categories with fewer observations provide stable and significant results. Thus, we conclude that the curvature generates independently from the event category, and the case of leverage the best results. It seems that the curvature is the most sensitive measure, as it is especially significant even for the share buyback events, whose impact compared to the market capitalisation of the company is small.
Again, as for the whole sample, we evaluate the “at least 1” and “at least 2” cases (see Table 6). While for the “at least 1” case, we see highly significant results, the “at least 2” case only reveals very weak evidence, but a clear trend. An explanation for the results of the “at least 2” case is that the requirements increase and the simultaneous decrease in sample sizes again makes it more difficult to show statistical significance.
In a further robustness check, we investigate whether there are differences in quality of the predictions between “case 1” and “case 2” (see Table 7). The slope is the only measure showing significant results for both predictions. The other two measures are at least in one case significant. Effects on the level are dominated by an increase in leverage. Based on these insights, investors care more about an increase than about a decrease in leverage. All in all, this sub-sample test shows that the prediction of implied volatility smile changes and therefore our model works well in both directions—for a decrease and an increase in leverage. In general terms, there exist no large outliers concerning the predictive capability of our model and the reaction of implied volatilities on changes in leverage of German companies.
Finally, we look at the impact of transaction size of the event compared to market capitalisation of the company, whereby we concentrate on the 5%, 10%, and 15% clusters (see Table 8). Taking higher percentages would not make sense due to lower numbers of events in the respective sample. In contrast to the previous tests on the sub-samples, there is, besides significant results, a very clear tendency for the few non-significant sub-samples. Particularly, the level of implied volatility produces very good results, with a significance level even higher than for the whole sample (see Table 4). We conclude again that this measure is particularly sensitive to mc, while the slope and curvature already react to smaller mc. These insights are in line with the presumptions in the analysis for the share buyback event sub-sample. The “at least 1” and “at least 2” cases also provide significant results over the four thresholds. Regarding results for this sub-sample, in a nutshell a size effect is visible, despite a small number of events in the sub-samples.
Having performed a test of the hypotheses with the binomial distribution, we run a robustness test on a regression model [see Eq. (21)]. The results of the robustness test (see Table 9) basically confirm the main findings outlined above. There are significant estimators for \(\eth _3\) for the level and slope for an increase in leverage for events with an impact higher than the median of mc (for “case 1” the median of mc is \(6.5\%\)). For “case 2” only events with an impact lower than the median of mc (for “case 2” the median of mc is \(4.9\%\)) and for the curvature are significant, but with the wrong sign. These two main results are in line with the sub-samples from the binomial test. The significance of the results for the curvature sinks with increasing mc (see samples 10% and 15%) while the significance stays stable for the level and slope, despite decreasing sample sizes. Non-significant results have the correct sign for all “case 1” situations (\(\eth _1, \eth _3\)), which shows that at least the trend is correct. However, the signs are only partially correct for “case 2” predictions (\(\eth _2, \eth _4\)). These results demonstrate that investors care more about an increase than a decrease in leverage. A bigger event sample probably would improve the results as the rather small sample of 138 observations has been categorised by 4 dummy variables into four roughly equal sized clusters of “1” and “0” observations. Based on sample size, event type, and mc, there are about one quarter “1” and three quarters “0” in each dummy vector. All in all, this robustness test confirms weak effects of a change in leverage on the implied volatility smile and particularly highlights a size effect for events relating to an increase in leverage.
Finally, Table 10 presents the robustness test covering the differences between the effects of the event sample and a random sample by a Wilcoxon rank sum test. The z-values have the correct sign, except for the slope. This fact demonstrates that changes in the implied volatility smiles in the event sample are (in direction) higher than in the random sample. For the level, the null hypothesis (median \(\Delta SMILE\) event sample is smaller than median \(\Delta SMILE\) random sample) can be rejected at a \(10\%\) significance level and for the curvature, the null hypothesis can be even rejected at a \(5\%\) significance level. To sum up, these results show that the effects of the leverage effect sample are higher than on random days and therefore a leverage effect exists.
6 Discussion
In general, the event study idea, in connection with isolating leverage on the basis of ad-hoc news and benchmarking the results with the change of the implied volatility smiles of the market (DAX), confirms the leverage effect on implied volatilities. We find significant results for the leverage effect hypothesis for the level, slope, and curvature of the implied volatility smile. Tests on sub-samples and robustness tests demonstrate the stability of the results. Therefore our results are in line with the latest comprehension of the existence of the leverage effect in literature by Bollerslev et al. (2006), Aït-Sahalia et al. (2013) or Wang and Mykland (2014). By using the Heston stochastic volatility model, a logarithmic two-factor stochastic volatility model, and high-frequency S&P500 index data, Bollerslev et al. (2006) identify a leverage effect as well as a volatility feedback effect, and conclude that only risk-based explanations (see e.g. Campbell and Hentschel 1992) are no longer adequate for explaining asymmetric volatility. They state that a huge market decline over a five-minute interval raises market volatility (level and historically) and the effects of this uncertainty last several days. Aït-Sahalia et al. (2013) also apply a Heston stochastic volatility model and high-frequency data (S&P500 and Microsoft Corp. one-minute ticks), but at the same time conduct several error corrections, like e.g. discretisation errors, smoothing errors, or noise correction errors. After all these adjustments, they demonstrate an even stronger existence of the leverage effect. Wang and Mykland (2014) use a non-parametric estimator for the leverage effect and integrate it into a stochastic volatility model. Hereby, the leverage effect is calculated by covariation between the returns and a function of the return volatility. In contrast to these three recent studies, we do not have to eliminate any error terms – a huge criticism of earlier studies based on historical volatility. Furthermore, we do not base our empirical study on the well-known negative correlation between returns and their volatility, the so-called down-market effect by Figlewski and Wang (2000). We completely focus on changes of the implied volatility smiles, which represent the market participants’ future expectations of change in the leverage initialised by ad-hoc news. However, we are in line with the latest literature in using high-frequency data. Hereby, we also develop a theoretical proof of the effects of the leverage effect on the level, slope, and curvature on the implied volatility smile in the Geske (1979) compound option model. We provide a very strict selection of the equity implied volatility smiles, benchmark them to the implied volatility smile of the market (DAX), face a very short event window, and ensure, due to the strict selection of the events itself, a unique data sample and methodology. Of course, the DAX as benchmark is only the best available proxy. It might be discussed, if the weightings of the companies in the DAX index are equal to weightings in the DAX implied volatility smile. But this might be not the case. DAX index weightings are determined by figures like free-float, market capitalisation, or trading volume, while DAX implied volatilities show expected volatility. However, the individual composition of the DAX implied volatility smile is on its own a huge topic for future research. Moreover, as mentioned in the introduction there is a close relation between the leverage effect hypothesis and the volatility feedback hypothesis [for a discussion see also Bekaert and Wu (2000) and Wu (2001)]. Our focus lies solely on the leverage hypothesis. To get some impressions of the impact of shocks caused by the events on the stock prices of the companies, we do a simple test and compare closing prices of the stocks on the day before and after the event. This test can be seen as a proxy for the volatility feedback hypothesis and if shocks lead to falling stock prices. For “case 1” 41 out of 74 stock prices go down, while for “case 2” 36 out of 64 go up. Both situations are non-significant according to a binomial test. However, our results for the implied volatility smile show a significant result for both predictions (see Table 7). Therefore, our results indicate that it is the leverage hypothesis and not the volatility feedback hypothesis explaining asymmetric volatility. In reference to the available data, a more detailed analysis testing the volatility feedback hypothesis on the equity market and a comparison of these effects to this event study would be possible. For example, in line with the methodology by Bollerslev et al. (2006), it can be examined the time of an increased volatility after an event (shock). At last, we discuss the time to maturity of the option in relation to the event type. While, e.g. an increase in debt can be announced by ad-hoc news and conducted by an accelerated book-building within a very short timeframe within option maturity, the definitive completion of a takeover can take much longer and be out of option maturity. To best of our knowledge, there is no literature dealing with this issue in the context of option markets and event studies. Therefore, we handle this issue by applying the concept of efficient markets by Fama (1970, (1991) that all new information is priced immediately as there is a certain probability that the change of capital structure takes places within the maturity of the option, and assume that the definitive completion date does not play a role. For most corporate events, this date would not even be available, even if liquidity for equity options with a long maturity significantly decreases. This fact would lead to less stable equity implied volatility smiles and again reduce the number of events. To obtain even more significant and more reliable results, a greater sample size of events would be desirable, as particularly in the first years of the time period regarded for many events, insufficient intra-day option trades are available at Eurex, and must consequently be removed. The same problem arises for the rather small DAX companies, as we do not have enough option trades before and after the event to calibrate the models in the event study. Nevertheless, this event study contributes by using implied instead of historical volatility, an approach requiring no measurement of correction errors due to the isolation of different types of leverage influencing actions, a theoretical model including nonlinear effects and finally demonstrates that leverage matters.
7 Conclusion
This work provides new evidence for the leverage effect, which is part of the well-known and discussed phenomenon of asymmetric volatility in financial markets and extends the results as well as the approach of Geske et al. (2016). Based on extension of the Geske (1979) compound option model by the leverage effect, we demonstrate theoretically the effects of changes in the capital structure of German companies on the implied volatility smile. Accordingly, we concentrate on the level, slope, and curvature of the implied volatility smile. Hence, we provide a framework for analytical analysis of other models. With help of a unique ad-hoc news data set for the leverage changes of the DAX companies from 1999 to 2014 and the use of intra-day option prices, we find significant evidence for the existence of the leverage effect. Robustness tests on sub-samples of the ad-hoc news demonstrate the significance of the leverage effect on various groups of corporate events, such as takeovers, selling of assets, debt increases, equity increases, or share buybacks. Furthermore, the model shows robust results for an increase as well as a decrease in leverage and particularly highlights that the change of level of the implied volatility depends on the transaction volume of the event compared to the market capitalisation of the company. Besides, we generally see higher impacts on the implied volatility smiles in the leverage effect event sample compared to a random event sample. All in all, we believe that the unique combination of a theoretical model and an event study for explaining asymmetric volatility shows the importance of the leverage effect for this area of research.
Even though we have provided new insights into this phenomenon, our results are only valid for the German market and some of our sub-samples are very limited, due to liquidity reasons—for the impact of liquidity on implied volatility smiles see Rathgeber et al. (2020). For example, a study on the European or US market might gather greater sub-samples and provide the possibility of branch comparisons. To sum up, our findings create an important step in the linkage between corporate capital structure changes, implied volatility smiles, and the leverage effect, and provide a foundation for further research.
Notes
Terms \(d_1\) and \(d_2\) are not redefined, but rather taken from the BS model and must only be adjusted with the corresponding standard deviation \(\sigma _S\) and maturity \(T_1\).
Note that in the Geske (1979) model there is only a left wing of the smile observable. Therefore, we also use in this context the term “curve” instead of smile.
Note: If the gradient slope is positive for some points, we only consider the negative gradient slopes in mo and consequently also adjust the size of mo.
For increased readability, we only refer to level, slope, and curvature, omit H1, H2, and H3 and only speak of three hypotheses.
References
Aït-Sahalia, Y., Fan, J., & Lic, Y. (2013). The leverage effect puzzle: Disentangling sources of bias at high-frequency. Journal of Financial Economics, 109(1), 224–249.
Bancel, F., & Mittoo, U. (2004). Why do European firms issue convertible debt? Financial Management, 10(2), 339–374.
Barone-Adesi, G., & Whaley, R. E. (1987). Efficient analytic approximation of American options values. The Journal of Finance, 42(2), 301–320.
Beckers, S. (1980). The constant elasticity of variance model and its implications for option pricing. The Journal of Finance, 35(3), 661–673.
Bekaert, G., & Wu, G. (2000). Asymmetric volatility and risk in equity markets. The Review of Financial Studies, 13(1), 1–42.
Black, F. (1976). Studies of stock price volatility changes. In Proceedings of the 1976 meetings of the American Statistical Association, business and economics statistics section (pp. 177–181).
Black, F., & Cox, J. C. (1976). Valuing corporate securities: Some effects of bond indenture provisions. The Journal of Finance, 31(2), 351–367.
Black, F., & Scholes, M. (1973). The pricing of options and corporate liabilities. The Journal of Political Economy, 81(3), 637–654.
Bollen, K. A., & Jackmann, R. W. (1990). Regression diagnostics: An expository treatment of outliers and influential cases. In J. Fox & J. Scott Long (Eds.), Modern Methods of Data Analysis (pp. 257–291). CA: Newbury Park.
Bollen, N. P. B., & Whaley, R. E. (2004). Does net buying pressure affect the shape of implied volatility functions? The Journal of Finance, 59(2), 711–753.
Bollerslev, T., Litvinova, J., & Tauchen, G. (2006). Leverage and volatility feedback effects in high-frequency data. Journal of Financial Econometrics, 4(3), 353–384.
Branger, N., & Schlag, C. (2004). Why is the index smile so steep? Review of Finance, 8(1), 109–127.
Briys, E., & de Varenne, F. (1997). Valuing risky fixed rate debt: An extension. Journal of Financial and Quantitative Analysis, 32(2), 239–248.
Campbell, J. Y., & Hentschel, L. (1992). No news is good news: An asymmetric model of changing volatility in stock returns. Journal of Financial Economics, 31(3), 281–318.
Chen, R. R., & He, W. (2015). The valuation of compound options: A correction and an extension. The Journal of Derivatives, 22(4), 92–104.
Choi, J., & Richardson, M. (2016). The volatility of a firm’s assets and the leverage effect. Journal of Financial Economics, 121(2), 254–277.
Christie, A. A. (1982). The stochastic behaviour of common stock variances: Value, leverage, and interest rate effects. Journal of Financial Economics, 10(4), 407–432.
Ciliberti, S., Bouchaud, J.-P., & Potters, M. (2009). Smile dynamics: A theory of the implied leverage effect. Wilmott Journal, 1(2), 87–94.
Cook, R. D. (1977). Detection of influential observation in linear regression. Technometrics, 19(1), 15–18.
Cook, R. D. (1979). Influential observations in linear regression. Journal of the American Statistical Association, 74(365), 169–174.
Cox, J. C., & Ross, S. A. (1976). The valuation of options for alternative stochastic processes. Journal of Financial Economics, 3(1–2), 145–166.
Dann, L. Y. (1981). Common stock repurchases—an analysis of returns to bondholders and stockholders. Journal of Financial Economics, 9, 113–138.
Donders, M. M., & Vorst, T. C. F. (1996). The impact of firm specific news on implied volatilities. Journal of Banking and Finance, 20(9), 1447–1461.
Duffee, G. R. (1995). Stock returns and volatility—a firm-level analysis. Journal of Financial Economics, 37(3), 399–420.
Ericsson, J., & Reneby, J. (2005). Estimating structural bond pricing models. The Journal of Business, 78(2), 707–735.
Fama, E. F. (1970). Efficient capital markets: A review of theory and empirical work. The Journal of Finance, 25(2), 383–417.
Fama, E. F. (1991). Efficient capital markets II. The Journal of Finance, 46(5), 1575–1617.
Figlewski, S., & Wang, X. (2000). Is the “leverage effect” a leverage effect?. Technical report, NYU Stern School of Business and City University of Hong Kong.
French, K. R., Schwert, G. W., & Stambaugh, R. F. (1987). Expected stock return and volatility. Journal of Financial Economics, 19(1), 3–29.
Gemmill, G. (1992). Political risk and market efficiency: Tests based in British stock and options markets in the 1987 election. Journal of Banking and Finance, 16(1), 211–231.
Geske, R. (1979). The valuation of compound options. Journal of Financial Economics, 7(1), 63–81.
Geske, R., Subrahmanyam, A., & Zhou, Y. (2016). Capital structure effects on the prices of equity call options. Journal of Financial Economics, 121(2), 231–253.
Goncalves, S., & Guidolin, M. (2006). Predictable dynamics in the S&P500 index options volatility surface. The Journal of Business, 79(3), 1591–1635.
Hafner, R., & Wallmeier, M. (2001). The dynamics of DAX implied volatilities. International Quarterly Journal of Finance, 1, 1–27.
Hazewinkel, M. (1987). Encyclopaedia of mathematics volume 1 A-B. Dordrecht: Kluwer Academic Publishers.
Hull, J. C. (2017). Options, futures, and other derivatives (9th ed.). London: Pearson Education Limited.
Hull, J. C., Nelken, I., & White, A. D. (2004). Merton’s model, credit risk, and volatility skews. Journal of Credit Risk, 1(1), 1–27.
Janjigian, V. (1987). The leverage changing consequences of convertible debt financing. Financial Management, 16(3), 15–21.
Jayaraman, N., & Shastri, K. (1993). The effects of the announcements of dividend increases on stock return volatility: the evidence from the options market. Journal of Business Finance and Accounting, 20(5), 673–685.
Lajeri-Chaherli, F. (2002). A note on the valuation of compound options. The Journal of Futures Markets, 22(11), 1103–1115.
Leland, H. E., & Toft, K. (1996). Optimal capital structure, endogenous bankruptcy, and the term structure of credit spreads. The Journal of Finance, 51(3), 987–1019.
Longstaff, F. A., & Schwartz, E. S. (1995). A simple approach to valuing risky fixed and floating rate debt. The Journal of Finance, 50(3), 789–819.
Masset, P., & Wallmeier, M. (2010). A high-frequency investigation of the interaction between volatility and DAX returns. European Financial Management, 16(3), 327–344.
Masulis, R. W. (1980). The effects of capital structure change on security prices: A study of exchange offers. Journal of Financial Economics, 8(2), 139–177.
Mayers, D. (1998). Why firms issue convertible bonds: The matching of financial and real investment options. Journal of Financial Economics, 47(1), 83–102.
Merton, R. C. (1974). On the pricing of corporate debt: The risk structure of interest rates. The Journal of Finance, 29(2), 449–470.
Patell, J. M., & Wolfson, M. A. (1979). Anticipated information releases reflected in call option prices. Journal of Accounting and Economics, 1(2), 117–140.
Pẽna, I., Rubio, G., & Serna, G. (1999). Why do we smile? On the determinants of the implied volatility function. Journal of Banking and Finance, 23(8), 1151–1179.
Pindyck, R. S. (1984). Risk, inflation, and the stock market. The American Economic Review, 74(3), 334–351.
Rathgeber, A. W., Stadler, J., & Ulze, M. (2020). No country for old distributions? Working Paper, University of Augsburg.
Schader, M., & Schmid, F. (1989). Two rules of thumb for the approximation of the binomial distribution by the normal distribution. The American Statistician, 43(1), 23–24.
Schwert, G. W. (1989). Why does stock market volatility change over time? The Journal of Finance, 44(5), 1115–1153.
Sheikh, A. M. (1989). Stock splits, volatility increases, and implied volatilities. The Journal of Finance, 44(5), 1361–1372.
Stein, J. C. (1992). Convertible bonds as “back door” equity financing. Journal of Financial Economics, 32(2), 3–21.
Svensson, L. E. O. (1994). Estimating and interpreting forward interest rates: Sweden 1992–1994. NBER Working Paper Series, 4871.
Toft, K. B., & Prucyk, B. (1997). Options on leveraged equity: Theory and empirical tests. The Journal of Finance, 52(3), 1151–1180.
Wallmeier, M. (2015). Smile in motion: An intraday analysis of asymmetric implied volatility. Algorithmic Finance, 4(1–2), 89–104.
Wang, C. D., & Mykland, P. A. (2014). The estimation of the leverage effect with high-frequency data. Journal of the American Statistical Association, 109(505), 197–215.
Weisstein, E. C. (2002). CRC concise encyclopedia of mathematics (2nd ed.). Boca Raton: Chapman & Hall/CRC Press.
Wilcoxon, F. (1945). Individual comparisons by ranking methods. Biometrics Bulletin, 1(6), 80–83.
Wu, G. (2001). The determinants of asymmetric volatility. The Review of Financial Studies, 14(3), 837–859.
Funding
Open Access funding provided by Projekt DEAL.
Author information
Authors and Affiliations
Corresponding author
Additional information
Publisher's Note
Springer Nature remains neutral with regard to jurisdictional claims in published maps and institutional affiliations.
The authors would like to thank Henning J. Fock for his previous work, for the very helpful advice and discussions on this topic. Furthermore, we thank Deutsche Gesellschaft für Ad-hoc-Publizität mbH for providing us with the ad-hoc news from 1999 to 2014.
Appendices
Appendix A
By using \(\sigma ^{imp}=IMP(C^{BS}, S, K, r, T_1)\) we differentiate the implied volatility function with respect to M. Applying the rules for differentiation of inverse functions as well as for differentiation of implicit functions,
After applying several times the chain rule, it holds that
with
Finally, it follows that
Both factors are positive: the first factor by definition of \(e^{-rT_2}\) and \(\nu _S\), and the second factor by the fact that the joint probability \(N_2\) is always smaller than the product of the marginal probabilities for positive correlation \(\rho _G=\frac{\sqrt{T_1}}{\sqrt{T_2}}\) and \(N_1(h_{1-}) <N_1(d_1)\).
Appendix B
Using again that \(\sigma ^{imp}\) is a function of IMP with \(\sigma ^{imp}=IMP(C^{BS}, S, K, r, T_1)\), it holds that
and
It follows that
In case of the BS model, \(C^G\) is substituted by \(C^{BS}\), leading to the well-known and discussed \(\frac{\partial \sigma ^{imp}}{\partial K}=0\). Otherwise, the derivatives are
For the latter, see Geske (1979), page 72 formula (15); the first can be derived analogously to other Greeks of the BS model. Hence, it follows that
The slope’s sign depends only on the sign of the numerator, because the exponential function and \(\nu _S\) are strictly positive. If \(d_2<h_{1-}\), the numerator is negative, and vice versa.
Inserting the variables leads to
because of the convexity of S(V)
and
the left-hand side is always larger than the right-hand side. Consequently the slope is always negative. Note that \(\Delta _V\) (\(\partial S/ \partial V=N_1(h_{2+})\)) represents the stocks delta with respect to the value of the assets.
Appendix C
To evaluate \(\frac{\partial ^2 \sigma ^{imp}}{\partial K \partial M}\), we apply the theorem of Schwarz for continuously differentiable functions \(\left( \frac{\partial ^2 \sigma ^{imp}}{\partial K \partial M}=\frac{\partial ^2 \sigma ^{imp}}{\partial M \partial K}\right) \) and Eq. A.2
With the help of the partial derivations of \(\frac{\partial C^{G}}{\partial M}\), \(\frac{\partial S}{\partial M}\), and \(\frac{\partial C^{BS}}{\partial S }\) as given above and
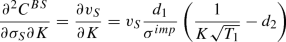

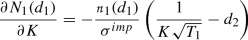
it follows that
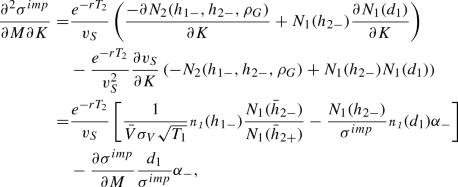
where
For beginning analysis of the effects it is most suitable to concentrate on the first two lines. \(v_s\), \(e^{-rT_2}\), and \(\partial v_S /\partial K\) are positive by definition. Note that although \(\sigma ^{imp}\) decreases with increasing K, the sensitivity is positive. Altogether with insights from Eq. A.7 the minuend (always positive) is always smaller than the subtrahend (always positive). Finally, we have a negative sign, which means a more negative slope when the leverage ratio L resp. debt M rises.
Appendix D
We start with the already derived result from Eq. B.6 and differentiate with respect to K, leading to
Again, we analyse the three derivatives
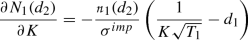
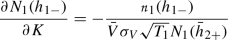
and \(\frac{\partial \nu _S}{\partial K}\) as given above. Inserting the interim results in Eq. D.1 yields

with
Effects can be analysed best in Eq. D.1. Again, \(v_S\), \(e^{-rT_1}\), and \(\partial v_S /\partial K\) are positive by definition and \(\left( N_1(d_2) -N_1(h_{1-})\right) \) is negative as reasoned above. The numerator is always positive as the subtrahend (always negative) is always smaller than the minuend (always negative). Therefore, the overall effect is always positive and the function is convex.
Appendix E
This section briefly describes the validity of our theoretical model for the put option in the compound option model. The price of the put option \(P^{G}\) on S in the compound option model is given according to Hull (2017) by
The implied volatility \(\sigma ^{imp}\) of \(P^G\) is an implicit function IMP with respect to the put option \(P^{BS}\) of the BS model by \(\sigma ^{imp}=IMP(P^{BS}, S, K, r, T_1) \).
Hypothesis (H1)
For the impact of changes in ratio L on the implied volatility smile it holds for the put case
After applying the same rules as for the call option, the corresponding partial derivatives and the properties of the (bivariate) normal standard distribution \(N_1(h_{2-})= N_2(-h_{1-}, h_{2-}, -\rho _G)+N_2(h_{1-}, h_{2-}, \rho _G)\), we receive the result as for the call option
Hypothesis (H2)
For the effect of the leverage on the slope of the implied volatility for put options, we modify the theoretical model as follows
whereby
In case of the BS model, \(P^G\) is substituted by \(P^{BS}\) leading of course to the well-known and discussed \(\frac{\partial \sigma ^{imp}}{\partial K}=0\). Otherwise, with the help of \(\frac{\partial P^{BS}}{\partial K} =e^{-r T_1 }N_1(-d_2)\) and \(\frac{\partial P^{G}}{\partial K} =e^{-r T_1 }N_1(-h_{1-})\)
which is exactly the same result as for call option.
To evaluate \(\frac{\partial ^2 \sigma ^{imp}}{\partial K \partial M}\) for the put option case, we apply again the theorem of Schwarz \(\left( \frac{\partial ^2 \sigma ^{imp}}{\partial K \partial M}=\frac{\partial ^2 \sigma ^{imp}}{\partial M \partial K}\right) \) and the first line of Eq. E.3
Based on the partial derivatives \(\frac{\partial P^{G}}{\partial M}\), \(\frac{\partial S}{\partial M}\), \(\frac{\partial P^{BS}}{\partial S }\) and again the help of \(N_1(h_{2-})= N_2(-h_{1-}, h_{2-}, -\rho _G)+N_2(h_{1-}, h_{2-}, \rho _G)\) (see also E.3), it finally holds
which is exactly the same result as for the call option.
Hypothesis (H3)
For the first part of the third hypothesis for put options we can refer to B.6 and E.6 and therefore, the results from D.1 to D.4 are also valid. In line with the approach for the call option and the theorem of Schwarz, we use \(\left( \frac{\partial ^3 \sigma ^{imp}}{\partial K^2 \partial M}=\frac{\partial ^3 \sigma ^{imp}}{ \partial M\partial K^2}\right) \) again and differentiate Eq. (E.7) with respect to K
In line with the results for the call option case, this derivative depends again on several effects, whereby a grid search reveals that the overall effect is positive and confirms that a higher leverage leads to a more convex volatility curve.
Appendix F
Looking at the Constant Elasticity Model (CEV) for option prices there is the general formulation, if the stock price follows a CEV diffusion (Cox and Ross 1976). However, our goal was to introduce a general pathway how to transform our theoretical results derived with the compound option model also to CEV. Consequently, we build on the more traceable absolute value model of Cox and Ross (1976), in the version of Beckers (1980). In this version the call option price is defined by
whereby
To make our general formulas applicable, we need to derive the derivatives of \(C^{CEV}\) with respect to the leverage as well as to the strike price K. Whereas the latter is included in the formulas, the dependency to the leverage is not part of the CEV model. Hence, we rely on Beckers (1980) and assume that solely the volatility \(\sigma \) is driven by the leverage L
This assumption is straight forward. In addition, we assume
However, this assumption is debatable and not part of Beckers (1980). Consequently we set this term equal to zero. In the first step we make some preliminary calculations:
The second step is to calculate the derivatives of the option price with respect to \(\sigma \), S and K. The derivative of \( C^{CEV}\) with respect to \(\sigma \) reads as follows
Therefore, it holds
The latter is true, because the standard normal density is axial symmetric around the ordinate including a maximum at 0. With \(\left| y_1 \right| <\left| y_2\right| \) the inequality is straight forward.
The derivative of \( C^{CEV}\) with respect to K reads as follows:
Therefore,
The latter is true because \(y_2<y_1\).
For changes in the leverage L we derive
For the change in the implied volatility function
the result is depending on the sign of \(d_1\). For negative \(d_1\) the result is positive which is in contrast to the result derived by the compound option model.
For the change in the implied volatility function
the result is depending on the sign of \(d_1\). For negative \(d_1\) the result is positive which is in line with the result derived by the compound option model.
Alternatively, we assume a negative relationship between the stock price and the leverage. Therefore, we assume
The derivative of \( C^{CEV}\) with respect to S reads as follows
with \(\frac{\partial y_1}{\partial S}=\frac{1}{v_e}\) and \(\frac{\partial y_2}{\partial S} =-\frac{1}{v_e}\). Therefore, it holds
For changes in the leverage L we derive
Altogether, we cannot draw a final conclusion in this case, because we do not exactly know which term is dominant.
Rights and permissions
Open Access This article is licensed under a Creative Commons Attribution 4.0 International License, which permits use, sharing, adaptation, distribution and reproduction in any medium or format, as long as you give appropriate credit to the original author(s) and the source, provide a link to the Creative Commons licence, and indicate if changes were made. The images or other third party material in this article are included in the article’s Creative Commons licence, unless indicated otherwise in a credit line to the material. If material is not included in the article’s Creative Commons licence and your intended use is not permitted by statutory regulation or exceeds the permitted use, you will need to obtain permission directly from the copyright holder. To view a copy of this licence, visit http://creativecommons.org/licenses/by/4.0/.
About this article

Cite this article
Rathgeber, A.W., Stadler, J. & Stöckl, S. The impact of the leverage effect on the implied volatility smile: evidence for the German option market. Rev Deriv Res 24, 95–133 (2021). https://doi.org/10.1007/s11147-020-09171-3
Published:
Issue Date:
DOI: https://doi.org/10.1007/s11147-020-09171-3