
Abstract
Separating urban land and structure values is important for national accounts and for analysis of real estate risk over time. A large part of the literature on urban land valuation uses the land residual method, which relies on the assumption that structures are easily replaced. But urban land value depends on accessibility to nearby land uses, implying that infrastructure and the slowly changing built environment are the most important components of land value. Investments in structures are only slowly reversible, implying that land and structure function as a bundled good whereas land residual theory severs the connection between land value and structure value over time. We develop a simple theoretical model that includes option value and compare to a nested land residual model before and after a shock to values. Cross-sectionally our model shows that land residual theory overestimates structure value. Over time almost all of any change in property value is allocated to land residuals. Data from Maricopa county, AZ, 2012–2018 strongly support option value models when nested within a general model that also includes land residuals. FHFA estimates use entirely different cost estimation methods: our analysis of FHA data suggest that our conclusions generalize to the U.S. as a whole, and that high and rising land value ratios over 50 years (the “hockey stick” pattern found in the literature) are likely an artifact of the residual model.
Introduction
This paper proposes new methods for valuing urban land which we define as land in urban areas where substantial usable structures are present on the land. We use the terms “land” and “urban land” to refer to land under a substantial usable structure. We use the term “vacant land” for urban land with small structures, parking lots, raw land without improvements or land in some stage of preparation for construction. We always use the “vacant” qualifier if we refer to this less common type of urban land.
The value of urban land as separated from the value of structures is highly relevant to the dynamics and volatility of commercial and residential real estate. This was highlighted recently by Knoll et al. (2017): “We show that real house prices stayed constant from the nineteenth to the mid-twentieth century, but rose strongly and with substantial cross-country variation in the second half of the twentieth century. Land prices, not replacement costs, are the key to understanding the trajectory of house prices. Rising land prices explain about 80 percent of the global house price boom that has taken place since World War II. Our findings have implications for the evolution of wealth-to-income ratios, the growth effects of agglomeration, and the price elasticity of housing supply.” Knoll et al. (2017) use an influential land valuation method, the land residual model which assumes that land value and structure value are additively separable (i.e., each component of total value may evolve independently of the other) and that structure value can be estimated from the cost to rebuild the structure less depreciation due to aging.Footnote 1
We think that it is implausible that the value of urban land can evolve independently of the value of structures because urban land value depends on accessibility to nearby land uses, implying that infrastructure and the slowly changing built environment are the most important components of land value. Think of a (future) urban area composed of raw land which has no roads, utilities or structure. The value of this raw land will be very low; it might plausibly be traded for a few trinkets and some cloth.Footnote 2 After substantial capital investment in infrastructure and surrounding structures the same parcel of vacant land will have value based on the potential for a structure that is well suited to surrounding structures and land uses. In the event that the parcel already has a structure – likely since urban land is typically densely developed – then its value will be based on the existing structure and on its potential for substantial renovation or redevelopment to better match the surrounding built environment. These considerations mitigate a framework designed to separate the dynamics of land and structure.Footnote 3
The residual land value method developed by real estate appraisers was popularized in the academic literature by Davis and Palumbo (2008). The land residual method has been applied and developed by an extensive literature discussed below and recently extended to geographies as small as zip codes by Davis et al. (2019). The literature includes contributions by Diewert et al. (2011) and by Landefeld and Hines (1985) who discuss the National Income and Product Accounts (NIPA) treatment of land value. The land leverage hypothesis which holds that the risk inherent in real estate is an increasing function of the ratio of land value to total value (hereafter, “land value ratio” or “land share”) uses land residual methods: see Bostic et al. (2007) and Bourassa et al. (2011). While academics have used the land residual approach for all properties, practitioners are typically quick to note that the cost approach is either not calculated at all or just not relied on for properties past a given age. In the real-world, adjustments are often needed to reconcile costs, sales comparisons, and income valuation approaches, all of which may lead to disparate estimates of property and land valuations. We develop a framework for better land valuation practices.
Our alternative land valuation methods are based on irreversibility and option value theory. The theory says that, once a structure is built, the structure and land become a bundled good for an extended period of time. For a typical real estate market where values are stable or changing by modest amounts, we show that the land value ratio estimated with option value theory changes much more slowly than the one estimated by the land residual theory. In a rising (falling) market the land residual method predicts that land value ratio will rise (fall) whereas option value methods predict no change except for the depreciation and obsolescence of structures in a rising market and the depreciation of structures in a falling market. We provide a simple model with numerical examples of these differences in a rising market.
In addition to modelling the disparate valuations of the land residual and option value theories, we empirically compare the two models using a new database provided by the Maricopa county, Arizona tax assessor to a group of researchers working with the Lincoln Institute of Land Policy. The data provide rich source of information on vacant land sales (2000–2018) and single family residential (SFR) sales (2007–2018) along with many characteristics of these sales and of all properties in Maricopa County.
Figure 1 motivates our study with Maricopa county data for quarterly SFR sales since 1995. The home price index, land price index (the “Lincoln land price index”) and land share are obtained from the Lincoln Institute of Land Policy website and Davis and Palumbo (2008). Land residual methods were used to produce Lincoln land indices and shares. For the purposes of this paper, we are most interested in the close association between the home price index and the land share index. This follows from the assumptions of the land residual model, which we illustrate by adding an annual construction cost index for Maricopa County. In the land residual method, structure value for any existing structure increases at the rate of construction costs less depreciation and obsolescence. In Maricopa County, construction costs have increased roughly linearly. Almost all of the differences between changes in house value and construction costs are allocated to land by the land residual method, and this is reflected in Fig. 1.

Home Price, Land Price, and Construction Cost Indexes (Left Axis), and Land Share (Right Axis)
Figure 2 plots the Lincoln land price index (annualized) since 2000 in order to compare to an index we produced based on Maricopa County vacant land sales and Phoenix house prices estimated by the FHFA. All three indices use SFR sales data or sales of land zoned SFR. In general, we observe the expected positive correlation between house prices and the two land price indices. In the case of the Lincoln index this follows from the assumption that most of the variation in house prices is transferred to land value. In the case of the vacant land index this follows from the fact that urban land has little value except for its potential to be developed with a structure, i.e., vacant land value derives from the value of the structure. Option value theory applied to vacant land says that the option value component of vacant land is leveraged by the relatively constant cost to build, implying that the timing of land value changes will follow those of SFR values, but that land will have higher volatility. This is what we observe in Fig. 2, strengthening our belief that option value theory is relevant to urban land valuation.Footnote 4

House Price and Land Price Indexes Notes: We calculated the Vacant Land Price Index for Market 5. The Lincoln Home and Land Price Indices were distributed by the Lincoln Institute of Land Policy (ending in 2016) using AVM and land residual methods developed by Davis and Palumbo (2008). The FHFA House Price Index is available by MSA for most of the US. The Phoenix Construction Cost Index is calculated by the authors from Marshal Valuation Service Manuals The FHFA index is for the Phoenix-Mesa-Chandler Metropolitan Statistical Area (MSA). Similarly, the Lincoln Land Price Index is also at the MSA level. Maricopa County, which had a population of 4.5 million in 2010, is a subset of the Phoenix MSA. The other major county in the Phoenix MSA is Pinal County, which had a population of 376,000 in 2010, and most of the area in Pinal is very rural. Therefore, Maricopa County is a reasonably close approximation to Phoenix. In Fig. 2, the Lincoln price index is relatively volatile and peaks early compared to vacant land transactions
The Lincoln land price index is more volatile than the vacant land price index with a difference between trough and peak of about 3.0 versus about 2.5 for the vacant price index. The timing of the Lincoln index is not as well matched with the SFR index. These observations cast some doubt on land residual estimates and on associated land leverage risk evaluation, motivating research on alternative estimates based on option theory.
In our empirical analysis, we focus on data from Maricopa county, AZ during a time period of appreciation (2012–2018) to estimate land values with both the land residual and option value approaches. We find that the marginal structure value per square foot is undervalued by land residual estimates. These marginal effects support predictions from option value theory, as represented by our simple theoretical model of option value in a rising market. We also directly demonstrate the strength of the option value approach by revealing empirically that land shares for high option value neighborhoods, where vacant land sales are more relevant, increased by about 11% over six years compared to nearly 24% under land residual assumptions. These findings are consistent with the evolution of vacant land prices that we observe in Fig. 2. Option value also requires that the neighborhoods classified as existing with deep out of the money options – neighborhoods typical of a large share of urban real estate – demonstrate low growth in the land ratio (about 2% over six years) due to depreciation only.
The rest of this paper is focused on comparing the land residual method with methods based on irreversibility, the main assumption of option value theory as applied to estimating urban land values. The next section surveys literature, followed by our theory and methods for land valuation. We then describe the data, followed by our empirical results which we compare with FHFA estimates using a land residual method, but with a very different source for depreciated cost to replace the structure. Finally, we offer some concluding remarks.
Literature Review
The values of land and improvements have been historically challenging to disentangle. One contribution of our work is that we set up a framework for practitioners who want to estimate land values under the assumption of irreversibility. One of our key empirical findings is that irreversibility is an important factor for estimating land values for most parcels, even for those with structures that have been built within the past 15 years.
The challenges for separating urban land and structure values have evoked a rich literature on the topic. The existing literature on land values tends to focus on at least 3 approaches to estimating land values. The first of these that we review below include “residual” land value methods, where land values are equal to the residual between house values and construction costs. The second approach relies on vacant land sales as providing values comparable to land under structures. A third approach consists of a set of automated valuation methods (AVM), where econometric models are used to derive land value estimates. Some of these AVM models focus on hedonic land value models, while others use hedonic housing value models to extract the value of house characteristics and then derive location values.
One advantage of the residual land value approach is computational ease, and this is likely one reason why some of the most comprehensive land value indexes (i.e, Davis et al., 2019) rely on this approach. In general, there are available data on residential construction costs, and there is some guidance in the appraisal literature on reasonable assumptions on depreciation rates over time. Using the construction costs data, it is possible to estimate the replacement costs of an existing house. But when a house is not a new construction property, the value of the structure is typically not equal to the replacement cost of building a new house, because of depreciation coupled with changes in property value since construction. The logic of the land residual method requires adjustments for construction costs for depreciation to estimate structure value. After obtaining the estimated structure value, land value is obtained as the residual between the sale value and the replacement cost net of depreciation.
The land residual method is widely accepted and also has been applied in several settings. For instance, Landefeld and Hines (1985) demonstrate the use of this approach in the National Income and Product Accounts (NIPA), with respect to natural resources. Specifically, the “natural resource component of the total value of oil and gas reserves is obtained by subtracting the current replacement cost value of oil and gas producers’ net stock of physical capital from the total value of oil and gas reserves.” (Landefeld & Hines, 1985). The land residual method is also used in land value indices that are published by the Lincoln Institute of Land Policy (see Davis & Palumbo, 2008), as described in more detail below. Diewert et al. (2011) apply a variation of the residual approach to a Dutch house price index, along with a parametric approach, to disentangle land and improvement values. Clearly the land residual method has a long history of applications, which motivates our analysis.
The Davis et al. (2019) residual land value method can be traced back in the academic literature to Davis and Heathcote (2007), who use vacant land data to obtain a nation-wide land price index for the U.S. Later work by Davis and Palumbo (2008) relies heavily upon the residual land value approach in their development of a land price index, which varies by MSA and time (at the quarterly frequency), reaching back to 1975. In a more recent paper, Davis et al. (2019) use the residual land value method to develop a land price index at the zip code level as well as at the census tract level, covering the entire U.S. This index is the most comprehensive-known land price index to date.
Knoll et al. (2017) use the residual land value method to study historical land values for 14 different countries, going back to the late 1800s in some cases. For the U.S., they find that in the roughly 60-year period following World War II, land values account for approximately 80% of the house price appreciation, on average: i.e., land’s share of value has increased substantially since 1950 and this generalizes to most countries. We will show that these conclusions are an artifact of the land residual model: variation in house value is forced into land value.
An alternative to the residual land value approach is using vacant land sales. Haughwout et al. (2008) focus on vacant land in order to come up with estimates of land value for New York City. Barr et al. (2018) produce a land price index for Manhattan, for the period 1950–2014, using vacant land sales. At a more aggregate level, these studies differ from some of the others in their focus on New York City, where the sheer magnitude of the size of the city (and the associated large number of land parcels) lends itself to analysis based on vacant land sale comparables. But one potential drawback of the New York City data is that a high-density setting has relatively few vacant parcels. There also can be a sample selection concern because those vacant parcels that do sell tend to be in the most desirable locations within the city. Albouy et al. (2018) develop the land value estimates for MSAs in the United States, using vacant land sales estimates. A similar vacant parcel scarcity concern holds for the Albouy et al. (2018) dataset. Where vacant land estimates are available at the MSA level, this approach can be feasible, although one potential limitation can be obtaining reliable data on changes in the vacant land over time.
One way to potentially circumvent some of the sparse vacant parcel concerns in dense settings is to consider teardowns, where the improvement on an existing parcel is destroyed and then the parcel is redeveloped. Dye and McMillen (2007) have leveraged data on teardowns in Chicago to develop land value estimates. When there are properties that are designated to be torn down, one can derive a land value from the sale price of the parcel, net of the cost of tearing down the existing structure. While this enables the researcher to enhance the sample size compared with the scenario of only considering vacant parcels, there is still a potential sample selection problem in that the desirable locations (near transit and city centers, as found by Dye & McMillen, 2007) may have properties that are more likely to be sold, torn down, and ultimately redeveloped. Helms (2003) considers Chicago neighborhoods between 1995 and 2000, using a dataset of all residential renovations during this period. Helms finds that the neighborhood characteristics and structure characteristics are the two most important explanatory variables for determining the likelihood of a property being torn down. Munneke and Womack (2020) find teardowns are concentrated in space and time, as well as further evidence that the land on which teardowns are located is the primary motivating factor for buyers of these types of properties. Dye and McMillen (2007) control for selection bias in their analysis, but the form of sample selection is due to their use of teardown permits as proxies for redevelopment, which may not always be the only sample selection issue that is present in the data. They use a Heckman procedure to estimate a probit model to correct for this sample selection issue and then they calculate the land value as the projection of the sale price of the teardown on the teardown indicator variable. Their analysis differs from other teardown research in that they use the hedonic characteristics of the teardown properties in their estimations. With their model they include year fixed effects for the years 1996 through 2002, which implies the possibility of generating distinct land values for each of these periods through out-of-sample estimations.
In some sense, the residual land value approach can be thought of as a special case of the teardown approach, where the teardown cost is assumed to equal zero. On the other hand, the residual land value approach may be more flexible because it can be applied to a broader set of properties than those that are merely slated to have their improvements demolished. In addition to the larger sample size, the issue of sample selection is less of a concern with the residual land value approach.
The third general method of land valuation is AVMs. There are several strands of literature that focus on AVMs. One of these relies on the notion that land value equals the difference between house value and the value of structural characteristics. Cohen et al. (2017), and Clapp (2003), employ variants of this approach. Cohen et al. (2017) focus on sales of single-family homes in Denver Colorado, over an approximately 20-year period from the 1990s to 2013. Their approach is sometimes referred to as a local polynomial regression (LPR) approach, as in Clapp (2003). It relies on the assumption that the entire property value equals the sum of the values of the structural characteristics and the value of land.
This AVM literature, as in Cohen et al. (2017) and Clapp (2003), relies on hedonic house value estimations as one step in generating the land value estimates. One potential concern is that this approach uses shadow prices for characteristics, in which case the mean of the omitted location variables (as well as mis-specification errors) is forced into the constant term. While these techniques are assuming the shadow-prices are average price of characteristics, they are really the marginal price. This could lead to biased land value estimates.
The land leverage literature is an important related literature to the residual value literature. Land leverage is sometimes referred to as the land use intensity, and it has been measured as the ratio of land value to total parcel value, as described by Bourassa et al. (2011). An important aspect of the land leverage hypothesis is that the riskiness of real estate is an increasing function of the ratio of land value to total property value. In addition to Bourassa et al. (2011), many other land leverage studies use the land residual method to find the land value ratio.
A related AVM approach relies on hedonic regressions of vacant land prices, which control for the characteristics of the land. In this regard, Sirmans and Slade (2012) develop a set of land price indexes for residential, commercial, and industrial properties, and an overall index in the U.S., using hedonic models with data on land sales and characteristics in 20 MSAs from 1990 to 2009. Nichols et al. (2013) develop indexes for 23 MSAs using the hedonic regression approach. They find that in some cities (especially coastal cities and in Nevada), there is much more volatility than in other parts of the U.S. This might be due to the fact that vacant land has a large option value component. Option values are levered by the cost to build (the strike price); this implies high volatility -- as the value of the underlying asset (the new structure) changes, the value of the option changes at a rate magnified by leverage. Levered volatility in the land market is like options on stock, which are typically much more volatile than the underlying security. The idea that land value can evolve separately from structure is implausible from an options value perspective. Bostic et al. (2007), and the entire land leverage literature, derive high volatility from the assumption that the structure is valued at the depreciated replacement cost and as such evolves separately from land value.
Several other papers use the land leverage hypothesis. One of these, Davis et al. (2017), develop land value estimates for the 18-year period of 2000–2017 in Washington, DC. They show that land value volatility was greatest in locations of the city where the land was valued lowest in 2000, the opposite of what the land leverage hypothesis would predict. Davis et al. (2017) note that pre-2006 the land values (relative to house values) rose the most in the lowest land value neighborhoods, while between 2006 and 2012 land values fell the most in those same neighborhoods. These low-value neighborhoods also tend to be the neighborhoods with the highest minority populations.
Another contribution to the land leverage literature is Bourassa et al. (2011), which focuses on single family houses in Switzerland sold between 1978 and 2008. They rely on hedonic models to develop land leverage and land values over time, and they use land ratio estimates to claim that land leverage is an important determinant of house price changes.
Our option value approach builds on the land residual method, which clearly holds at the time a new structure is built on vacant land. At that time, the value of the property is the cost of the land (including any utilities or other improvements) plus the cost to build the structure. Land leverage is measured by the ratio of land value to property value at the time of construction. As the structure ages, the land residual method assumes that property value equals land value plus depreciated cost to build a new structure whereas we develop an important role for irreversibility: land plus structure become bundled goods after construction. We will show that irreversibility has important implications for land valuation, even for properties with structures that are only 10 or 15 years old.
Theory and Methods
Urban land is approximated by dense development, with existing structures everywhere except the urban fringe. Our theory focuses on the vast majority of urban land which is not at the periphery and is not at the point of redevelopment, T∗: at T∗, the shadow price of vacant land has empirical content given by the following additive equation:
where Hiss the quantity of property services produced by combining optimal quantities of land L and structure S (assuming optimal intensity, S/L); P represents per unit prices as a function of the variable in parentheses. Note that P(H)H can be observed as a function of sales prices of new houses. Davis and Heathcote (2007), Davis and Palumbo (2008) and Davis et al. (2017) present a theoretical and empirical analyses of land and structure shadow prices P(L) and P(S) at T∗ where these values are given by the opportunity cost of bidding resources away from the next best use. Eq. (1) is their additive model at the redevelopment point (i.e., when the structure is built or rebuilt). Equation (1) has deep roots in the Alonso-Muth-Mills (AMM)Footnote 5 assumption that structures are rebuilt to optimal size whenever demand changes. We interpret Eq. (1) more narrowly as holding only for a new structure; it does not necessarily hold after.
The problem is that shadow pricing theory is widely acknowledged to break down as the structure ages. Consider the very common case: 0 < P(H)H < P(S)S, the cost of building a structure at optimal intensity is greater than the market value of land and structure. The option to redevelop is out of the money but the property has substantial use value, P(H)H determined by its accessibility to other urban land uses. Shadow pricing of the resources needed to build the structure does not accurately predict the value of the structure in this case. And it is incorrect to think that the value of land is zero in this case because accessibility (location) gives value to the existing property, land plus structure. The appraisal concept of “as if vacant” does not help predict values of L and S because vacant land is typically limited and at special locations. The built environment, given by history, determines values of L and S as explained next.
The land residual method deals with the problem of changes over time in demand and supply by assuming that structure can be valued at each point in time by subtracting depreciation from the cost to build a new structure with the same characteristics as the existing structure. That is, it substitutes the depreciated cost of S in Eq. (1):
where Sd is the depreciated structure cost. Equation (2) formalizes the land residual framework illustrated in Fig. 1: the value of the existing structure P(S)Sd decreases with depreciation but increases with construction costs which are typically rising over time. Rearrange Eq. (2) to see how the boom-and-bust cycle in house values is transferred to land value:
Computer Assisted Mass Assessment (CAMA) procedures for implementing the land residual method focus on estimating the depreciated cost new of each structure. We develop steps for this when we discuss data and results.
Land Value Derived from a Simple Options Model Footnote 6
Model Framework
Consider a fully built up inner suburban neighborhood with all neighborhoods around it fully built up, i.e., no vacant land within the urban area. Quantities of land, L and structure, S are measured in the same units (e.g., square feet). Each unit of housing (stock of housing, H) delivers one unit of services per time periodFootnote 7:
The ability of structure to produce housing services increases with L and S according to the non-negative parameters a, b. Land will be assumed fixed in our solutions.
Equation (4) avoids a problem with the more typical Cobb-Douglas production function: the implausible assumption of constant land share in the technical production process.Footnote 8 One observes flexible substitution in older suburban neighborhoods as well as in commercial real estate. Equation (5) delivers a plausible technical rate of substitution between land and structure in addition to solutions which avoid messy log transformations.
Rent per unit housing services H – and therefore, value per unit – declines with the amount of structure as demonstrated by empirical studies summarized by Munneke and Womack (2015):
Note that p is rent per unit intensity. The decline of rent per unit structure as structure size increases is increasing with c.
The value of this property, a quantity that might be inferred from observed sales prices is obtained by multiplying Eqs. (4) by (6) and dividing by r to obtain present value:
Here, r is the interest rate which is equal to the rate at which rental income is discounted. We simplify by assuming that rents and discount rates are unchanged into perpetuity: note that P(H) equals capitalized rent per unit housing.
The cost to build a unit of structure is some percentage, k of the value per unit intensity, and total costs increase with the amount of structureFootnote 9:
The cost to rebuild relative to the value of the property (land plus structure) increases with k, the fraction of per unit value required to build a unit of structure. If 0 < d < 1 then building costs per unit structure decline with structure size; this is expected for one- or two-story structures. If d > 1, then our model is relevant to larger structures that require increased structural strength and lifting building materials to higher levels (see Eriksen & Orlando, 2019). Moreover, d > 1 provides a simple way of capturing additional costs such as basements and detached garages that typically accompany larger houses. The model solution can be simplified with d = 1.
Equation (8) defines structure value according to land residual theory. We will show that the economic value of structure can differ radically from Eq. (8).
As if vacant land value
Land value as if vacant, the appraisal definition of urban land value with an existing structure, is derived from highest and best use (HBU) which is the structure size S∗ that will maximize the value of vacant land, V:
Here, asterisks (*) signify optimized values. This is the land residual value at the point of reconstruction: i.e., after the existing structure becomes valueless and it has been demolished. It is a hypothetical (“as if”) value because it is observed only at the point after the option to tear down has been exercised, i.e., after the existing structure is removed. We allow the removal to occur for several reasons such as a natural disaster prior to the optimal teardown time.
First and second order conditions for maximization:
Further normalization is obtained from: L = 1, a = 1, d = 1 which implies a simplified first order condition:
Land value is only observed for vacant land after demoliton or new construction, when Eq. (1) holds. This is the land value for all the properties in our hypothetical neighborhood. Other structure amounts (e.g., depreciated structures or those not at optimal intensity for historical reasons) do not change land value, only structure value.
If we have a set of parameters such first and second order conditions hold, then what happens when we change parameters, given that (10) and (11) must hold after the change?
-
1.
c and d are inversely related; c and k are inversely related.
-
2.
b and d are positively related given k; b and k are positively related given d.
-
3.
If c = 1, then the first derivative is negative over all S and there is no solution.
-
4.
If d is too small relative to c, then the cost term will go to zero faster than the structure productivity term \( \left(1-c\right)b\left(\frac{S^{\ast \left(-c\right)}}{L}\right) \) and there will be no solution.
The Option to Exchange the Existing Structure for a New One at S*
At this point we have a cross-sectional certainty model where structure quantity S is the only characteristic that varies across the neighborhood. How do we find the minimal sized structure such that it will be optimal to redevelop to S*? The solution is that the economic value of structure is zero when S is so small and/or depreciated (perhaps due to very high neighborhood property values that justify S* ≫ S) that property value given by Eq. (7) is equal to neighborhood land value given by Eq. (9): this is the NPV = 0 point of optimal redevelopment under certainty. An option exists because property owners could choose to delay exercise, perhaps because they don’t value rental income as much as implied by Eq. (6).Footnote 10 Our main point is that the economic value of structure differs significantly from reconstruction costs, Eq. (8) in the case where S* ≫ S > 0 and therefore economic land value V* differs from land residual value as will be illustrated next.
Numerical Solutions: Cross Sectional Solution
Table 1 presents numerical examples with as if vacant land value used to calculate the land value ratio: all values are a function of the amount of structure, S, which varies across the neighborhood. Time is fixed at the present moment.Footnote 11 Structure amounts can differ from the highest and best use (HBU, the solution to Eqs. (9)–(11)) for several reasons: 1) they were built at different times when HBU was different; 2) they were built at non-optimal levels due to personal preferences or financial constraints; 3) they were modified by natural disaster; or 4) physical depreciation and functional obsolescence. Our solutions can be related to models emphasizing depreciation by supposing that all S < S∗ are due to depreciation (physical wear and increased maintenance costs) and obsolescence (to be explained below).
The locations of all houses are identical and values are observed or anticipated at the present time, t = 0, so land value is the same for all houses regardless of the amount of depreciation: it is given at the HBU structure size, the solution to Eqs. (9)–(11). That is, land value is the property value at S∗ minus construction costs, the land residual value at S∗ (74.4 = 254.4–180). This is the simple model equivalent of Eq. (1).
When the structure is worthless the “teardown decision rule” discussed by Munneke and Womack (2015 and 2020) is relevant: here we ignore demolition costs to simplify the model. In Table 1 teardown occurs at structure amount 2 (S = 2) in the baseline example. We may observe neighborhood land values for S= 1 or 2 because the structure will optimally be rebuilt to S∗: if the property sells after teardown and before new construction, then we observe neighborhood land value which is equal to the “as if” land value. Likewise, if the property with a new HBU structure sells and we know construction costs, then neighborhood land value can be calculated with the land residual method, Eq. (1).
The cross-sectional equilibrium demonstrates that the land residuals are correct only at S∗. At any other S, they overstate the value of the structure in cross section: i.e., the land value ratio estimated by the land residual method is too small given the parameters in this example. This is because it ignores capital land substitution. If the structure is demolished for any reason the property will be rebuilt optimally to S∗ meaning that the economic value of the land and structure will be determined by Eqs. (9)–(11). The land residual method assumes that the economic value of the structure is construction costs less depreciation, which may be different than economic values based on optimal land and structure values S∗ and V∗.
The failure of the land residual method to account for economic value is especially problematic as structures approach the teardown level of depreciation. Consider a structure size S=4 when there is still a substantial structure but nearing teardown: in our numerical solutions the land residual method overstates the economic value of the structure by an order of magnitude. The correct land value ratio for this property is .8 whereas the residual method would estimate it at only 0.57 (=53.3/93.3).Footnote 12
Changes in Valuation as a Function of Model Parameters
A positive shock to valuation is represented in Table 1 by a decline in the cost of construction.Footnote 13 This means that the HBU structure amount and as if vacant land value are increased. Almost all the increase in valuation is optimally shared between structure and land because optimal structure size, increases with the positive shock as structure is substituted for land. The land value ratio after the shock is 0.28 versus 0.29 before.Footnote 14
After the unanticipated shock, the economic value of structures declines at every level of S. This is due to obsolescence, a point also made with simple examples by Longhofer (2018).Footnote 15 The new S∗=28 implies a structure value of 252 which is less than the overimproved structure cost before the shock. The increased land value ratios compared to baseline reflect this obsolescence and they are associated with increased redevelopment. All properties with S< 5 should be demolished and redeveloped to S∗= 28.
At this point it may appear that the predictions over time of the land residual model are correct – in fact, too conservative. For a 10% decline in construction costs, economic land value ratios increase by much more than 10%; e.g., from 0.29 to 0.38 at S=18 versus 0.29 to 0.36 for the residual method. This conclusion is incorrect because the calculations are cross-sectional: there is no model of the risk of changes over time. This motivates our use of an options model of risk.
Variations over Time from an Options Model of Risk
An option provides an instrument for controlling the risk of change over time. In Table 1, option value is introduced in a highly simplified way by assuming that there is some probability of a shock to construction costs, k expected at time t = 0 when HBU is S∗=22.Footnote 16 To keep the options model simple, assume that there will be no change or that the change will be k declines to 0.45, i.e., the change in k discussed above is now reinterpreted; it is anticipated with probability equal to 0.5 in Table 1.
The next to last column of Table 1 illustrates the land value ratio that will hold with the option valuation of random shocks. Because the option model anticipates the possibility of the shock, the fact that it occurs does not influence valuation for most properties. The value of the option is added to baseline land value at t = 0 (before the shock). The amount of value added is negligible for S>8 because these properties are far from tear down, meaning that they have little option value.Footnote 17 The probability of a shock of 10% at t = 0 is not relevant to most structures, only to those near teardown. Whether or not the shock occurs is not relevant either: randomness has already been considered in the option component of land value.
Consider a boom or a bust market. The land residual model allocates all changes to land value for given construction costs and for a structure with a known amount of depreciation. Options models (full models such as Eqs. (4) and (5) in Appendix 1) contain expectations for changes in values over time and for the risk that these values will be shocked: these are drift and variance model parameters. Any change from year-to-year will have been modeled, so it will have limited effects on land values.
In this general case, the ratio between the value of the redeveloped property and the cost to build (the teardown ratio) determines the amount of option value. With upward trending prices, this ratio gets larger and obsolescence increases for properties near teardown until the existing structure has no value.Footnote 18 Empirical evidence presented by Munneke and Womack (2020) for Miami Florida in the years 1999–2002 shows that only about 38% of sales had any option value, and much of this was concentrated in the top decile of the teardown ratio.Footnote 19 This implies that, except for less than 10% of properties, the land residual model gives incorrect predictions about the evolution of land value over time (and for properties beyond a certain age, practitioners tend not to rely on the land residual approach, despite its prevalence among academics).Footnote 20
Application of the simple option valuation model requires measuring property values and economic structure values; the latter are a function of HBU land and HBU structure value in the neighborhood, adjusted for depreciation and obsolescence. Here we outline some practical methods for implementing structure and land valuation:
-
Appraisers and tax assessors need to go back to a time when the subject property, or similar properties in the same or similar neighborhoods, were newly constructed. These comparable sales measure the land ratio applicable to houses near the HBU condition. Ahlfeldt and McMillen (2020) show how this is done with sales of the land followed within a few years by sales of the land plus structure.
-
Since most owners maintain their property in nearly their original condition, economic depreciation is a function of obsolescence. For example, the house is significantly smaller than HBU, with wiring and plumbing that would be too costly to change to HBU standards. Empirical methods for estimating the amount of depreciation in these houses - i.e., how much the potential for teardown influences property value – have been developed by Clapp and Salavei (2010), Dye and McMillen (2007) and Munneke and Womack (2015 & 2020). These methods can be adapted to estimating land value ratios that are significantly higher than those for the HBU property.Footnote 21
-
In strongly rising markets with teardown and redevelopment or major renovation the land ratios for structures near teardown need to be adjusted upward towards one. These teardown markets are located at isolated points in time and space: i.e., not representative of most markets.
-
Once land value ratios have been established cross-sectionally, they will be approximately constant until the market experiences substantial appreciation or change in risk. In a typical market (rising, stable or mildly declining house prices) the land value ratio can be increased from the new construction date to the present time using an estimate of depreciation as we will demonstrate with our empirical analysis.
-
The land residual model, Eqs. (2) and (3), incorrectly predicts that almost all the price changes in typical markets are due to land value as we demonstrate by Figs. 1 and 2 and in Table 1: changes in construction costs and depreciation are the only determinants of structure value, and this can differ substantially from economic structure value. This problem with the land residual method calls into question some of the claims of the land leverage literature that predicts much more risk over time in rising markets due to increased land shares. We will show that this problem is present even over the first 10 or 15 years of structure life.
Estimation Methods for Depreciated Cost of New Construction
The land residual method estimates structure value as equal to the cost to build the structure at the time of the sale less depreciation (i.e., depreciated cost new, also called herein “replace cost”). Our objective is to replicate the steps taken by a cost appraiser, but to do so for tens of thousands of properties. We cannot visit each property, but we can use detailed information provided by the Maricopa assessor to approximate much of the information used by professionals to estimate “replace cost”.
To implement cost estimates we adapt information in the Marshall Valuation Service Cost Estimation Manual (8/2018 with supplements on 1/2019) to the Maricopa data. We use a per square foot (“unit in place”) method to calculate costs whereas Eriksen and Orlando (2019) use the costs of labor and materials inputs. This reflects different research objectives: they focus on factors contributing to changes in marginal cost of supplying rental housing as a function of number of floors whereas we estimate the total cost of SFR structures with no more than three floors. We follow their example of meticulous consideration of various influences on cost.
We begin with base costs per square foot (psf) for class D, masonry veneer single family residential construction. These psf costs decline with total square footage and vary depending on construction quality. The Maricopa assessor provides a variable (“r_iclass”, which we define as “construction quality” in Table 3) for construction quality. We tested this variable, described in more detail in the empirical section, extensively and found that it provided a good fit to the data. We note that differences between class D and C, and between masonry veneer and other veneer typically amount to 2 to 7% of costs once construction quality is controlled, so we do not think our decision here, or our choice of rectangular or slightly irregular structure shape, grossly distort our cost estimates.
Using methods from the cost manual, we modified base numbers for two or more stories, and added for a swimming pool (about 60% of our SFR sales), square footage in a finished basement (infrequent in Phoenix), additional square footage such as a granny flat or guest house, square footage in an attached or detached garage and for sports courts (infrequent). We added estimates for the cost of appliances but made no adjustment for HVAC because the base numbers in the manual include HVAC costs for moderate climates. We used cost multipliers specific to Phoenix and we use yearly estimates of Phoenix cost changes for class D construction to adjust costs from 8/2018 to the year of sale.Footnote 22
Our estimates for depreciation use tables in the cost manual modified by results from our SFR hedonic regression for each market area. Like Bokhari and Geltner (2018), we find fairly rapid depreciation in market value (roughly 1% per year) for the first 10 years of structure life, with the rate of change in depreciation gradually flattening for older structures up to about 50 years.
Other studies in the land residual literature have used a variety of approaches for calculating construction costs. For instance, Bourassa et al. (2020) calculate the construction cost as the product of the volume of the structure and the construction cost per cubic meter. This is quite different than the Davis et al. (2019), who use cost appraisals submitted to Fannie Mae and Freddie Mac between 2012 and 2018 in Uniform Residential Appraisal Reports. As far as we know, the quality of these appraisals has not been tested, but appraisers generally consider costs more reliable for new structures. Appraisal reports are not typically available for houses that do not sell, restricting out-of-sample valuation. In our analysis, we use much more detailed information, even more than a typical hedonic regression, and our cost estimates are available out-of-sample.
The Data
The focus of the empirical section of this paper is on Market 5 in Maricopa County, AZ, for properties that sold post-2011 during a recovery period when the economy experienced a positive shock to demand.Footnote 23 The geographic boundaries of Market 5 (Fig. 3) are defined by the Maricopa County assessor to include sales of higher priced single-family homes (SFR), averaging $504,517 compared to a Maricopa County overall mean sale price of $253,028. As discussed above, we selected Market 5 because it contains active markets for vacant land and new home sales as well as single family residential properties. This allows us to compare the three general methods for land valuation to our option value method. Our choice of market 5 favors the land residual method because new construction can be substituted for teardowns in most of the market.
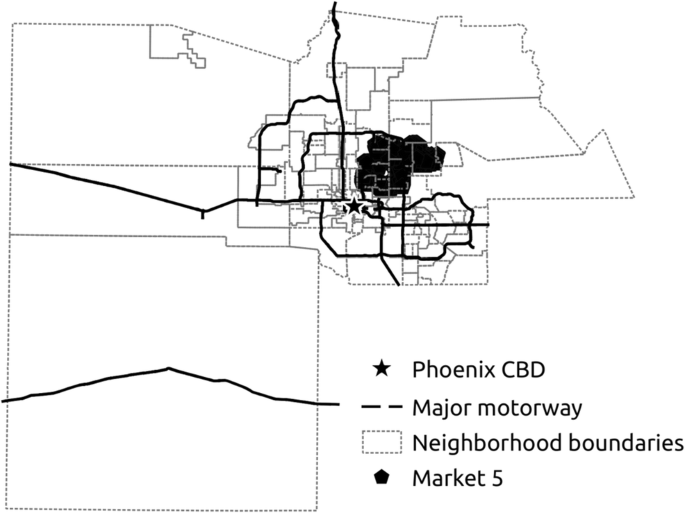
Map of Maricopa County, AZ
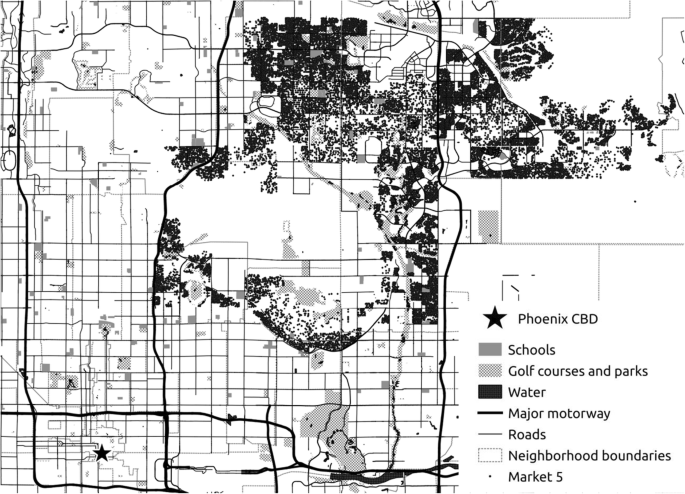
Figure 3 shows a map of Maricopa County, and demonstrates that Market 5 is linked to downtown Phoenix by major roads. A typical Market 5 location has a 10–15-mile drive to the downtown area, 10–15 minutes in average traffic according to Google maps. Figure 4 shows neighborhoods (as defined by the Maricopa County assessor) in Market 5. It is noteworthy that there is a grid pattern of streets, as well as many golf courses, schools, mountains and water amenities. After examining Google Maps it is apparent that the areas where there are no transactions are often locations with mountains, parks, and golf courses offering amenities to bordering residential areas. Market 5 clearly benefits by ease of access to amenities as well as access to downtown.
Map of Market 5, Maricopa County, AZ
Using a GIS we add layers of data on distances to downtown and to roads by type of road, schools, parks and water bodies. Most houses are within 1.4 miles of a primary road; the mean of 0.92 miles indicates a substantial majority closer than one mile. Distances to secondary roads, parks and water show substantial variation. Using an overlay of topographical maps, we add a dummy variable (high elevation dummy) which has values of 1 for high elevation locations, otherwise zero. About 5% of Market 5 houses are at high elevations, whereas many Maricopa County markets have no houses at high elevation.
A data filtering process was applied to the entire dataset for Maricopa County, to yield the final data that we use in our analysis. To mitigate possible confounding factors from the financial crisis and obtain conservative estimates of the relevance of option values, we focus on the sale years for the period 2012–2018. The filtering process is described in Table 2.
In Table 2, SFR structures in Market 5 average about 31 years old, with 25% being greater than 38 years at the time of sale (2012–2018).
Over two-thirds of sales have a swimming pool, an important amenity in the warm, dry climate. Market 5 does not have many golf communities (about 15%). Locations on cul-de-sacs and greenbelts are desirable amenities available for a small percentage of sales (Table 3).
Table 4 indicates a great deal of variation in structure size (improved area), with the average around 2400 sf. Most are single story or split-level ranch houses as indicated by the first-floor area (not shown in Table 4), which in many cases is the same as total square footage, which in many cases is the same as total square footage.
We applied the cost approach described above to value each SFR structure: the result is the “replace cost” variable. This variable starts with the characteristics of each SFR sale and estimates the cost to build a new structure with the same characteristics in the year of sale (“sale year”), then subtracts an estimate of depreciation to arrive at the depreciated cost of a new structure, the estimate of structure value according to the land residual method. Because Market 5 has thousands of sales of vacant land and new construction, older housing must compete with newer. A buyer considering an older house will be able to compare prices, location and characteristics to those of a newer house, or buy vacant land and buy a custom-built house. We expect significant substitution between new construction and older existing houses. This is important: we do not expect dramatic differences among the land valuation methods in Market 5. Any differences we do find will illustrate conservative differences, i.e., that should be accentuated in markets with limited substitution between new construction and older properties.
Market 5 is useful for comparing valuation methods because there are substantial differences in locations of SFR, vacant land and new construction within Market 5. Table 5 shows number of transactions by each of the 28 neighborhoods with boundaries defined by the Maricopa County assessor. Table 5 shows that there are at least 125 SFR sales in each neighborhood and at least one vacant or new construction sale except for 5015 which has no vacant sales but an active new construction market. A handful of neighborhoods have less than 10 transactions in vacant land and in new construction: a buyer wanting to locate in those neighborhoods would have little alternative to an older SFR.
Table 6 characterizes neighborhoods using the ratio of vacant and new construction sales to all SFR sales, where we define new construction as structures less than 16 years old at the time of sale. Clearly many neighborhoods have substantial vacant and/or new construction options for buyers. Neighborhoods with active vacant land and new construction are likely to have substantial tract development. In these, the value of land at the point of construction, but not necessarily over the ensuing 15 years, should be well-measured by the land residual method. The eight neighborhoods without a lot of alternative to existing SFR should have most land values determined by irreversibility.
An alternative to the choice between new and existing SFR is to buy a property (typically a small, old house), tear it down and rebuild. The Maricopa County assessor has identified 75 sales for teardown (Table 7). More than half the teardowns are in two neighborhoods, 5004 and 5005, and almost all of the teardown sales took place in 3 years, 2016–2018. Moreover, the median teardown prices are high compared to the sales of all SFR (see Table 4).
The teardown numbers in Table 7 are highly consistent with the option exercise as predicted by real options theory. Options are exercised at the high contact point, where the price of a newly constructed house at that location (i.e., the price of the underlying asset) has risen permanently to a level that triggers options exercise. The high-contact point must be high enough to justify sacrificing the value of the option which is extinguished after exercise and the value of the existing structure, plus teardown and new construction costs. Ben Bernanke famously described the requirement of a permanently (as believed by the option holder) high price with the regret principle: the person exercising wants some assurance that she will not regret the decision if there is a negative shock to the market. (Note that the prices of teardowns in neighborhoods 5004 and 5005, shown in Table 7, are substantially higher than vacant land in Appendix 2.) This is because the high contact point is far above the NPV = 0 point. In the housing market this implies that option exercise is highly concentrated in time and space, and this is the case in Market 5 (Table 7). This characteristic of option exercise has been documented in other markets by Dye and McMillen (2007) and by Munneke and Womack (2020).
Regression Results and Land Ratios over Time
Table 8 presents hedonic regression coefficients starting with a baseline hedonic valuation model where the dependent variable is SFR sales prices, model (1). Land residual estimates of land values are the dependent variables for models (2) and (3); models (4)–(7) are designed to test the land residual model by regressing sales prices on various combinations of land residual variables and hedonic variables. Model (5) includes all the variables in any of the other models: i.e., it is the unrestricted model which nests models (1), (4), (6) and (7). We chose to estimate models linear in improved area and structure age because nonlinear regressions (not shown) support the linear restriction and results are easier to interpret.Footnote 24 We estimate models in levels because the land residual model is additive in levels, not logs, and some land residual values are negative. We enter land square feet linearly and as a square root to account for “excess acreage”; the value of a building lot per square foot declines if lot size is above the amount needed to build with a normal yard. The square root specification performed well when tested against nonlinear specifications.
All coefficients in the baseline hedonic model (1) have the expected signs. Larger interior area increases structure value at the rate of $122,400 for each additional thousand square feet of floor area: note that sales prices are in hundreds of thousands of dollars and interior area is in thousands of square feet. Property age has the expected negative sign with value decreasing at the rate of $4300 per year from a base in 2012 of $407,400. The presence of a pool adds about 5% to value and construction quality increases value at an increasing rate. Recall from Table 4, that the vast majority of structures have an average quality rating of 4. Properties with an average rating are not worth significantly more than the nearly 5000 properties with rating of 3. Taken together, these sales form a base value typical of market 5: higher quality ratings are exceptional with quality rating 6 (only 302 sales) worth nearly $200,000 more than average. We conclude that the market validates assessor construction quality estimates. This is important because construction quality figured prominently in our estimates (based on cost manuals) of the cost to rebuild structures. In models (2) and (3) the dependent variables are land residual values: i.e., estimates from Eq. (3), sales price minus depreciated construction costs. Model (2) explains land values with all the location variables in our dataset, providing estimated (“hat”) values for models (4) and (5); in addition, model (2) is used for out-of-sample analysis. Significant coefficients in model (2) are the same signs as coefficients in model (1), and magnitudes are similar except for a few of the distance variables and the lot area variables. This means that the land residual method is capturing many of the characteristics of land value that are relevant to market pricing, but with somewhat different weights on several characteristics. The square root of lot size has a much larger coefficient in model (2) compared to model (1) but marginal valuations are virtually identical for the two models, ranging from $14 per square foot to $4 per square foot over a relevant range of lot sizes (6000 to 27,000 square feet).
Structural characteristics are included in model (3) to examine their relationship with land residuals. Land residual theory would predict that land and structure are two separate components of property value with structure properly valued by depreciated construction costs. If this were the case, then we would expect zero coefficients on structure size unless our construction cost estimates were incorrect, or structure is substituted for land. The near-zero coefficients on construction quality and pool dummies suggest that the market values these factors in about the same way as we included them in construction costs: i.e., the land residual model and our cost estimates are jointly supported.
Interpretation of the large positive coefficient on interior area and the $27,000 reduction in land value per year of age is difficult. The signs of these two variables are opposite those that might follow from a purely mechanical relationship: more square footage (higher age) adds to (subtracts from) estimates of structure cost, meaning that they have the opposite mechanical influence on land residual values which are estimated using Eq. (3). It is highly unlikely that we underestimated the influence of size and age enough to account for the signs observed in model (3) because the cost manual provided for large influence of these variables. We conclude that these two large, significant coefficients provide evidence of a problem with the land residual method: for a typical property in the rising market studied, marginal structure value per square foot is undervalued and the amount of structure depreciation per year of age is greater than the cost method would indicate. These marginal effects are consistent with option value theory and with the simple example of option value in a rising market, Table 1.
Model (4) tests the additive separability assumption of the land residual model. If the assumptions are correct, and structure costs correctly estimated then the two should add up to the predicted sales price. Instead, marginal land residual values are overestimated by about $9200 per thousand dollars increase in the land residual, and structure values are underestimated by $26,100. For large houses with cost estimates in the $300,000 to $400,000 range these results can be interpreted to mean that the market value is roughly $100,000 higher than the cost estimate. It may be objected that the discrepancy is due to errors in our cost estimates, but as pointed out above, this is a problem common to all land residual models, and we have a much more detailed and plausible method for estimating structure cost than the previous literature.
Model (5) is the unrestricted model which contains all explanatory variables in any other model. It is included to provide for nested tests of differences in model fit. Model (5) double counts the effects of many variables. This results in a negative sign on lot size because land residuals already account for lot size.
Models (6) and (7) are hedonic models supplemented with depreciated structure cost estimates. Our estimate based on a cost manual includes many variables that are not in the hedonic. We estimate the cost of a finished basement, a garage (attached or detached), additional square footage (e.g., outbuildings) and sports courts (costs vary with size). Also, cost of a second story is estimated separately from the first story. Therefore, we expect structure costs to add information to the hedonic variables, and we find that the R-squared is higher than the baseline hedonic. Model (7) is the same as (6) except that structural characteristics are omitted. Consistent with model (4), replacement cost substantially underestimates the marginal economic value of the structure.
Evaluation of Alternatives to the Simple Land Residual Model
This section evaluates nested models in and out of sample in order to determine if alternatives to the land residual model add explanatory and predictive power to the baseline hedonic.
We use RMSE (last line of Table 8) to compare in sample because the R-squares for models (2) and (3) are not comparable to the other models whereas all RMSEs are calculated based on the variance of sales price compared to predictions of sales price given parameter restrictions.Footnote 25
Not surprisingly, the lowest RMSE is the unrestricted model (5) in which other models are nested. A likelihood ratio test on model (1) versus (5) produces a strongly significant chi-squared statistic, 717 (p-value = 0.0000): i.e., the addition of the land residual variables adds explanatory power. Similar comparison of models (5) and (6) shows that only one of the two land residual variables, construction costs is needed as an addition to the baseline hedonic: there is no chi-squared value because the two models differ only by the redundancy of the land residual variable.
Importantly, the land residual model standard in the literature, model (4), performs poorly in-sample. The additive separability restrictions it requires produce a very large chi-squared statistic, 2461 (p value = 0.0000). A particularly interesting comparison is model (6) vs model (3) which differ by the restriction of the parameter on depreciated cost to equal one in model (3). The RMSE for model (3) is .002 higher than model (6), chi-square = 100.41, significant at less than the 1% level.
Table 9, panel A replicates all these in-sample tests using a leave-one-out framework; results are consistent. We conclude that the additive separability restrictions imposed by the land residual model are not supported by the data. But the addition of structure replacement costs to the standard hedonic model produces the best results in and out of sample. This supports our very detailed use of a cost manual to estimate construction costs, and it shows that construction costs are valued in the housing market.
Are Model Results Consistent with Predictions from Option Value and Land Residual Theories?
Table 9 adds variables to Table 8 models in order to test the option value and land residual theories. The simple model discussed above says that, in a rising market, structure value declines towards zero for small old structures. The model shows that the economic value of these small old structures is substantially less than predicted by land residual methods: see the numerical example in Table 1.
Table 9, panel B tests this by adding a dummy variable for small old structures interacted with the relevant valuation variable from each model. As predicted by option value theory, the marginal value of interior square footage is reduced dramatically for these structures, from $1258 for an additional thousand square feet to $633, a 50% value reduction. Panel C interacts the small old dummy with one for the moderate to high option value neighborhoods identified in Table 10. The result is a larger reduction in valuation to $588, as implied by theory. The large additions to the constant term (1.245 and 1.388) can be interpreted as higher land valuation for these properties.Footnote 26
The interactions of small-old dummies with “replace cost” in models (4)–(7), panels B and C, all strongly confirm the predictions of option value theory given that house prices are increasing in the market.Footnote 27 The decrease in marginal valuation of additional cost for small old houses is between 25% and 67% of the valuation for other houses. Larger decreases in absolute dollars and as a percentage are observed for small old houses in moderate to high option value neighborhoods, panel C.
We tested nonlinear models similar to those in panels B and C. When interior area and replace cost variables were included as quadratics, conclusions are similar, but interpretation is obscured by the squared variables. When quantile dummies (an approach to allow for nonlinearities) are substituted for property age, interior area and replace cost, most of the significance of the small-old dummy goes away. This is not surprising since lack of significance means that quantiles on age and structure size or cost capture the effect predicted by the model: interaction terms are not required. Changes over time in land values and land shares.
Panel A of Table 10 presents changes in price indices from 2012 to 2018 for models (1) and (2), Table 8 and for a third model using “replace cost” as the dependent variable. The increase in construction costs (model (3)) is the rate of increase from the cost manual we used, weighted by the ages and characteristics of structures in our market 5 sample.
Two problems with the land residual method are apparent in Table 10. First, land shares appear very high when compared to shares of around 20% in Ahlfeldt and McMillen (2020). This is due to the undervaluation of structures in a rising market which increases the economic value of both structure and land, whereas the land residual method applies a depreciation rate to construction cost growth: I.e., structure value is said to increase at less than construction costs despite a 47% increase in property values! Table 8 provided evidence for this with the 1.26 coefficient on construction costs, model (4). If we increase structure value in the first line of panel A by 26%, reducing the land residual by about $54,000, then we get a more plausible land share of 36%.
The second problem is the very high rate of increase in land share, from 49.1% to 60.7%, an increase of nearly 24% in only six years. The 78% increase in land values follows from the slow growth in depreciated construction costs (11.3%) when subtracted from rapidly increasing house prices (up by 47.3%). The land residual model does little to constrain the increase in land share in a market with increasing house prices as illustrated over a longer time in Fig. 1.
Land Value Shares over Time: Option Value Compared to Land Residual Assumptions
We use option value to construct land value shares (Table 10 panel B) by first classifying neighborhoods according to the amount of option value and then using option value concepts based on Eqs. (4) and (5) to estimate land value ratios and evolution of ratios over time for each neighborhood type. Our strategy is motivated by our objective of showing that application of option value concepts to land valuation might produce land value ratios dramatically different than the land residual method, even in market #5 which has a lot of new construction and large numbers of vacant land sales that can be substituted for existing housing. We compare to land residual estimates that we calculate and those produced by the FHFA (Davis et al., 2019).
Using results in Tables 6 and 7, we identified four types of neighborhoods:
-
1.
Neighborhoods with high concentrations of teardown sales in 2016–2018. Table 7 which shows that the 75 teardown sales are concentrated in the last 3 years of the time period and that options exercise is concentrated in neighborhoods 5003, 5004 and 5005. These three neighborhoods are classified as in neighborhood type (A). Note that this concentration of options exercise in time and space is as predicted by option value theory, where the high contact point holds when expected future implicit rental income is unusually high (See Helms, 2003; Munneke & Womack, 2020). For this category, we assume that land values evolve based on the evolution of vacant land prices divided by prices of existing SFR properties from the baseline hedonic model.
-
2.
Neighborhoods that are characterized by tract development or a high percentage of new construction sales. There are 14 neighborhoods in this category, neighborhood type (B). We assume no option value in these neighborhoods: for comparison we assume that land shares evolve as predicted by the land residual model, Table 10 panel A.
-
3.
Neighborhoods with high vacant land percentages but not high rates of new construction. There are 3 neighborhoods in this category. Their codes are 5008, 5022 and 5028. We exclude these neighborhoods from our option value analysis since many vacant properties have not reached the point of option exercise. Including them does not substantially influence our conclusions.
-
4.
Neighborhoods with high percentages of existing housing sales: i.e., neighborhoods that do not fall into any of the above categories. There are 8 neighborhoods in this category, neighborhood type (C), completing an exhaustive classification of the 28 neighborhoods. Option value theory predicts that land shares are increasing slowly due to annual structure depreciation in this category. Construction costs are not a factor for this type of property as indicated by Table 1 and the above discussion of theory.
To finish implementing our strategy, we obtain land value ratios in 2012 based on land residual theory using median prices for land and new houses for each neighborhood type. We think these ratios are too high because residual assumptions undervalue most existing structures through the assumption that structure and land evolve independently and by ignoring capital land substitution. Ahlfeldt and McMillen (2020) use sales of lots linked to subsequent sales of new SFR properties to arrive at much lower ratios. Nevertheless, we use land residual theory for initial ratios because our focus is on changes over time in these ratios, not their level.
Option value theory says that each property starts with a ratio given by the land residual method. Over subsequent years this ratio increases slowly until depreciation and, more importantly, functional obsolescence increases the ratio toward one; a ratio = 1 is achieved at the high contact point when it becomes economically feasible to tear down and rebuild to highest and best use. We increase land values in type A neighborhoods at the rate of vacant land price changes and divide by prices in each year for new houses (less than 16 years old).
Results indexed to base 100 in 2012 show that land value shares for high option value neighborhoods increased by about 11% over six years compared to nearly 24% under land residual assumptions. There is more variability in neighborhood type (A), consistent with the evolution of vacant land prices in Fig. 2. The neighborhoods classified as existing with little option value, neighborhood type (C), have low growth in the land ratio due to depreciation only, as required by option value theory.Footnote 28 This 2% growth in land shares is dramatically less than 24% for neighborhoods where we use the land residual assumptions. Neighborhoods with little option value (type C) represents the vast majority of urban neighborhoods which have aging housing and little new construction or redevelopment, suggesting that the 2% to 24% comparison represents a general pattern in markets with increasing house prices. These large differences over only six years suggest that the hockey stick pattern over time found by Knoll et al. (2017) is largely an artifact of land residual assumptions.
Generalization to the U.S.: FHFA Land Residual Estimates of Land Share over Time
The last column of Table 10, panel B presents land share data from the FHFA (Davis et al., 2019), a study that provides similar information for numerous MSAs representing a large share of the U.S. housing market.Footnote 29 They apply the land residual method only to structures built within 10 years of sale, reasoning that these new properties should follow the land residual theory. But we find that FHA land shares increase even more rapidly than in neighborhoods with a lot of new construction, 27% vs 24%. Option value theory says that the problem with FHFA numbers is that they do not allow new structure values to increase with property values over the first 10 years, and they do not allow for building larger houses as land becomes more expensive (capital land substitution).Footnote 30
It may be objected that this conclusion follows from our assumption that land ratios in the 8 neighborhoods dominated by older existing SFR are constant except for depreciation. The objection is correct, but is it an objection or just a comment? The assumption reflects the reality of irreversibility – land and structure are a bundled good – and this applies to the majority of the built environment in most urban areas. Moreover, we have provided considerable empirical support for the assumption in Fig. 2, the temporal and spatial clustering of market 5 transactions in Tables 5 through 7 and the coefficients in Tables 8 and 9. Most importantly, we began with a simple thought experiment: what typically happens to urban structure and land values when the only change within a fully built-up neighborhood is an unexpected, permanent shock to demand? Land residual assumptions do not provide a plausible answer when the value of a large structure is compared to the otherwise identical small structure.
Do we contradict ourselves with our theory which nests the land residual Eq. (1) within option value theory, but then presenting evidence that land residuals give incorrect patterns over time even for houses built within 10 or 15 years of sale? No, because land residual theory holds at the moment of construction, not after changes such as the boom in house prices in Maricopa county, 2012–2018. To correctly apply option value theory, the analyst needs construction costs for each property at the time it was built. The resulting land value ratio changes over time as predicted by irreversibility, not with the ratio of other newly built properties in the neighborhood: land and structure function as a bundled good after construction whereas land residual theory severs the connection between land value and the structure that provides the source of residual value to land.
Summary, Conclusions and Possible Directions for Research
Most of the existing literature on urban land valuation uses the residual model which assumes that structures can be valued by the cost to build less depreciation which depends on structure age. Residual land value is estimated as property value less the depreciated cost of new structures. This “depreciated cost new” method is widely applied by real estate appraisers, scholars and for valuing land for national accounts. The key assumption of the land residual method is that structures are easily replaced, so their value is the cost of construction, i.e., the dollar amount required to bid resources away from other uses of the land, materials and labor required for new construction, less depreciation.
In contrast, option value theory assumes irreversibility: after construction land and structure trade as a bundled good for an extended period of time.Footnote 31 Under most market conditions, change in the relationship between land and structure stems from the slow process of structural depreciation which gradually increases the land value ratio (land value divided by total property value) at the individual property level. Any shocks to property value are shared between land and structure according to the slowly changing land ratio, whereas the land residual theory assumes that almost all the shock is transferred to land value.
We develop a theoretical model that includes option value and compare to the land residual model before and after a shock to land values. We incorporate both spatial and time dimensions to generate some intuition for our nested empirical analyses. The land residual method, as applied to newly constructed properties, is a special case of the option value method: it correctly estimates land value at the time of redevelopment, when the existing structure is worthless because it is about to be demolished.
We apply the two methods to Maricopa County sales in one large submarket, Market 5, with boundaries defined by the tax assessor to identify a distinct submarket. Market 5 has expensive homes on average with substantial variation over the 28 neighborhoods within the market. It was chosen because it contains large numbers of vacant land sales and new construction within our sample period, 2012–2018 as well as a significant share of the (few) teardown sales within Maricopa County. These characteristics weight our results in favor of the land residual method because older properties must compete with new construction, where vacant land is subdivided and new structures are built using resources with shadow prices determined as required by the land residual model.
Our application of the land residual method employs detailed construction cost and depreciation estimates based on valuation manuals used by appraisers and assessors to value structures. Land value is estimated as sale price minus depreciated construction costs (“replacement costs”). The key step is our mass appraisal estimate of the replacement cost to build every structure in our SFR sales database, 24,250 properties.
Our regression models are estimated for a boom period (2012–2018) chosen to correspond to the positive demand shock in our theoretical model. Nested models include a baseline hedonic model and a land residual model. Significant coefficients on replacement costs suggest that the marginal economic value of a typical structure in market 5 is substantially greater than replacement cost as predicted by the option model. Similarly, marginal land values estimated by the land residual method are overvalued. These marginal effects imply that an option value theory approach is validated, as well as providing support for our simple model of option value in a rising market. In-and-out-of-sample tests of the nested models strongly support our option value model.
We also show that land shares for high option value neighborhoods increased by about 11% over six years compared to nearly 24% under land residual assumptions, and there is more variability in high option value neighborhoods as expected if the property trades more like vacant land. In more typical neighborhoods with little new construction or option value, the land share increases only 2% over six years due to depreciation. We compare to land residual estimates produced by the FHA (Davis et al., 2019): their numbers show a 27% increase in land share over six years. Similarly, they find high rates of increase in many U.S. MSAs, suggesting that our findings generalize. These results imply that the risk associated with residential real estate investment and lending is substantially overestimated by the land leverage model.
Our research is limited in several ways. First, we limit our theoretical and empirical work to a positive demand shock (boom period) because option theory in a bust is not symmetrical with a boom. Fig. 1 strongly suggests that the land residual method implies too much land value volatility in a bust, but we leave that study for some future time. Second, we stop short of estimating the land share for individual properties. The land valuation procedures we suggest here might be implemented using the Ahlfeldt and McMillen (2020) and Davis et al. (2017 & 2019) methods to find land shares for newly built properties. These methods, supplemented with depreciation estimates, would provide land share estimates for most urban real estate. Third, some variant of the Munneke and Womack (2020) method might be applied to estimate land value for the minority of properties that have significant option value. With these three extensions of the option value model, reliable land value estimates and their dynamics might be accomplished over the next few years.
Notes
Prof. Ted Bergstrom has lecture notes providing a good technical explanation of additive separability. We will show that land and structure value cannot evolve separately under the assumption of irreversible investment in structure.
Piketty (2017), chapter 5 defines pure land as “land prior to any human improvements” and suggests that “pure land constitutes only a small part of national capital.” Here we point towards methods for separating the value of land with improvements from the economic value of structure and we argue that their patterns over time are highly interdependent.
It might be objected that long run changes in structure value must be the same as changes in construction costs. This is not the case because of substitution between structure and land, as we demonstrate with our numerical solutions below. The intuition is that higher valued structures will be built on higher valued land, reducing the ratio of land value to property value when land value is increasing.
However, once a substantial structure is added to the land, the option to redevelop with another structure has very little value: the option is “deep out of the money” because of irreversibility. This implies that the value of urban land (not vacant) should be much less volatile than implied by the vacant land index or the land residual index. Figure 2 shows the opposite relationship, raising doubts about the land residual method.
The model presented here may be compared to the one in section 2 of Davis et al. (2019). We improve on that model by: 1) including risk – and therefore the option to delay – in the model; 2) our comparison to the land residual model before and after a shock to values; 3) substantially simplifying mathematics to improve intuition. The main point of the Davis et al. (2019) model is to point out that the Davis and Palumbo (2008) land residual model does not hold for older structures, so research based on that model should be limited to new construction. Our model is designed to provide intuition for empirical work on the land value ratio.
Throughout, parameters are given by lower case letters, variables by upper case.
We distinguish the rate of transformation between land and structure in production -- i.e., the technical rate of substitution – from the more common elasticity of substitution in a profit maximizing framework.
We ignore demolition costs which are small for residential properties.
For example, an elderly person living in a small old house may not place high value in implicit rents.
A stochastic calculus model developed by Clapp et al. (2012) translates the smooth pasting condition from traditional option value theory into a cross-sectional equilibrium context. They produce equations that identify the minimal intensity of an existing property such that the economic value of the structure is zero and it will optimally be redeveloped, assuming that the option is in the money.
These calculations are special to the simple numerical example. The general conclusion is that land residual methods are incorrect except for new HBU properties: see the discussion in Appendix 1.
Equivalently, this could be modeled with constant construction costs and a 10% positive shock to rents, equation (6), but this would require additional columns for property value after the shock.
A common misperception is that the land value ratio increases when the value of vacant land increases. A related misperception is that the ratio increases when vacant land appreciates faster than property values. Comparing the ratio before and after the positive shock (Table 1) demonstrates that capital land substitution invalidates any such generalizations.
Obsolescence is defined by a change in HBU structure and property value to distinguish it from physical depreciation which is higher maintenance costs and wear that is too costly to repair. Another form of obsolescence is due to changes in tastes and technology such as improvements in electrical wiring.
This formulation avoids discounting or any expectation about the time T in equation (4) since the shock occurs at t = 0 or not at all.
The percentage of option value added as a function of deviations from the teardown point is based on the highly nonlinear theoretical prediction in Clapp et al. (2012) and on empirical results in Clapp and Salavei (2010) and in Munneke and Womack (2020). The simple model would be excessively complicated by any attempt to formally model these percentages. Empirical models are required to implement the option value model.
Longhofer and Redfern (2015) and Longhofer (2018) have developed models of incurable obsolescence, a form of depreciation that does not respond to normal maintenance and replacement expenditures. One form of obsolescence is an increase in neighborhood value that makes the existing structure too small: new construction would occur at much higher intensity. We think that these ideas are correct but of secondary importance for our purposes.
They carefully compare these estimates to other studies, establishing generality. They further examine the relationship between renovations and teardowns, showing that the likelihood of renovation declines substantially in the top decile of the teardown ratio, a finding consistent with endogenous maintenance decisions. Both renovations and teardowns are highly concentrated spatially but renovations (teardowns) increase more strongly with structure size (lot area).
In a falling market, option value (a value leveraged by the cost to build and the cost of sacrificing the existing structure) diminishes rapidly. The land value ratios for properties far from teardown will stay constant whereas the land residual theory implies a symmetrical response of land values to changes in property values, as suggested by Fig. 1.
We suggest a three-bucket approach: 1. use the HBU ratio for the one-third or more of properties with little obsolescence; 2. Use a high ratio as suggested by techniques in Munneke and Womack (2020) for properties near teardown (about 35% in their sample); 3. use a ratio in-between these two extremes for the remainder.
This is done before estimating depreciation. For the Phoenix Cost Index presented in Figure 1, we had Phoenix data for July of each year back to 2009. Prior to that we used the US Western District Cost Index.
The options value model presented above implies asymmetrical responses to positive and negative shocks because option values are highly nonlinear. Analysis of the bust period, 2007–2011 is beyond the scope of this paper.
Shifting these two variables with quintile dummies (not shown) does not substantially increase R2 and estimated values suggest a roughly linear relationship.
RMSE's are estimated with STATA's constrained regression module, cnsreg.
All dollar values mentioned here are partial marginal valuations after controlling all the other hedonic characteristics. For example, the $1258 cannot be interpreted as total property value per square foot.
Interpretation of the interaction term in models (2) is that the level of land value is lower for properties with small old houses because there is little structure left. This is obscured by the inclusion of many land characteristics in the regression, with all coefficients adjusting to the dummy for sales of small-old properties. Turning to model (3) it is a constrained version of model (6), so interpretation of interactions should be focused on model (6).
Our data support depreciation of about 1% per year for the first 6 years after construction, amounts consistent with findings in Bokhari and Geltner (2018). Since we assume that structure is only 27% of property value in 2012, depreciation does not have a big effect on our analysis.
Why are the FHFA land values and shares so much smaller than our estimates for neighborhood type (B), .26 vs .49 in 2012, given that both use the land residual method? We think this might be explained by FHFA’s use of appraised values which in turn are anchored to assessed values. We know that the Maricopa assessor values land at exactly 20% of property value for over 98% of all properties.
Substitution of structure for land is accommodated in our calculations for low option value neighborhoods with higher rates of obsolescence (a form of depreciation). Assuming somewhat higher depreciation does not change the conclusions put forth here.
Alternatively, one might say that land and structures are “effectively inseparable” since given a large enough positive shock, theoretically even relatively new structures could be torn down.
We simplify notation by assuming that the difference in optimized intensity at time T*, S*-Sd, continues from T*, when S* has no depreciation but Sd is substantially depreciated, forward to infinity. The difference is unchanged in our notation.
A comprehensive explanation of the Capozza and Li (1994) model with applications and intuition is given in Geltner et al. (2014).
It might be objected that the large house has less value per square foot, and so should appreciate at a lower rate than the small house on an equivalent lot. But, as shown with the simple model in the body of the paper option value depends on the HBU value of the bundle, not the marginal value of extra square footage. It would take special assumptions about the shock to rental value (e.g., a shock focused only on large houses) for this objection to hold true.
References
Ahlfeldt, G., & McMillen, D. P. (2020). New estimates of the elasticity of substitution of land for capital. Manuscript.
Albouy, D., Ehrlich, G., & Shin, M. (2018). Metropolitan land values. Review of Economics and Statistics, 100(3), 454–466.
Alonso, W. (1964). Location and land use. Harvard University Press.
Barr, J., Smith, F. H., & Kulkarni, S. J. (2018). What's Manhattan worth? A land values index from 1950 to 2014. Regional Science and Urban Economics, 70, 1–19.
Bokhari, S., & Geltner, D. (2018). Characteristics of Depreciation in Commercial and Multifamily Property: An Investment Perspective. Real Estate Economics, 46, 745–782. https://doi.org/10.1111/1540-6229.12156.
Bostic, R. W., Longhofer, S. D., & Redfearn, C. L. (2007). Land leverage: Decomposing home price dynamics. Real Estate Economics, 35(2), 183–208.
Bourassa, S. C., Hoesli, M., Scognamiglio, D., & Zhang, S. (2011). Land leverage and house prices. Regional Science and Urban Economics, 41(2), 134–144.
Capozza, D., & Li, Y. (1994). The intensity and timing of investment: The case of land. The American Economic Review, 84(4), 889–904.
Clapp, J. M. (2003). A semiparametric method for valuing residential locations: Application to automated valuation. The Journal of Real Estate Finance and Economics, 27(3), 303–320.
Clapp, J. M., & Salavei, K. (2010). Hedonic pricing with redevelopment options: A new approach to estimating depreciation effects. Journal of Urban Economics, 67(3), 362–377.
Clapp, J. M., Jou, J. B., & Lee, T. (2012). Hedonic models with redevelopment options under uncertainty. Real Estate Economics, 40(2), 197–216.
Clapp, J. M., Eichholtz, P., & Lindenthal, T. (2013). Real option value over a housing market cycle. Regional Science and Urban Economics, 43(6), 862–874.
Cohen, J. P., Coughlin, C. C., & Clapp, J. M. (2017). Local polynomial regressions versus OLS for generating location value estimates. The Journal of Real Estate Finance and Economics, 54(3), 365–385.
Davis, M. A., & Heathcote, J. (2007). The price and quantity of residential land in the United States. Journal of Monetary Economics, 54(8), 2595–2620.
Davis, M. A., & Palumbo, M. G. (2008). The price of residential land in large U.S. cities. Journal of Urban Economics, 63(1), 352–384.
Davis, M. A., Oliner, S. D., Pinto, E. J., & Bokka, S. (2017). Residential land values in the Washington, DC metro area: New insights from big data. Regional Science and Urban Economics, 66, 224–246.
Davis, M., Larson, W., Oliner, S., & Shui, J. (2019). The Price of Residential Land for Counties, ZIP Codes, and Census Tracts in the United States (no. 19–01). Federal Housing Finance Agency.
Diewert, W. E., Dehann, J., & Hendriks, R. (2011). Hedonic regressions and the decomposition of a house Price index into land and structure components. Working paper: https://econ.sites.olt.ubc.ca/files/2013/06/pdf_paper_erwin-diewert-11-1-hedonic-regressions.pdf. Accessed 12/1/2020.
Dye, R. F., & McMillen, D. P. (2007). Teardowns and land values in the Chicago metropolitan area. Journal of Urban Economics, 61(1), 45–63.
Eriksen, M., & Orlando, A. (2019). The cost of building multifamily housing: Estimating the marginal cost of construction inputs. Working paper.
Geltner, M. D., Miller, N. G., Clayton, J., & Eichholtz, P. (2014). Commercial Real Estate Analysis and Investments, 3rd edition, OnCourse Learning.
Haughwout, A., Orr, J., & Bedoll, D. (2008). The price of land in the New York metropolitan area. Current Issues in Economics and Finance, 14(3), 1–7.
Helms, A. C. (2003). Understanding gentrification: An empirical analysis of the determinants of urban housing renovation. Journal of Urban Economics, 54(3), 474–498.
Knoll, K., Schularick, M., & Steger, T. (2017). No price like home: Global house prices, 1870-2012. American Economic Review, 107(2), 331–353.
Landefeld, S. J., & Hines, J. R. (1985). National Accounting for non-Renewable Natural Resources in the Mining Industries. Review of Income and Wealth, 31(1), 1–20.
Longhofer, S. (2018). Land values and external obsolescence. Working Paper.
Longhofer, S., & Redfern, C. (2015). Estimating land values using residential sales data. Working Paper.
Mills, E. S. (1972). Urban economics. Scott, Foresman.
Munneke, H. J., & Womack, K. S. (2015). Neighborhood renewal: The decision to renovate or tear down. Regional Science and Urban Economics, 54, 99–115.
Munneke, H. J., & Womack, K. S. (2020). Valuing the redevelopment option component of urban land values. Real Estate Economics, 48(1), 294–338.
Muth, R. F. (1969). Cities and housing. University of Chicago Press.
Nichols, J. B., Oliner, S. D., & Mulhall, M. R. (2013). Swings in commercial and residential land prices in the United States. Journal of Urban Economics, 73(1), 57–76.
Piketty, T. (2017). Capital in the Twenty-First Century Translated by Arthur Goldhammer. Belknap Press.
Sirmans, C. F., & Slade, B. A. (2012). National transaction-based land price indices. The Journal of Real Estate Finance and Economics, 45(4), 829–845.
Acknowledgements
We thank the Lincoln Institute of Land Policy for providing the Maricopa county data, and for supporting Clapp and Lindenthal in this research. We thank Haneul Choi and Don Siegel, who provided 2017 parcel-level assessed values data for Maricopa County. Participants in an MIT Center for Real Estate Symposium, August 2019 provided helpful comments.
Author information
Authors and Affiliations
Corresponding author
Additional information
Publisher’s Note
Springer Nature remains neutral with regard to jurisdictional claims in published maps and institutional affiliations.
Appendices
Appendix 1: A General Option Value Model
Urban land is approximated by dense development, with existing structures everywhere except the urban fringe. Our theory focuses on the vast majority of urban land which is not at the periphery and is not at the point of redevelopment, T*: At T*, the shadow price of vacant land has empirical content given by the following additive equation:
where H is the quantity of property services produced by combining optimal quantities of land L and structure S (assuming optimal intensity, S/L); p’s are per unit prices, functions of the variables in parentheses. Note that p(H)H can be observed as a function of sales prices of new houses. Davis and Heathcote (2007), Davis and Palumbo (2008) and Davis et al. (2017) develop a theoretical and empirical analyses of land and structure shadow prices p(L) and p(S) where these values are given by the opportunity cost of bidding resources away from the next best use.
This additive model has deep roots in the Alonso-Muth-Mills (AMM)Footnote 32 assumption that structures are rebuilt to optimal size whenever demand changes. We interpret Eq. (1) more narrowly as holding only for a new structure; it does not necessarily hold after.
The problem is that shadow pricing theory is widely acknowledged to break down as the structure ages. Consider the very common case: 0 < p(H)H < p(S)S, the cost of building a structure at optimal intensity is greater than the market value of land and structure. The option to redevelop is out of the money but the property has substantial use value, p(H)H determined by its accessibility to other urban land uses. Shadow pricing of the resources needed to build the structure does not accurately predict the value of the structure in this case. And it is incorrect to think that the value of land is zero in this case because accessibility (location) gives value to the existing property, land plus structure. The appraisal concept of “as if vacant” does not help predict values of L and S because vacant land is typically limited and at special locations. The built environment, given by history, determines values of L and S as explained next.
The land residual method deals with the problem of changes over time in demand and supply by assuming that structure can be valued at each point in time by subtracting depreciation from the cost to build a new structure with the same characteristics as the existing structure. That is, it substitutes the depreciated cost of S, in Eq. (1):
where Sd is the depreciated structure cost. Eq. (2) formalizes the land residual framework illustrated in Fig. 1: the value of the existing structure p(S)Sd decreases with depreciation but increases with construction costs which are typically rising over time. Rearrange Eq. (2) to see how the boom-and-bust cycle in house values is transferred to land value:
A General Option Value Model.
The main point of this paper is that option value theory gives a very different perspective on land valuation, showing that current thinking about land values and their changes over time are an artifact of the land residual model. Options value theory developed by Clapp et al. (2012), Clapp and Salavei (2010) and Clapp et al. (2013) is best understood by assuming that the choice of optimal intensity, S/L is largely irreversible: once the development decision is made, S and L are married (aka bundled) for a very long time. This marriage is slowly reversed by depreciation. To see this, consider a neighborhood (say the inner suburban residential ring) just after redevelopment and imagine that the whole neighborhood was developed simultaneously as implied by AMM theory. We allow the properties in that neighborhood to be built to different levels of intensity because property owners have different expectations about future implicit net rental income. These structures are unlikely to be rebuilt immediately after changes in demand for the neighborhood.
To see why land and structure become an economic unit, add a permanent positive shock to demand within that neighborhood raising spot prices p(H) into perpetuity. Those property owners who built aggressively (high Sa/L) have a lot more value than those with low Sa/L due to irreversibility, where Sa is actual structure size which can differ across individual properties. Three implications of this thought experiment will be developed in this research: 1) The additive model breaks down in this common case of increasing house prices, just as in the 0 < p(H)H < p(S)S case. In this case it allocates any increases in property value p(H)H to land, predicting that land values increase as a percent of property value. 2) Our empirical results show that very different results are obtained when we add some part of this increase to p(S)Sd because of irreversibility.
Irreversibility is a key assumption in option value theory, which substitutes infrequent, localized option exercise (i.e., major renovation or rebuilding of the structure) for the frequently malleable structures assumed by AMM and the land residual method. In option theory, landlords will not change the structure until they reach a “trigger point” at time T*, chosen along with S*, the optimally sized new structure to maximize:
where S′ and T are decision variables, k is the cost per unit structure to tear down and rebuild to optimal intensity, S*;L at time T*.Footnote 33 Rent per unit of structure, p(S;L,t) is used instead of prices in Eqs. (1)–(3) to emphasize the fact that rent is paid per unit structure and that structure and location are rented and sold as bundled characteristics. Rent per unit, p(S;L,t) depends on the quantity of structure and land, so the functional relationship holds at S* or any other level of S such as Sd, given the amount of L. The building lot size, L, does not change at the time of redevelopment. The EPV operator stands for expected present value at time t = 0: i.e., there is an underlying random process with expectations that likely differ across landowners, leading to different T*, S* choices at a given location.
The p(S;L,t) (S′ - Sd) term with optimized S* > Sd is key feature in the Clapp et al. (2012) model: the value of the existing structure from T* to infinity must be sacrificed if the option is exercised. Any shock to the present value of p(S;L,t) applies equally to the new structure S* and the old structure, Sd. The importance of this can be seen by examining the solution equation for T* which requires that p(S;L,t) reach a point where the marginal value of keeping the existing structure is just compensated by the marginal value of tearing it down and rebuilding to higher intensity, S*
Here the R[] operator means the annualized rental value of each term, location rent includes growth in rent (and includes any amenities such as a view) and R[agri.] is the rental value of agricultural land. R[k] is the annualized cost to build the optimal structure and R[irreversibility] is the value of the option, one of the costs of exercise. Equation (5) is relevant only if the first and second derivatives with respect to time optimize T and S, and the total value from redevelopment must be greater than zero so that it is rational to exercise the option.
Much of this theory applies the urban boundary as shown by Capozza and Li (1994).Footnote 34 The -Sd term is added by Clapp et al. (2012) so that the model applies to teardowns within the urban boundary. They show that, if an optimal T* exists for an existing structure, then at any given time there may exist small old houses that are at the point of redevelopment, i.e., they succeed in translating a time series process into cross-sectional empirical implications.
Equation (5) says that the present value of exercising must be substantially greater than NPV = 0 defined as R[p(S;L,t)S*] = R[k]: costs include the lost rental value from giving up Sd and a valuable option (the irreversibility premium). These costs are an important part of the “high contact point” where option exercise takes place. Any expectations of increases in p(S;L,t), which increases the value of the new structure also implies rising value per unit of the existing depreciated structure, i.e., the cost of exercising increases with the benefit from exercising. The difficulty in reaching this high contact point implies that option exercise occurs only at unusual points in time and space, where prices are expected to rise strongly and permanently.
How is Land Value Defined by Irreversibility and Option Value?
The answer to this question is surprising. Irreversibility – actually slow reversibility due to depreciation of the existing structure – implies that land value is given by the land residual method at the time of new construction. That is, Eq. (1) gives land value, but only when the structure is new. After redevelopment, land and structure function as a unit, with structure value gradually declining as a percentage of property value due to depreciation. Construction costs become irrelevant when one is not at the redevelopment point.
The land ratio (ratio of land value to total property value) gradually rises after new construction due to depreciation. But, any changes in supply and demand that influence property value – unexpected permanent positive or negative shocks to value – influence both land and structure value in the same direction. Consider a fully developed neighborhood that unexpectedly becomes more valuable over time. The owner of a large well-constructed house will benefit more than the owner with a smaller house. How can this increment be entirely due to land value, as asserted by the land residual model? Both land and structure will increase at about the same rate due to the positive shock.Footnote 35
Appendix 2 Vacant Land Sales
Rights and permissions
Open Access This article is licensed under a Creative Commons Attribution 4.0 International License, which permits use, sharing, adaptation, distribution and reproduction in any medium or format, as long as you give appropriate credit to the original author(s) and the source, provide a link to the Creative Commons licence, and indicate if changes were made. The images or other third party material in this article are included in the article's Creative Commons licence, unless indicated otherwise in a credit line to the material. If material is not included in the article's Creative Commons licence and your intended use is not permitted by statutory regulation or exceeds the permitted use, you will need to obtain permission directly from the copyright holder. To view a copy of this licence, visit http://creativecommons.org/licenses/by/4.0/.
About this article

Cite this article
Clapp, J.M., Cohen, J.P. & Lindenthal, T. Are Estimates of Rapid Growth in Urban Land Values an Artifact of the Land Residual Model?. J Real Estate Finan Econ 66, 373–421 (2023). https://doi.org/10.1007/s11146-021-09834-4
Accepted:
Published:
Issue Date:
DOI: https://doi.org/10.1007/s11146-021-09834-4