
Abstract
In this paper, we examine bad debt and charity care reporting by nonprofit hospitals around bond issuance. Given the tax advantages afforded to nonprofit hospitals, including the ability to issue tax-exempt debt, hospital managers encounter stakeholder pressure to provide community benefits. When nonprofits issue debt, they also face economic pressure to meet creditors’ financial performance expectations. We document a reporting strategy that allows nonprofit hospitals to reduce the cost of bond debt while simultaneously alleviating regulators’ and community members’ concerns about inadequate provision of charity care. Using data from public bond issues for California nonprofit hospitals, we find that hospital managers shift costs from bad debt expense to charity care in periods prior to a public bond issuance and that the strategy is associated with a lower cost of debt. Our results inform those relying on accounting measurements to infer nonprofit hospitals’ social good provisions and financial health.
1 Introduction
Nonprofit entities enjoy significant economic benefits via federal, state, and local tax exemptions, including access to the tax-exempt municipal bond market. In exchange, regulators and constituents expect nonprofits to return value to the public through the provision of community benefits (Weisbrod 1975). Nonprofits are, therefore, subject to significant pressure from various external stakeholders to fulfill their charitable purposes. Nonprofits also face economic pressure to obtain necessary external capital to fulfill their charitable missions. Since nonprofits cannot obtain funding through equity capital, they often rely on the issuance of tax-exempt public debt. Nonprofits must demonstrate their creditworthiness to underwriters and potential debtholders, which includes their ability to repay debt. Therefore, society’s expectation that a nonprofit provides community benefits with economic value large enough to justify its tax benefits is potentially in tension with creditors’ expectations regarding financial performance.
In this study, we investigate whether nonprofits use accounting discretion to demonstrate creditworthiness prior to issuing tax-exempt debt. We examine this in the setting of nonprofit hospitals. Given their economic significance, it is important to study the reporting behavior of nonprofit hospitals. Health care costs in the United States were approximately 18% of GDP in 2019 (CMS 2020). Over one-third of these costs is spent at hospitals, and well over half of all US hospitals are nonprofits (AHA 2017). Though largely neglected by extant research, the presence of nonprofit hospitals in the tax-exempt bond market is economically significant. Gaver et al. (2016) estimate that nonprofit hospitals account for as much as 40% of the estimated $235 billion in tax-exempt bonds outstanding among all nonprofits. Therefore, the accounting and reporting behavior of nonprofit hospitals is a robust setting in which to study the economically significant nonprofit sector in general, and the economically and socially important industry of healthcare in particular.
Specifically, we examine whether, during the period leading up to the issuance of tax-exempt debt, nonprofit hospitals shift bad debt costs into an alternative income statement item that reports the value of the community benefits provided. In the case of nonprofit hospitals, charitable health care (or “charity care”) is the primary community benefit provided in exchange for tax-exempt status. Although both bad debt expense and charity care are considered “uncompensated care” accounts that represent the value of services provided for which a hospital does not ultimately collect, they are distinctly different.Footnote 1
Stewart (2009) notes that charity care is “frequently distinguished from bad debt by courts and commentators by the distinction between the prospective nature of charity care and the retroactive nature of bad debt” (p. 1159). Charity care (a contra-revenue account) represents the known value of free or discounted healthcare provided during the current period to an indigent or otherwise uninsured or underinsured population, and is considered a direct measure of social good provision (Vansant 2016). Providing charity care is an explicit mission of a nonprofit hospital, distinguishing it from its for-profit counterparts. Internal Revenue Service (IRS) guidance states that “the provision of free or subsidized care to the indigent is a significant indicator to the courts and the IRS that a hospital [meets the Community Benefit Standard]” that dictates eligibility for tax-exemption (I.R.C. §501(c)(3)). Thus, nonprofit hospitals are both expected and required to provide charity care.Footnote 2
In contrast, bad debt (an expense account) represents an estimate of the portion of patient revenues earned that a hospital does not expect to realize based on an ex ante assessment of account collectability (i.e., current period service billings that will not materialize into future cash inflows). As such, bad debt write-offs originate from the non-collection of revenue from patients whom the hospital did not identify as being eligible for charity care and whom the hospital initially expected to pay for services rendered. These amounts include the entire bill for uninsured self-pay patients or the “patient portion” of the bill from insured patients (i.e., deductibles and coinsurance). Thus, creditors may view significant bad debt expense as evidence of poorly functioning hospital policies for identifying charity patients ex ante, insufficient collection efforts ex post, or general uncertainty about revenue collectability.
These differences suggest that minimizing bad debt by shifting costs to charity care could be a convenient strategy for management to address scrutiny from creditors and the public. Accordingly, anecdotal evidence suggests that nonprofit hospital stakeholders distinguish between bad debt expense and charity care, and the popular press reports that strategic shifting between these costs is commonplace (Hamill 2016). Prior research also provides evidence that nonprofit hospitals reclassified costs from bad debt to charity care following a 1990 change in hospital accounting guidelines (Eldenburg and Vines 2004). On the surface, hospitals’ incentives to shift bad debt costs to charity care may appear static. However, note that bad debt that is written off can be recovered. In contrast, regulatory and accounting guidelines prohibit nonprofit hospitals from pursuing revenue collection from charity patients and require that charity patients be notified of this determination. These guidelines prevent amounts designated and recorded as charity care from being billed to patients, collected from patients, or subsequently reclassified as potentially collectible revenue. Thus, categorizing patients as charity care has real costs in the form of foregone revenue.
We posit that bond issuance is one event during which the benefits of shifting costs to charity care plausibly outweigh the costs, by allowing nonprofit hospitals to appear both more creditworthy to investors (potentially resulting in a lower cost of debt) and more charitable to the public and regulators that approve tax exemptions. To test our expectation empirically, we examine the period surrounding nonprofit hospital tax-exempt bond issuance. Reductions to bad debt expense can reflect positively on the timing and certainty of an organization’s future cash flows and thereby improve perceived creditworthiness—a first-order concern to bond issuers. Consistent with this reasoning, we first hypothesize that nonprofit hospitals report lower-than-expected bad debt expense prior to bond issuance. Additionally, regulations require nonprofit hospitals to provide sufficient community benefits in order for tax-exempt debt to be issuedFootnote 3; this suggests that governmental and public scrutiny of the sufficiency of charitable activities will increase. Shifting expenses from bad debt to charity care could be a useful strategy for responding to this scrutiny. Accordingly, our second hypothesis predicts that nonprofit hospitals shift costs from bad debt expense to charity care prior to bond issuance.
We test our hypotheses empirically using a sample of California nonprofit hospitals during the years 2003–2013. We obtain financial data from California’s Office of Statewide Health Planning and Development (OSHPD) and match it with municipal bond issuance data from Thompson Reuters’ Securities Data Company (SDC). Following prior research, we first estimate the unexpected portions of bad debt expense (Leone and Van Horn 2005) and charity care (Vansant 2016). As lower-than-expected bad debt expense can result from cost shifting (our focus) as well as accruals manipulation (the focus of Leone and Van Horn 2005), we begin our initial examination of the data by documenting that while bad debt expense decreases prior to bond issuance, write-offs also decrease and receivables turnover ratios increase. This supports our conjecture that patient recategorization contributes to variation in bad debt expense surrounding bond issuance. In proceeding with regression analyses to test our hypotheses, we document abnormally low bad debt expense and an inverse relationship between unexpected bad debt expense and unexpected charity care prior to when hospitals issue new public debt. We interpret these findings as evidence that managers use discretion to shift bad debt expense into charity care. Thus, we identify a mechanism by which nonprofit hospitals appear to satisfy, on the surface, the demands of both regulators and creditors at a time when management is focused on minimizing the cost of debt and when maintenance of tax-exempt status is critical.
We further explore this apparent shifting in supplemental analyses. First, we find evidence that lower-than-expected bad debt expense, but not lower-than-expected charity care, is associated with a lower cost of debt. Further, the hospitals we identify as likely shifters (defined as having lower-than-expected bad debt expense and higher-than-expected charity care) obtain a lower cost of debt. These results support our premise that bond issuers shift costs from bad debt to charity care at least in part because creditors are more responsive to variation in bad debt expense than to variation in charity care. Second, we find that the “shifting strategy” is more prevalent within types of nonprofit hospitals that prior research has designated as facing greater institutional pressure. For example, nonprofit hospitals that are church-affiliated or highly dependent on donations shift to a greater extent before bond issuance. This is consistent with public scrutiny also playing a role in motivating the behavior. Finally, we consider the commonly referenced rule of thumb that nonprofit hospitals should provide charity care equal to at least 5 % of net revenues. Our evidence suggests that incentives to shift costs prior to bond issuance are more prevalent around this threshold (Colombo and Hall 1992).
Shifting between categories of uncompensated care can result in inaccurate conclusions about creditworthiness by creditors and about tax-exemption qualifications by regulators. Through tax exemptions, nonprofit hospitals can gain a competitive advantage over their for-profit counterparts and, in turn, reduce the competition for quality healthcare. Given that charity care provisions serve as the primary justification for these advantages, it is important to identify scenarios wherein charity care is reported inconsistently or opportunistically.
Our study primarily makes three important contributions. First, we add to the line of accounting research showing that the tension between multiple stakeholders in a nonprofit hospital’s operating environment influences managerial reporting behavior (Eldenburg et al. 2015; Krishnan and Yetman 2011; Vansant 2016). We empirically document a reporting strategy around an economic event that heretofore has only been documented anecdotally but has drawn much scrutiny among nonprofit hospital stakeholders and regulators.
Prior studies provide evidence that nonprofit hospitals manage bad debt expense and charity care to report near-zero profits (Leone and Van Horn 2005; Eldenburg et al. 2015), and that hospitals shifted costs between these two accounts during a reporting transition when a change in accounting and reporting guidelines presented the opportunity to do so (Eldenburg and Vines 2004). Our study builds upon these prior studies by providing the first evidence that nonprofit hospital managers shift costs between these two accounts under static reporting guidelines in order to obtain a lower cost of capital. Thus, our results inform external stakeholders who rely on accounting measurements to infer nonprofit hospitals’ social good provisions and financial health. Moreover, our findings can inform and motivate future accounting guidance and standards related to the measurement and reporting of nonprofit hospital bad debt expense and charity care.
Second, we contribute to the nonprofit research literature that debates and analyzes whether the favorable tax status of nonprofit hospitals is justified (e.g., Capps et al. 2020; Young et al. 2018; Bazzoli et al. 2010; Colombo 2006; Morrisey et al. 1996; Hansmann 1987). We provide the first empirical evidence that nonprofits strategically use accounting discretion to obtain capital, and show that, in the case of nonprofit hospitals, this is achieved by shifting costs into charity care. We contribute to this literature by documenting an instance where a nonprofit can “kill two birds with one stone,” given our findings that decreasing bad debt expense by shifting costs to charity care simultaneously lowers a nonprofit’s cost of debt and increases the amount the nonprofit is able to report in charity care (as justification for its tax-exempt benefits).
Third, the results of our study contribute to the growing literature and public debate regarding the Corporate Social Responsibility (CSR) of large, equity-owned multinational corporations. Social responsibility is explicitly assumed in the case of nonprofits, since their very missions are to provide a benefit to society in return for related tax benefits. In recent years, increased pressure on multinational corporations to be socially responsible is evident. The societal expectations of large multinational corporations and of nonprofit institutions therefore appear to be converging. Recent studies in the accounting literature examine the relationship between CSR and corporate tax avoidance (e.g., Inger and Vansant 2019; Higgins et al. 2015; Watson 2015; Lanis and Richardson 2015; Hoi et al. 2013). Since nonprofits are given preferential tax treatment in exchange for providing social goods, our findings regarding the reporting behaviors of nonprofits are relevant to this literature. Governments’ ability to incentivize large, multinational corporations to engage in CSR is primarily through preferential taxes (e.g. tax credits or subsidies). Our setting provides a powerful setting in which to examine the potential effects, on firm reporting behaviors, of such tax incentives.
2 Background and theory
2.1 Nonprofit stakeholders and competing pressures
Several groups—including management, boards of directors, community members, regulators, and creditors—play influential roles in a nonprofit’s operating environment. Nonprofit stakeholders (particularly, those other than creditors) scrutinize the merit and effectiveness of a nonprofit that is highly or even moderately profitable, because profits represent resources that were not expended in pursuit of the nonprofit’s primary mission. Constituents and regulators pressure nonprofit hospitals to provide adequate charity care, to justify the tax benefits they receive. Specifically referring to the nonprofit hospital setting, Krishnan and Yetman (2011) describe these institutional pressures as “prescriptions, social sanctions, and norms imposed by customers, donors, and other community members, who prefer that nonprofit hospitals allocate their resources toward program service rather than toward administrative or fundraising activities” (p. 1002). The proposition originates from institutional theory, which asserts that social, political, and regulatory institutions impose normative constraints on organizations (Child and Tsai 2005).
Few states impose precise charity care minimums on nonprofit hospitals. One is Texas, where hospitals are required to meet at least one of the following thresholds for charity care provision: (1) a state-assessed threshold based on community need; (2) 100% of tax-exempt benefits; or, (3) 5% of net patient revenue (Texas Tax Code Ann.§11.1801(a)). Like most other US states, California, the setting of our study, does not impose bright-line charity care requirements on nonprofit hospitals. However, state lawmakers have recently proposed a statute requiring all nonprofit hospitals to provide charity care equal to at least 5% of net revenues (Mahood 2016).
The “community benefit standard” is the primary test used by the IRS in determining whether hospitals qualify for tax-exempt status, and places heavy weight on the extent to which a hospital serves the community through charity care (Rev. Rul. 69–545). Notably, the California Health Facilities Financing Authority, the primary conduit for nonprofit hospitals to enter the municipal market in California, requires applicants to “demonstrate the performance of ‘significant community service’ in exchange for the provision of tax-exempt bond financing,” and includes several questions about charity care policies and service provisions.Footnote 4 Thus, creditors understand and expect that nonprofit hospitals will provide significant amounts of charity care. In summary, implicit expectations about charity care appear salient despite the scarcity of explicit, bright-line state or federal requirements.
Creditors represent a unique stakeholder group for nonprofits because their interests (that a nonprofit have sufficient future earnings and cash flow available to repay debt) are somewhat misaligned with those of other stakeholders (that a nonprofit provide ample unprofitable services, such as charity care). This gives rise to economic pressures that may conflict with other stakeholders’ pressures (Oliver 1991). While creditors are aware that nonprofits must provide unprofitable public goods to obtain continued tax-related benefits, a tension exists between the economic pressures of creditors and other stakeholders. Prior research finds that this existence of multiple influential stakeholders in a nonprofit hospital’s operating environment, some with competing interests, can influence managerial decision-making (Eldenburg et al. 2015; Krishnan and Yetman 2011; Vansant 2016). Specifically related to bond issuance, Beck (2018) finds that bond issuance can incentivize opportunistic reporting in the governmental setting, where managers face similar conflicts between the performance expectations of creditors and the performance expectations of citizens (who, like nonprofit stakeholders, expect near-zero profits).
2.2 Nonprofit hospital strategic reporting
Krishnan and Yetman (2011) document that nonprofit hospitals facing greater institutional pressure and receiving higher levels of donations overstate program expenses and understate fundraising and administrative expenses on the IRS Form 990. This manipulation, despite having zero net effect on reported income, allows nonprofit hospitals to appear more efficient, as it allocates a greater portion of total expenses to charitable activities. Krishnan and Yetman’s findings are consistent with Oliver (1991), who describes how organizations facing competing pressures respond strategically in order to both appeal to resource providers and minimize scrutiny.
Other research suggests that nonprofit hospitals are concerned with overall net profit. While profitable nonprofit hospitals risk attracting the ire of certain stakeholders, reporting a loss raises concerns about an entity’s ability to operate sustainably, and could negatively affect managerial compensation and increase debt costs (Bai and Anderson 2016; Gebelhoff 2015; Leone and Van Horn 2005). Leone and Van Horn document that nonprofit hospitals manage both their accruals—specifically those related to bad debt expense and third-party allowances—and their charity care expenditures to report small, positive net income (avoiding both losses and large profits).
At least three studies specifically consider how performance-related incentives relate to various stakeholder pressures in the nonprofit hospital setting. Krishnan and Yetman (2011) find that program ratio manipulation is positively associated with reliance on donations. Vansant (2016) finds evidence of upwards earnings management when the nonprofit hospital’s level of charity care exceeds institutional expectations. However, Eldenburg et al. (2015) find that nonprofit hospital managers are less likely than for-profit hospital managers to decrease charity care in order to meet performance targets. These studies demonstrate that the financial reports of nonprofit hospitals are subject to manipulation via both reporting strategies and real activities, suggesting that performance incentives in this setting are indeed salient to managers. We contribute to these streams of research by examining how nonprofit hospital managers respond when economic efficiency pressure is heightened (e.g., prior to bond issuance) and potentially competes with other nonprofit firm performance objectives.
2.3 Accounting for bad debt expense versus charity care
When a patient enters a hospital, requests medical services, and provides basic personal information, hospital policy guides the staff in making an assessment of the patient’s ability to pay, based on factors such as the patient’s income, employment status, access to insurance, and participation in government support programs. Hospital staff must use judgement in applying hospital policy in the case of “marginal” patients, who do not clearly fit into either the charity or non-charity categories. Regardless of the hospital’s determination regarding a patient’s charity status, the hospital records service revenue for the billable amount according to the hospital’s “chargemaster” (i.e., price list). If the patient is deemed a charity case, services are provided at a free or reduced price, and the unreimbursed cost (i.e., the foregone revenue) of the services is recorded in the contra-revenue account, charity care. Otherwise, the patient is billed for services, the amount billed is recorded in revenues, and any resulting receivables are included in accounts receivable aging reports and used in management’s estimate of bad debt expense (an operating expense).
Important distinctions exist between bad debt expense and charity care for financial statement users. The 2017 Audit Guide of the American Institute of Certified Public Accountants (AICPA 2017), as well as the Accounting Standards Codification (ASC) 954–310: Health Care Entities – Receivables and ASU 2014–09 Topic 606: Revenue Recognition, require that a health care entity (1) classify bad debts as an operating expense, (2) eliminate charity care from both revenues and receivables, and (3) clearly disclose the charity care policy and the amount of charity care provided. By definition, charity care is for patients who are deemed unable to pay prior to the provision of services, whereas bad debt relates to patients who are, at least initially, deemed able to pay. Collection efforts are not pursued for charity patients but are vigorously pursued for non-charity/bad debt patients. Bad debt expense creates uncertainty about future cash flows because the quality of management’s estimates of revenue collectability is unknown to financial statement users. Charity care, in contrast, is not an estimate but reflects the actual, non-billable services provided to charity patients during the period. A large bad debt expense could reflect poorly on management’s ability to identify patients who should qualify for charity care or to collect from patients who should not qualify. Management cannot control the credit quality of patients requesting service. Thus, charity care is less likely than bad debt expense to cast doubt on managerial ability. Media reports allege (Hamill 2016), and the authors’ own conversations with nonprofit hospital managers suggest, that it is commonplace for nonprofit hospitals to reduce bad debt expense by reclassifying accounts with particularly low expected collectability from bad debt expense to charity care. However, these claims have not been empirically tested by prior research.Footnote 5
3 Hypotheses
One challenge in investigating hospitals’ shifting from bad debt to charity care is that, to some degree, nonprofits always have incentives to increase charity care (possibly through reclassifying bad debt). However, as previously described, the shifting strategy can impose significant costs if the hospital ceases collection attempts over reclassified accounts that might otherwise have been successful. Thus, in considering whether managers shift costs from bad debt to charity care, our empirical design requires us to identify a condition wherein incentives to engage in such behavior are heightened. We examine tax-exempt bond issuance.
Although both charity care and bad debt decrease income, we conjecture that creditors are more attentive to bad debt expense than charity care because bad debt is more relevant for evaluating managerial ability, revenue quality, and the reliability of future cash flows to service debt. Consistent with our expectation, we find anecdotal evidence that bond rating agencies (e.g., Moody’s 2012; Standard and Poor’s 2017), professional industry organizations (e.g., AHA 2017), and academic publications (e.g., Gapenski and Reiter 2016) frequently list receivables turnover as a key ratio for analyzing hospital performance, but they do not list metrics specifically related to charity care. Given that nonprofit hospital managers face economic pressure to minimize the cost of debt when entering the public debt market, we expect that nonprofit hospitals report abnormally low bad debt expense prior to bond issuance. This leads to our first hypothesis (stated in the alternative form):
-
H1. Nonprofit hospital managers minimize bad debt expense prior to bond issuance
Managers can minimize bad debt through discretion over accruals by overestimating the credit quality of the non-charity patient pool, resulting in an artificially low bad debt expense (Leone and Van Horn 2005). However, while net income improves as a result of an accrual manipulation strategy, the receivables turnover ratio declines, because net accounts receivable includes accounts with a low likelihood of collection. Thus, managing bad debt expense through pure accruals manipulation may not be a viable strategy to improve the appearance of creditworthiness. We reason that nonprofit hospital managers have incentives to manage bad debt expense in ways that would be difficult for creditors to detect.
Prior research documents evidence suggesting that nonprofit hospitals reclassified costs from bad debt to charity care in response to a 1990 change in hospital accounting guidelines (Eldenburg and Vines 2004). We argue that nonprofit hospital managers can also reclassify costs between these two accounts without (or independent of) a change in accounting and reporting guidelines. Another strategy available to nonprofit hospital managers is to recategorize non-charity patients as charity patients. This shifting strategy can be accomplished either ex ante, through staff’s judgement in categorizing marginal patients at the point of service, or ex post, when payments become delinquent or new information decreases expected collectability. This type of shifting legitimately justifies a decrease in the bad debt estimate, because the average credit quality likely improves for the pool of remaining non-charity patients. The income effect of this strategy could be neutral or even negative, if the increase in charity costs exceeds the reduction in bad debt expense. However, other metrics that are important to creditors (e.g., receivables turnover, days’ cash on hand, write-offs, operating expenses) would likely improve, leading creditors to form a favorable view of management. In contrast, minimizing bad debt expense through accrual manipulation alone results in higher reported income, which contradicts other stakeholders’ normative expectation that nonprofit hospitals should expend excess resources on charity care (resulting in near-zero income). These competing expectations in effect constrain nonprofit hospital managers’ incentives to satisfy creditors by inflating income.Footnote 6
Shifting costs to charity care, rather than using discretion over bad debt accruals exclusively, makes earnings management more difficult to detect, because the reductions to bad debt expense are corroborated by lower write-offs and higher receivable turnovers. Such a response is consistent with extant theories of organizational behavior regarding managerial behavior when stakeholder pressures (e.g., to maximize income to secure financing versus to minimize income and produce public goods) diverge (e.g., Oliver 1991). We argue that shifting costs from bad debt to charity care is a convenient and low-cost strategy that has the advantage of appealing to resource providers (creditors) while avoiding scrutiny from other stakeholders. This leads to the following hypothesis (stated in the alternative form):
-
H2. Nonprofit hospital managers shift expenses from bad debt expense to charity care prior to bond issuance
4 Sample data and empirical method
4.1 Sample data
4.1.1 Hospital financial data
We obtain financial and utilization data for private nonprofit hospitals from the Office of Statewide Health Planning and Development (OSHPD) in the state of California. OSHPD is a state-run entity that collects detailed utilization information (e.g., number and type of treatments provided, facilities available, inpatient capacity, specialists available) and audited financial data for all public and private acute care hospitals in California. Prior accounting research that examines nonprofit hospital reporting behavior (e.g., Eldenburg et al. 2011; Krishnan and Yetman 2011; Vansant 2016) also uses the OSHPD dataset. Broader nonprofit accounting research (not specific to hospitals) more commonly uses financial data from the IRS 990. Krishnan and Yetman (2011) find significant differences between the numbers reported by California nonprofit hospitals in the IRS 990 compared with OSHPD. They highlight that OSHPD data reported by nonprofit hospitals adheres to strict accounting guidelines, whereas IRS 990 reporting guidelines are more interpretive; and that, in addition to audits by external audit firms, California state agencies audit 100% of OSHPD reports and perform site visits to validate accounting records, whereas less than 1% of IRS 990 s are audited.Footnote 7 When nonprofit hospitals issue bonds, the official statement—the disclosure document accompanying the bond—contains the most recent audited financial statements. Given these differences, we believe the OSHPD data provides a more accurate representation of the financial data considered by creditors (in other words, the audited financial statements) than the IRS 990 data does.
Our sample period begins with the 2003 fiscal year, which is the first year for which OSPHD data is electronically available, and ends with the 2013 fiscal year.Footnote 8 We select this sample period because during the 2003–2013 time period, the OSHPD reporting manual was not substantially changed, and the data fields in the reported electronic data are consistent. Further, the end of the sample period is prior to the January 1, 2014, implementation of many of the key provisions of the Affordable Care Act (ACA). The ACA included the expansion of California’s Medicaid program along with the individual mandate to obtain insurance, either of which could impact cross-sectional variation in bad debt expense and charity care in the adjustment period.
We construct a panel that includes income statement and balance sheet data, detailed Medicaid, Medicare, and charity care expenses, and care utilization data. OSHPD reports data at the hospital level (actual physical locations) as opposed to the health care system level. As a result, system hospitals with multiple physical locations are represented multiple times. In the bond data, we find that either whole hospital systems or specific system locations can be listed as beneficiaries. We manually identify the hospital systems in our data and aggregate their component hospital data to one observation per year. Our approach reflects the fact that the geographic locations are part of a legally consolidated entity and that the system as a whole essentially guarantees the debt of its members.Footnote 9 We identify 73 hospital systems in our data, with an average of 9.94 locations per system. Our final panel consists of 1631 hospital-year observations, of which 70% are non-system hospitals and 30% are system aggregates. For brevity, we refer to both individual hospitals and aggregated system hospitals simply as “hospitals” or “nonprofit hospitals.”
4.1.2 Bond issuance data
Nonprofit bond issuances are generally conducted as follows (Wedig et al. 1996)Footnote 10: a local government or state financing authority acts as a conduit for a nonprofit organization to access the tax-exempt bond market.Footnote 11 The nonprofit agrees to use the bond proceeds to fund a project that provides community benefit. After the bond issuance, the conduit monitors the issuing nonprofit’s compliance with the agreement, and the nonprofit is responsible for principal and interest payments.
We obtain municipal bond issuance data from Thompson Reuters’ SDC. SDC contains two primary identifiers associated with a municipal bond issue: beneficiaries and sponsors. In the context of hospital bond issues, the beneficiary is the hospital receiving the funds and is responsible for making payments on the debt. The sponsor is the municipal entity or state financing authority (henceforth “conduit”) through which the hospital accesses the municipal bond market. The conduit is responsible for ensuring that the hospital meets the requirements for issuing tax-exempt debt, but does not guarantee the debt.
No identifying key links the SDC data set to the OSHPD data,Footnote 12 and the beneficiary name in SDC does not consistently conform to any of the name identifiers in the OSHPD data. To match the SDC bond data to the OSHPD financial data, we first identify 435 bond issuances that have (a) a tax-exempt beneficiary located in California,Footnote 13 (b) general use of proceeds designated as healthcare,Footnote 14 and (c) an offering date falling within the 2003–2013 fiscal year sample period. We then hand-match the bond issuance data from SDC to the financial and utilization data from OSHPD with the assistance of a text-matching algorithm that measures the extent to which the SDC beneficiary name resembles one of the three available OSHPD name fields (legal, business, parent). The resulting pool of municipal bond issues consists of 127 individual bond issuances.
4.2 Modeling bad debt and charity care
We estimate the expected levels of bad debt expense and charity care using Models 1 and 2, respectively. The residuals from the models represent abnormal levels of bad debt expense and charity care and serve as a proxy for management’s discretion over the accounts. Following Leone and Van Horn (2005), we estimate discretionary bad debt expense for hospital i in fiscal year t as the residual of the following ordinary least square (OLS) regression for each fiscal year in our sample:
Model 1 presumes that the dependent variable, bad debt expense (BDE), remains constant from year to year absent any changes to a hospital’s revenue stream. Thus, all Model 1 variables are measured as the change from fiscal year t-1 to fiscal year t. Controls include changes in net revenues (NetRev), Medicare revenues (MedicareRev), and Medicaid revenues (MedicaidRev). Insurance adjustments related to Medicare and Medicaid patients could be substantial, thus altering the makeup of the revenue stream and expected bad debts.Footnote 15 All of the variables in Model 1 are scaled by lagged total assets. Detailed variable definitions are in Appendix 1 Table 9; results of Model 1 run on the pooled sample are in Appendix 2 Table 10, column 1. We estimate Model 1 by fiscal year using our full panel of observations, retaining the residual for each observation as our proxy for the abnormal (or discretionary) portion of bad debt expense (DBDE). Positive (negative) values of the residual indicate that bad debt expense is higher (lower) than expected.
We follow Vansant (2016) to estimate a hospital’s abnormal level of charity care using the following OLS regression:
The dependent variable is current period charity care (CC) scaled by lagged total assets.Footnote 16 Vansant (2016) theorizes that nonprofit hospitals provide the level of charity care necessary to meet society’s normative expectations, which are based on the amount of tax exemptions the hospital receives, the hospital’s capacity to provide charity care, and the characteristics of the community it serves. Model 2 controls for variables that are likely associated with these normative expectations.Footnote 17 Gross revenues (GrossRev) and the number of beds in the hospital (Beds) relate to the amount of tax exemptions a hospital receives and its capacity to provide charity care, respectively. The percentage of the hospital’s service area population that is uninsured (UninsPop) and the percentage of revenues derived from Medicare and Medicaid patients (MedRev) proxy for the need for charity care in the community the hospital serves. Although stakeholders are exogenous to a hospital’s decision regarding the provision of current period charity care, they may form expectations about acceptable levels of charity care, based on four considerations: 1) whether the hospital has the facilities to treat often-expensive, trauma-related injuries (Trauma); 2) whether it is a teaching hospital (Teach); 3) whether it has fewer than 25 beds (Small); and 4) the average length of a patient stay (AvgStay).
The results of Model 2 run on the pooled sample are found in Appendix 2 Table 10, column 2, and are similar to those reported by Vansant (2016). Similar to Model 1, we estimate Model 2 by fiscal year to obtain the residuals, which we use to measure the abnormal (discretionary) level of charity care (DCC) provided by the hospital. Positive (negative) residuals suggest that the hospital reports a higher (lower) level of charity care than expected.Footnote 18 In untabulated results, we also estimate our DBDE model (Eq. 1) with the hospital characteristic variables from the DCC model (Eq. 2) in order to more robustly model the credit risk associated with a hospital’s patient base. The findings in this paper are robust to this modified discretionary bad debt expense model.
4.3 Hypotheses tests
Our first hypothesis predicts that nonprofit hospital managers reduce bad debt expense prior to bond issuance. We test H1 using Model 3:
The residual from Model 1—discretionary bad debt expense (DBDE) in year t—is the dependent variable. The independent variable of interest is the indicator BondIssue (β1), which takes on a value of one when a hospital issues a bond.Footnote 19BondIssue is measured in year t + 1 because creditors are likely to use the hospital’s most recent accounting reports when evaluating the proposed issuance. Therefore, if managers use discretion with the goal of decreasing the cost of debt, financial performance in the period immediately prior to the issue is of primary importance. A significant negative coefficient on BondIssue is consistent with hospitals systemically underreporting bad debt expense prior to bond issuance.
Consistent with prior accrual earnings management research (e.g., Leone and Van Horn 2005), we control for reversals of prior period earnings management (lagged DBDE) and prior year performance (lagged ROA). We include Beds to control for size, and System (an indicator variable) to control for whether a nonprofit hospital is a member of a hospital system. Detailed variable descriptions are found in Appendix 1 Table 9. We include year fixed effects and cluster standard errors at the hospital level.
Our second hypothesis predicts that prior to bond issuance, managers shift costs from bad debt expense to charity care. To test H2, we use variations of Model 4:
The residual from Model 2—discretionary charity care (DCC) in year t—is the dependent variable. The primary independent variable of interest is the interaction term BondIssue*DBDE (β1), which we interpret as the change in the relationship between DBDE and DCC in the fiscal year prior to a bond issuance event. We expect the coefficient on the term to be negative, indicating that, prior to a bond issue, discretionary charity care increases as discretionary bad debt expense decreases. Such a result would be consistent with a managerial strategy of shifting from bad debt expense to charity care. Hospital Controls includes variables that are plausibly associated with both bond issuance and shifting incentives: lagged ROA controls for prior period performance; charity care (CCRevs) and bad debt expense (BDERevs), both scaled by revenues,Footnote 20 control for the relative significance of uncompensated care to total revenues; and Beds controls for size. We also include System and year fixed effects and cluster standard errors by hospital.
If nonprofit hospitals begin planning bond issuances and shifting costs far in advance, incremental shifting immediately prior to the issuance may be difficult to detect. We thus examine both short- and long-window specifications of Model 4. The short-window specification is as written, with all variables measured in year t, whereas in the long-window specification, we measure DCC and DBDE cumulatively over the three years leading up to the bond issue (from t-2 to t).
4.4 Endogeneity concerns
The extent to which a hospital’s likelihood of entering the bond market correlates with unobserved incentives for managerial discretion could create self–selection bias in our research design. We compare the mean characteristics of issuers versus non-issuers, and find that issuers are significantly larger, have higher revenues and expenses, provide more charity care, and are more likely to be categorized as teaching, trauma, or system hospitals (results are provided in Appendix 4 Table 12). This highlights the importance of addressing endogeneity in our research design.
We take two additional steps to alleviate concerns that our results are driven by differences between hospitals that are and hospitals that are not bond market participants (rather than being driven by heightened incentives to use discretion in bond issuance years). First, we perform our tests on a reduced sample consisting only of hospitals that issued bonds during the sample period, so that BondIssue effectively partitions between bond market participants in the years they do versus do not issue bonds. Second, we use a two-stage Heckman approach to control for self-selection (Lennox et al. 2012; Heckman 1979). Model 5 is a probit model that predicts a hospital’s likelihood of issuing a bond during our sample period (Issuer = 1). We use lagged cash scaled by total assets (Cash) as our exclusion restriction because it is a significant predictor of bond issuance, but it is not a significant predictor of the dependent variables in our main models (Models 3 and 4).Footnote 21 Other variables are included in our main models and are previously defined.
Results of the first stage selection model in each of our main analyses are provided in Appendix 3 Table 11. In addition to suggesting that our exclusion restriction, Cash, is positively associated with entering the bond market, the results suggest that size (measured as Beds) and charity care are also positively associated with nonprofit hospital debt market participation.
When a hospital issues a bond to finance a project, the type of project and its eventual completion could feasibly impact patient revenue streams. For example, uncompensated care might be affected differently by expanding an emergency room than by expanding a cosmetic surgery facility. Our bond issuance data provides limited detail about the specific purpose of an issuance,Footnote 22 so we cannot directly examine these possibilities. To alleviate concerns about how bond issuances might lead to fundamental changes in hospital operations that might influence our results, we compare the characteristics (e.g., revenues, bad debt expense, charity care, size, etc.) of bond-issuing hospitals in our sample before versus after bond issuance and find no statistically significant differences. Results are found in Appendix 4 Table 12.
4.5 Descriptive statistics
Table 1 Panel A provides descriptive statistics for the variables used in Models 1–4. The hospitals in our sample report mean gross revenue (net revenue) of $1,126.63 million ($309.16 million), suggesting that approximately 70% of revenues are not realized. The nonprofit hospitals are profitable on average, reporting mean return on assets of approximately 4%. The hospitals in our sample have a mean (median) of 378 (167) beds, and the mean (median) patient stay is 8 (4) days.Footnote 23 Mean bad debt expense and charity care are similar—$20.8 and $22.3 million, respectively. However, median bad debt expense ($7.3 million) exceeds median charity care ($3.1 million). Seven percent of our fiscal year observations are associated with a bond issue. Because discretionary bad debt expense (discretionary charity care) is estimated using the residuals of Model 1 (2), the mean is zero by construction.
Table 1, Panel B provides selected Pearson correlation coefficients between the variables used in our main analyses. Bad debt expense and charity care are positively correlated with their unexpected counterparts (DBDE and DCC) (p value<0.10), consistent with Vansant (2016). Bad debt expense is negatively correlated with BondIssue, but charity care is not—consistent with our logic that bad debt expense is more relevant to the debt market. However, discretionary bad debt expense is not significantly correlated with BondIssue or discretionary charity care. BondIssue is positively associated with Beds and System, suggesting that larger hospitals are more likely to issue public debt. The variance inflation factors are below for all four coefficients in each regression model, suggesting that multicollinearity is not a significant concern.
Figure 1 compares a timeline of discretionary bad debt expense (scaled by assets) for issuers in pre- and post-issuance years, compared with the non-issuer control sample. For bond issuers, average discretionary bad debt expense appears to decline prior to bond issuance and increase immediately afterward. Figure 2 and Fig. 3 show that receivables turnover ratios increase, and write-offs decrease, around bond issuance. In contrast, the control sample displays little variation in bad debt expense, receivables turnover, or write-offs. As previously discussed, if nonprofit hospital managers use only discretionary accruals to minimize bad debt expense, accounts receivable turnover should decrease and the amount of accounts written off should not change (since the bad debt expense accrual has no true influence over the actual amount of uncollectible accounts that materialize). However, if nonprofit hospital managers recategorize accounts with low expected collectability as charity care, then accounts receivable may increase and write-offs may decrease due to improved credit quality of the non-charity patient pool. Thus, the visual evidence provided in Figs. 1, 2 and 3 is generally consistent with the possibility that nonprofit hospital managers shift bad debt costs elsewhere in the financial statements.

Figure 1 visualizes the average discretionary bad debt expense (DBDE) for issuers versus non-issuers. Year t is the year in which BondIssue = 1 (the year immediately preceding the bond issuance). The graph plots the average discretionary bad debt expense for issuing hospitals versus a control sample of non-issuers two years prior to the year that BondIssue = 1 at the point t-2, for one year prior to the year that BondIssue = 1 at the point t-1, and so on. Observations are excluded if the hospital also issues a bond in year t (since it would be unclear whether the discretionary bad debt expense relates to the current bond issuance or an issuance that occurred or will occur in another year)

Figure 2 visualizes the average receivables turnover ratio (calculated as net revenues divided by average accounts receivable) for issuers versus non-issuers. Year t is the year in which BondIssue = 1 (the year immediately preceding the bond issuance). The graph plots receivables turnover ratios for issuing hospitals versus a control sample of non-issuers two years prior to the year that BondIssue = 1 at the point t-2, for one year prior to the year that BondIssue = 1 at the point t-1, and so on. Observations are excluded if the hospital also issues a bond in year t (since it would be unclear whether the discretionary bad debt expense relates to the current bond issuance or an issuance that occurred or will occur in another year)

Figure 3 visualizes the receivable write-offs (calculated as the change in the allowance for uncollectible accounts that are not accounted for by increases to bad debt expense and scaled by gross revenues) for issuers versus non-issuers. Year t is the year in which BondIssue = 1 (the year immediately preceding the bond issuance). The graph plots receivables turnover ratios for issuing hospitals versus a control sample of non-issuers two years prior to the year that BondIssue = 1 at the point t-2, for one year prior to the year that BondIssue = 1 at the point t-1, and so on. Observations are excluded if the hospital also issues a bond in year t (since it would be unclear whether the discretionary bad debt expense relates to the current bond issuance or the issuance that occurred or will occur in another year)
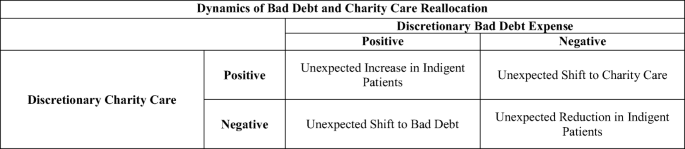
Figure 4 illustrates how the dynamics of bad debt and charity care reallocation may be inferred from the signed residuals of Models 1 (discretionary bad debt expense) and 2 (discretionary charity care)
5 Results
5.1 Main tests
5.1.1 Test of H1
Our predictions rest on the logic that nonprofit hospital managers have incentives to reduce bad debt expense prior to bond issuance. We predict, in our first hypothesis, that discretionary bad debt expense will decrease prior to issuance, and we test this prediction using Model 3. We present the results in Table 2.
In column 1, we estimate Model 3 over our full panel of data. The coefficient on BondIssue in column 1 is negative and significant (−0.009, p value <0.05), suggesting that issuing hospitals have lower discretionary bad debt expense in the year prior to issuance. Throughout our results in Table 2 and in the following tables, we present additional columns with results that address possible selection bias for hospitals entering the bond market. For example, in Table 2 column 2, we estimate Model 3 on only the subsample of issuers in our panel (reducing our sample to 457 observations). We then include the results using the full panel with the inclusion of Lambda, the standardized residuals from Model 5 that control for self-selection, in column 3. We continue to find a negative and significant coefficient on BondIssue in column 2 (−0.009, p value <0.10) and column 3 (−0.010, p value <0.10). For brevity, we exclude further discussion of these additional specifications in our remaining tests unless the results are not consistent. The results in Table 2 support our prediction that issuers systematically underreport bad debt expense prior to bond issuance (H1).
Managers’ incentives to manipulate charity care directly (as opposed to indirectly by shifting costs from bad debt) prior to bond issuance are unclear, as charity care provides limited inference to creditors over the uncertainty of future cash flows and managerial competence. We thus do not hypothesize on the existence or direction of an association between unexpected charity care and bond issuance. In an untabulated analysis, we estimate the model after replacing DBDE with DCC and find that the coefficient on BondIssue is insignificant.
5.1.2 Test of H2
Our second hypothesis concerns the potential shift to charity care as a mechanism for reducing bad debt expense. We predict an inverse relationship between the unexpected portions of bad debt and charity care prior to bond issuance and use Model 4 to test our prediction. The short-window results are presented in Table 3, and the long-window results are in Table 4.
In Table 3, we model the relationship between DCC and DBDE in the fiscal year immediately prior to bond issuance using the full panel of hospital observations. In column 1 (full sample), the interaction term coefficient of −0.303 (p value <0.05) suggests that for every dollar reduction in DBDE, managers increase DCC by approximately 30 cents in the fiscal year immediately prior to a bond issue. A directional chi-squared test (untabulated) of the sum of the DBDE and interaction term coefficients provides marginal evidence that the association between DBDE and DCC is negative prior to bond issuance (p value = 0.06). The interpretation supports our hypothesis that managers shift costs from bad debt expense to charity care in the year prior to issuance.
We next estimate Model 4 over the three years (rather than one year) prior to bond issuance, in order to examine longer-term trends of the relationship between discretionary charity care and discretionary bad debt expense.Footnote 24 We report the results of this estimation in Table 4. Similar to the results in Table 3, we find evidence of a significant negative association between DBDE and DCC in in pre-issuance time period. The interaction coefficient is negative and significant at the 1 % level (−1.972, p value <0.01). When combined with the DBDE coefficient, the results suggest that discretionary charity care increases by approximately $2.02 for every dollar that discretionary bad debt expense decreases in the aggregated three years prior to bond issuance.Footnote 25 This is consistent with idea that cost shifting occurs through the recategorizing of patients, because charity care costs as a proportion of charity patient service revenues is much higher (up to 100%) than bad debt expense as a proportion of non-charity patient service revenues. We do not find evidence of cost shifting in Tables 3 or 4 in non-issuance years—the coefficient on DBDE is either positive or insignificant. Together, the results suggest that acquiring debt is at least one driver of the hypothesized shifting strategy and provide evidence that managers shift bad debt expense to charity care for up to three years preceding a bond issuance.Footnote 26
5.2 Additional analyses
5.2.1 Unexpected bad debt expense and the cost of debt
Given that our main tests document that nonprofit hospitals report lower-than-expected bad debt expense prior to bond issuance, we investigate whether lower-than-expected bad debt expense results in a lower cost of debt. Prior research characterizes the nonprofit setting as a low-information environment and finds that donors have difficulty disentangling complex accounting estimates (Yetman and Yetman 2013). Even in the corporate setting, where the information available is far more robust, public firms are able to successfully obtain a lower cost of debt through earnings management (Jiang 2008; Liu et al. 2010). We examine the association between discretionary bad debt expense and cost of debt using Model 6 on a sample of bonds issued (i.e., bond issuance years only) during the sample period.
Cost of debt at the time of issuance (CostOfDebt) is measured as the underwriter’s gross spread, which is the underwriter’s compensation for issuing the bond. Prior research (Tanner 1975; Sorensen 1980; Chen and Ritter 2000; Butler 2008; Kim et al. 2008) utilizes gross spread as a measure of cost of debt that is closely related to effective interest costs and bond ratings.Footnote 27 We obtain the data from the SDC Platinum municipal bond database and drop 25 bond observations for which gross spread data is missing, resulting in a sample size of 98. As in the main analyses, CostOfDebt is measured in year t + 1. The variable LowDBDE takes on a value of one when, in the fiscal year immediately prior to the bond issue (designated as year t), the hospital issuing the bond is in the lowest tercile of DBDE of the full sample.Footnote 28 We focus our test on hospitals reporting bad debt expense substantially lower than expectations, because these hospitals are the ones most likely, within the sample, to have exercised significant discretion in order to improve performance metrics such as net income or receivables turnover. A negative, significant β1 indicates that the hospitals exercising the most income-increasing discretion over bad debt expense obtain a lower cost of debt.
We control for hospital– and bond issue–related variables that may also affect the cost of debt and the amount of abnormal bad debt expense. As in the main analyses, Hospital controls includes lagged ROA, current period charity care (CCRevs), and bad debt expense (BDERevs) as proportions of revenues, Beds, and System. Additionally, we include Teach, to control for affiliation with a larger institution (which could decrease default risk), and Cash, to control for liquidity. Issue controls includes characteristics of the bond issuance (Principal, AAARating, and Maturity) that impact the cost of debt, based on extant research. We also include calendar year fixed effects, to control for time trends in market interest rates, and we cluster standard errors at the hospital level.Footnote 29
We report Model 6 results in Table 5. In column 1, LowDBDE is negative and significant (−1.319, p value <0.05) both statistically and economically. Hospitals with significantly lower-than-expected bad debt expense obtain a gross spread that is approximately 26% lower than the average.Footnote 30 Although we acknowledge that our setting limits our ability to establish a causal relationship, the results from this model are consistent with the notion that underreporting bad debt expense could result in a lower cost of debt.
The premise of our hypotheses is that shifting to charity care offers a convenient and low-cost tool for minimizing bad debt expense and lowering the cost of debt. This rationale does not provide a clear motive for nonprofit hospitals to directly manipulate charity care. However, one counterargument is that lower-than-expected charity care may reflect favorably on creditworthiness, as it suggests that a hospital’s future cash flows will be less constrained by its charitable activities. Alternatively, and in line with the findings of corporate social responsibility research (e.g., Ge and Mingzhi 2015), purchasers of nonprofit hospital bonds may value charitable activities and reward higher-than-expected charity care with a lower cost of debt. To investigate, we replace LowDBDE with LowDCC (HighDCC) in Model 6, with LowDCC (HighDCC) being equal to one for hospitals in the lowest (highest), most negative (positive) tercile of DCC. We report the results in columns 2–5 of Table 5. The results in each column suggest that unexpected charity care is not significantly associated with the cost of debt; this complements our previously reported findings that nonprofit hospitals report lower-than-expected bad debt expense, but not unexpected levels of charity care, prior to bond issuance.
Finally, we directly test whether discretionary “shifting” between charity care and bad debt prior to bond issuance is associated with a lower cost of debt. In any given year, the residuals from our DBDE and DCC models can resolve in one of four ways outlined in Fig. 4. In Fig. 4, the top left and bottom right quadrants represent conditions where the residuals resolve with the same signs. If both residuals resolve as positive, the hospital provides more charity care than expected and also experiences higher levels of bad debt than expected. This is consistent with an influx of indigent patients. Likewise, if both residuals resolve as negative, the hospital provides less charity care than expected and collects better than expected. This is likely to occur when there is a reduction in indigent patients. The top right and bottom left corners represent when the residuals resolve with opposite signs. When DCC is negative and DBDE is positive, this represents a shift in hospital policy to provide less charity care than expected and to recognize more bad debt than expected, consistent with the hospital having a less generous charity care policy. Similarly, when DCC is positive and DBDE is negative, this indicates that the hospital has provided more charity care than expected in the year and has experienced better than expected collections, consistent with the shifting behavior we are concerned with in this paper. Thus, we define a new indicator variable, Shift, that takes on a value of one in hospital years represented by the lower left quadrant in Fig. 4.
In column 6 of Table 5, we include an interaction of LowDBDE and Shift. We find that this interaction subsumes the results of LowDBDE, suggesting that the reduction in the cost of debt is concentrated in hospitals that engage in shifting behavior prior to bond issuance.
5.2.2 Hospital incentives to shift costs
Krishnan and Yetman (2011) find that certain institutional pressures result in cost shifting from administrative and fundraising costs to program expenses on the IRS 990. They measure cost shifting as the difference between the program ratio (the ratio of mission-related expenses to total expenses) computed using IRS 990 data versus using OSHPD data,Footnote 31 and find that nonprofit hospitals facing high institutional pressure more readily manipulate the program ratio. In an additional analysis, we investigate whether Krishnan and Yetman’s (2011) findings regarding cost shifting from non-program to program expenses on the IRS 990 extend to discretionary cost shifting from bad debt to charity care within the financial statements.
We run five additional specifications of Model 4, each with an indicator variable representing a category of nonprofit hospitals examined by Krishnan and Yetman (2011). Following their rationale, we consider the following categories: (1) church hospitals, (2) rural hospitals, (3) system hospitals, (4) hospitals in the highest quartile of total Medicaid and Medicare revenue relative to gross revenue (which Krishnan and Yetman argue face higher regulatory scrutiny), and (5) hospitals above the median in total donations to gross revenues (which Krishnan and Yetman associate with greater economic incentives to shift costs). We interact these indicator variables with BondIssue, DBDE, and BondIssue*DBDE, with the latter resulting in a triple interaction. The negative sign on BondIssue*DBDE (untabulated) remains negative, consistent with the main analyses. Thus, a negative (positive) triple interaction coefficient suggests that the shift from bad debt to charity care is more (less) prevalent under the specified type of institution.
Table 7 summarizes the results (including the main effect and interactions with the main effect) of these five specifications. Each of the five triple interaction coefficients, with the exception of the interaction with Rural, is negative and significant. In the case of the indicators for church hospitals and system hospitals (columns 1 and 3), this evidence is consistent with Krishnan and Yetman’s (2011) findings that incentives to manipulate expenses are greater for nonprofit hospitals facing higher levels of normative institutional pressure. In contrast, our finding in column 4—that nonprofit hospitals with high proportions of Medicare and Medicaid revenues (and presumably, greater regulatory scrutiny) shift costs more—is in contrast with Krishnan and Yetman, who find that these organizations shift costs less on the IRS 990. One explanation for these different findings is that regulators view recategorizing non-charity patients as charity patients favorably because it results in more patients receiving free or discounted care. Even if the strategy is opportunistic and only pursued in select years, providing more charity care is consistent with regulators’ preferences. In contrast, the IRS 990 expense-shifting documented by Krishnan and Yetman is purely an accounting manipulation. Nonprofit hospitals facing high regulatory pressure to provide charity care may enjoy additional benefits of using the cost-shifting strategy to satisfy regulator expectations. Finally, the triple interaction containing the indicator for high reliance on donations (column 5) is negative, consistent with Krishnan and Yetman, who use donations reliance to capture economic incentives.
As supplemental evidence of incentives for cost shifting, we consider the 5 % charity care threshold. As previously discussed, a widely referenced (though rarely formally enforced) rule of thumb is that, to participate in tax exemptions such as municipal bond issuance, nonprofit hospitals should provide charity care that is equal to at least 5 % of total revenues. California legislators have attempted to codify this threshold in law but have so far been unsuccessful, and the conduits remain flexible about the level of charity care that must be provided for participation (Mahood 2016). However, as the 5 % benchmark appears to be widely prevalent, we use it as an implicit charity care target for hospital managers going to the bond market. For each observation in our sample, we calculate the distance to the 5 % charity care to revenue threshold as the variable Distance. We then modify Model 4 by replacing DBDE with Distance for all hospital observations that fall below the threshold. We present the results of this analysis in Table 7. These results suggest that hospitals further from the threshold prior to bond issuance report significantly higher discretionary charity care, all else equal.
In our main results, we document how a different economic incentive (bond issuance) influences a different type of cost shifting (between categories of uncompensated care). Overall, our results extend Krishnan and Yetman’s (2011) findings and provide evidence of how nonprofit hospital managers use discretion to report favorable results and to respond to external pressure from stakeholders.
6 Conclusion
In exchange for the provision of social goods, nonprofit organizations receive a number of economically valuable tax benefits, including access to the tax-free municipal bond market. Anecdotal evidence suggests that it is common for nonprofits to “window dress” their financial reports around a bond issuance. We test this assertion and whether such window dressing lowers nonprofit debt costs. Using a sample of nonprofit hospitals located in California, our evidence suggests that nonprofit hospitals use discretion to shift costs from bad debt expense to charity care in anticipation of entering the bond market. The cost shifting appears to begin as early as three years prior to the bond issuance, reverses during the subsequent three years, and is associated with a lower cost of debt. Our results contribute to the accounting research literature that investigates nonprofit incentives and accounting discretion as well as nonprofit hospital accounting and reporting. Our study also informs a growing stream of research that examines how social output is measured and associated with the extent of taxes paid.
Our study has important implications for public policy and the supply of capital among nonprofits. The strategy of shifting costs from bad debt to charity care prior to bond issuance could lead to suboptimal resource allocation by creditors. Bad debt expense creates uncertainty about future cash flows that are required for repaying principal and interest. If managers shift expenses opportunistically, the implied certainty of realizing non-charity patient revenues temporarily increases before bond issuance but returns to normal levels in future years. Therefore, any creditor projections of cash flows on future non-charity care related revenues would be overstated.
As the first to explore the link between tax-exempt bond issuance and managerial discretion in the nonprofit hospital setting, our study serves a timely purpose. Regulators, donors, legislators, and community members often challenge the merit of the numerous public policy benefits that nonprofit hospitals receive, including access to the tax-exempt debt market. By demonstrating that entering the tax-exempt debt market incentivizes strategic expense reporting, our study contributes to this debate. However, we acknowledge that our study utilizes sample data from a single state (California) and that our results and inferences may not extend to other states’ regulatory settings. We believe the California environment is largely representative in regard to both the regulatory pressures to provide charity care and the tax-exempt debt market expectations that nonprofit hospitals face in other US municipalities. Nevertheless, given the economic importance of nonprofit hospitals within the healthcare system, further study using data from other locations is warranted.
Finally, the findings from our study can inform the research literature and regulatory oversight with regard to the intersection of tax avoidance and CSR by large multinational corporations. Within our setting, we demonstrate a systematic strategy, by nonprofits, to overstate socially responsible performance around discrete events (i.e., bond issuances), and show that this behavior persists within a regulatory regime over a relatively long period, despite awareness raised by the popular press. Similar instances likely exist in corporations seeking tax benefits that are tied to specific (and discrete) CSR investments.Footnote 32 Therefore, our results have possible implications regarding the optimal design of CSR-related tax exemptions and subsidies. For example, a claw-back period may be necessary if these types of tax exemptions are granted around discrete event.
Notes
As described by the Congressional Budget Office (CBO 2006), “[u]ncompensated care refers to the sum of charity care (services for which a hospital does not expect payment) and bad debt (services for which a hospital expects but does not collect payment)” (2006, p. 2).
Federal law technically only allows municipal entities direct access to the municipal bond market. Nonprofits enter the market via conduit arrangements with a municipal entity. The state or municipal financing conduits are held responsible to ensure that the nonprofit is eligible for federal and state tax exemptions and that the project financed provides community benefit. We provide further description of these arrangements in Section 4.
The application requires the previous three years of audited financial statements (which include reported charity care), along with written statements regarding a hospital’s current charity care policies.
In fact, many hospitals now invest in costly information technology to identify charity patients. For example, the University of Pittsburgh Medical Center began using “presumptive eligibility” algorithms in 2007 to identify charity patients that otherwise would not be identified and therefore would be classified as bad debt. Because the timing of the adoption of these types of systems is difficult to identify, we include time fixed effects in all of our models to control for charity care time trends in our panel. We thank our discussant for providing this example.
On the surface, a strategy of shifting bad debt expense to charity care may appear harmless, or perhaps even beneficial from a societal standpoint. However, we argue that managers are incentivized to engage in this shifting strategy opportunistically prior to debt issuance, which clouds the distinction between bad debt and charity care and diminishes the usefulness of the financial statements for evaluating and predicting performance.
As such, the financial statements of every hospital in our sample have undergone an OSPHD desk audit.
The year 2008 marks the beginning of a recession as well as the first year that nonprofit hospitals were required to report charity care and bad debt costs separately on the IRS 990 Schedule H. To address concerns that these events unduly influence our results, we partition the sample into pre- and post-2008 observations and find that our results hold in both time periods.
Previous research (e.g., Krishnan and Yetman 2011; Vansant 2016) eliminates hospitals that are members of the Kaiser Foundation or Shriner systems because they are unique in that they provide insurance services in addition to hospital services. Since we aggregate hospital systems into one observation per year, these hospital systems do not have a significant influence on our results, and we find that our results are robust to excluding them.
Wedig et al. (1996) discusses NPH bond issuances specifically; however, all types of nonprofits issue bonds through this process.
In our sample, 63% of issues used a statewide conduit, and the remainder were issued through local municipal conduits.
Identifiers available in SDC are issuer CUSIPs, which are associated with the municipality or development authority, and issue CUSIPs, which identify the specific bond, the issuer, and the beneficiary. Identifiers in OSHPD are unique hospital-level identifiers (OSHPD ID) as well as the legal, business, and parent name of the hospital.
We filter by the state of the beneficiary, not the issuer, because in an immaterial number of instances, the issuer is not domiciled in California, but the beneficiary is in California. We include these observations in our sample, but our inferences remain unchanged when we exclude them.
Bond Buyer, a private firm that aggregates and sells information about municipal bond issues, provides this information, and it is included within the SDC dataset.
These government programs reimburse hospitals for services provided to eligible patients at a predetermined (and often retroactively adjusted) rate, which can be substantially less than the amount billed. Hospitals estimate allowances for the portion of these revenues that are unlikely to be realized and concurrently record bad debt expense.
To be consistent with prior research, we use change in bad debt expense as the dependent variable in Model 1, following Leone and Van Horne (2005), and use current period level of charity care as our dependent variable in Model 2, following Vansant (2016). In both models, the residual represents the dollars of unexpected costs scaled by lagged total assets.
See Vansant (2016) for additional discussion regarding variable selection in Model 2.
Although Model 1 predicts the level of change to bad debt expense whereas Model 2 predicts the total level of charity care, the residuals of both models (DBDE and CC) represent the unexpected amount of the respective account. In untabulated results, we show that our main results are robust to (1) using levels of the dependent variable in both models and the lagged level of the dependent variable as a control, (2) using changes in charity care and changes in the financial control variables in Model 2, and (3) using the independent variables in Model 2 (hospital specific characteristics) as additional controls in Model 1. These results are available upon request.
We find consistent results when we use the size of the issue (principal scaled by total assets) in place of an indicator variable for a bond issuance year.
Results remain consistent when we replace these controls with contemporaneous pre-BDE ROA and pre-CC ROA, as in Leone and Van Horn (2005).
Cash is neither correlated with our measures of discretionary bad debt or charity care, nor a significant predictor of discretionary bad debt or charity care when included with the other predictors in our main models. We use lagged (rather than current) Cash as the exclusion restriction because current year charity care and current year cash are contemporaneously related.
The limited detail that is provided is the general category (“project finance revenue bond”) and purpose (“healthcare”). There is no variation in these fields.
Previous research generally excludes long-term care facilities (such as psychiatric care facilities), resulting in a lower average length of stay. We believe our predictions should generalize to hospitals with long-term care facilities, so we include them in our main tests. However, we also find that our results are robust to excluding them.
ROA, CC, and BDE are contemporaneous rather than lagged (as presented in the model) because of data limitations in collecting lagged variables in our long-window analyses (i.e., for a three-year window, a lagged variable would require data from t-4 through t-6, which causes a substantial loss of observations). However, we do obtain consistent results in the short window if we use lagged values for these measures.
The $2.02 is the sum of the interaction coefficient (−1.97) and the DBDE main effect (−0.05). The result suggests that charity care increases approximately twice as much ($2.02) as bad debt expense decreases ($1).
The interpretation is similar if we use total CC and BDE in place of DCC and DBDE. We find evidence of a negative association during bond issuance years (p < 0.10).
Yield to maturity at issue is also a good measure of cost of debt. However, this variable is relatively sparse in SDC. We merge our SDC issue sample with Mergent to obtain the yield to maturity at issue. We obtain economically and statistically similar results using yield to maturity as our proxy for cost of debt. However, we are only able to match 43 issues between SDC and Mergent.
Our results are robust to classifying LowDBDE as the lowest quintile and lowest half of DBDE by year.
Results remain consistent when we also control for patient mix, leverage, gross revenues, and PP&E.
The average gross spread for our sample of issues is 615 basis points; the coefficient on LowDBDE is equivalent to −131.9 basis points.
Krishnan and Yetman categorize bad debt expense as a program expense (specifically, as part of charity care).
For example, Ohio gave General Motors a $60 million tax break in return for building a factory in the community of Lordstown, and now wants the funds back after General Motors closed the factory (O’Brien 2020). We thank an anonymous reviewer for providing this example.
References
American Hospital Association (AHA). (2017). AHA Hospital statistics. AHA.
American Institute of Certified Publix Accountants (AICPA). (2017). Audit guide of the American Institute of Certified Public Accountants. AICPA.
Bai, G., and G. Anderson. (2016). A more detailed understanding of factors associated with hospital profitability. Health Affairs 35 (5): 889–897.
Bazzoli, G.J., J.P. Clement, and H.M. Hsieh. (2010). Community benefit activities of private, nonprofit hospitals. Journal of Health Politics, Policy and Law 35 (6): 999–1026.
Beck, A. (2018). Opportunistic financial reporting around municipal bond issues. Review of Accounting Studies 23 (3): 785–826.
Burns, J. (2004). Are nonprofit hospitals really charitable?: Taking the question to the state and local level. Journal of Corporation Law 29 (3): 665–683.
Butler, A. (2008). Distance still matters: Evidence from municipal bond underwriting. The Review of Financial Studies 21 (2): 763–784.
Capps, C.S., D.W. Carlton, and G. David. (2020). Antitrust treatment of nonprofits: Should hospitals receive special care? Economic Inquiry 58 (3): 1183–1199.
Chen, H.C., and J.R. Ritter. (2000). The seven percent solution. The Journal of Finance 55 (3): 1105–1131.
Child, J., and T. Tsai. (2005). The dynamic between firms’ environmental strategies and institutional constraints in emerging economies: Evidence from China and Taiwan. Journal of Management Studies 42 (1): 95–125.
Centers for Medicare and Medicaid Services (CMS). (2020) “NHE [National Health Expenditure] Fact Sheet”. https://www.cms.gov/research-statistics-data-and-systems/statistics-trends-and-reports/nationalhealthexpenddata/nhe-fact-sheet.html. Accessed 11 May 2020.
Colombo, J.D. (2006). The role of tax exemption in a competitive health care market. Journal of Health Politics, Policy and Law 31 (3): 623–642.
Colombo, J.D., and M.A. Hall. (1992). The future of tax-exemption for nonprofit hospitals and other health care providers. Health Matrix 2 (1): 1–34.
Congressional Budget Office (CBO). (2006). Nonprofit hospitals and the provision of community benefits. Publication no. 27070. United States congress. Washington.
Eldenburg, L., F. Gaertner, and T. Goodman. (2015). The influence of ownership and compensation practices on charitable activities. Contemporary Accounting Research 32 (1): 169–192.
Eldenburg, L., K. Gunny, K. Hee, and N. Soderstrom. (2011). Earnings management using real activities: Evidence from nonprofit hospitals. The Accounting Review 86 (5): 1605–1630.
Eldenburg, L., and C.C. Vines. (2004). Nonprofit classification decisions in response to a change in accounting rules. Journal of Accounting and Public Policy 23 (1): 1–22.
Financial Accounting Standards Board (FASB). (2010). Accounting Standards codification 954–310: Health care entities-receivables. FASB.
Financial Accounting Standards Board (FASB). (2014). Accounting Standards update 2014–09 topic 606: Revenue from contracts with customers. FASB.
Gapenski, L., and K. Reiter. (2016). Healthcare finance: An introduction to Accounting and Financial management. Health Administration Press.
Gaver, J., E. Harris, and M. Im. (2016). Determinants and consequences of nonprofit bond ratings. Accounting Horizons 30 (3): 363–378.
Ge, W., and L. Mingzhi. (2015). Corporate social responsibility and the cost of corporate bonds. Journal of Accounting and Public Policy 34 (1): 597–624.
Gebelhoff, R. (2015). Value of tax breaks for nonprofit hospitals doubled in a decade. The Washington Post. https://www.washingtonpost.com/national/health-science/value-of-tax-breaks-for-nonprofit-hospitals-doubled-in-a-decade/2015/06/17/4162c640-1450-11e5-9ddc-e3353542100c_story.html. Accessed 29 June 2015.
Hamill, S. (2016). Hospitals turn bad debt into charity care. Pittsburgh Post-Gazette. https://www.post-gazette.com/news/health/2016/09/25/Turning-bad-debt-into-charity-care/stories/201605050209. Accessed 8 November 2019.
Hansmann, H. (1987). The effect of tax exemption and other factors on the market share of nonprofit versus for-profit firms. National Tax Journal 40 (1): 71–82.
Heckman, J. (1979). The sample selection bias as a specification error. Econometrica 47 (1): 153–162.
Higgins, D., T.C. Omer, and J.D. Phillips. (2015). The influence of a firm's business strategy on its tax aggressiveness. Contemporary Accounting Research 32 (2): 674–702.
Hoi, C.K., Q. Wu, and H. Zhang. (2013). Is corporate social responsibility (CSR) associated with tax avoidance? Evidence from irresponsible CSR activities. The Accounting Review 88 (6): 2025–2059.
Inger, K.K., and B. Vansant. (2019). Market valuation consequences of avoiding taxes while also being socially responsible. Journal of Management Accounting Research 31 (2): 75–94.
Jiang, J. (2008). Beating earnings benchmarks and the cost of debt. The Accounting Review 83 (2): 377–416.
Kim, D., D. Palia, and A. Saunders. (2008). The impact of commercial banks on underwriting spreads: Evidence from three decades. Journal of Financial and Quantitative Analysis 43 (4): 975–1000.
Krishnan, R., and M. Yetman. (2011). Institutional drivers of reporting decisions in nonprofit hospitals. Journal of Accounting Research 49 (4): 1001–1039.
Lanis, R., and G. Richardson. (2015). Is corporate social responsibility performance associated with tax avoidance? Journal of Business Ethics 127 (2): 439–457.
Leone, A., and R. Van Horn. (2005). How do nonprofit hospitals manage earnings? Journal of Health Economics 24 (4): 815–837.
Lennox, C., J. Francis, and Z. Wang. (2012). Selection models in accounting research. The Accounting Review 87 (2): 589–616.
Liu, Y., Y. Ning, and W. Davidson III. (2010). Earnings management surrounding new debt issues. Financial Review 45 (3): 659–681.
Mahood, S. (2016). Proposed initiative enters circulation: Hospitals. Healthcare service charges. Initiative statue. https://www.sos.ca.gov/administration/news-releases-and-advisories/2016-news-releases-and-advisories/proposed-initiative-enters-circulation2. Accessed 5 January 2021.
Moody’s Investor Service (Moody’s). (2012). Not-for-profit healthcare rating methodology, report no. 139274. Moody’s.
Morrisey, M.A., G.J. Wedig, and M. Hassan. (1996). Do nonprofit hospitals pay their way? Data from California shed light on whether the benefit from nonprofit hospitals warrants their special tax status. Health Affairs 15 (4): 132–144.
O’Brien, D. (2020). Ohio just ordered GM to repay $28 million in tax breaks for closing the Lordstown auto plant, The Business Journal. https://www.propublica.org/article/ohio-just-ordered-gm-to-repay-28-million-in-tax-breaks-for-closing-the-lordstown-auto-plant. Accessed 11 November 2020.
Oliver, C. (1991). Strategic responses to institutional pressures. Academy of Management Review 16 (1): 145–179.
Revenue Ruling 69–545, (n.d.) 1969–2 C.B. 117.
Sorensen, E.H. (1980). An analysis of the relationship between underwriter spread and the pricing of municipal bonds. Journal of Financial and Quantitative Analysis 15 (2): 435–447.
Standard and Poor’s (S&P). (2017). U.S. not-for-profit acute-care stand-alone hospitals—Methodology and assumptions. S&P.
Stewart, K. (2009). Property tax exemptions for nonprofit hospitals: The implications of Provena covenant medical center v. Department of Revenue. The Tax Lawyer 62 (4): 1157–1196.
Tanner, J.E. (1975). The determinants of interest cost on new municipal bonds: A reevaluation. The Journal of Business 48 (1): 74–80.
Texas Tax Code Annotated §§ 11.1801(a) n.d.
Vansant, B. (2016). Institutional pressures to provide social benefits and the earnings management behavior of nonprofits: Evidence from the US hospital industry. Contemporary Accounting Research 33 (4): 1576–1600.
Watson, L. (2015). Corporate social responsibility, tax avoidance, and earnings performance. The Journal of the American Taxation Association 37 (2): 1–21.
Wedig, G., M. Hassan, and M. Morrisey. (1996). Tax-exempt debt and the capital structure of nonprofit organizations: An application to hospitals. The Journal of Finance 51 (4): 1247–1283.
Weisbrod, B. (1975). Toward a theory of the voluntary nonprofit sector in a three-sector economy. In Altruism, Morality and economic theory, ed. E. Phelps, 171–195. Russell Sage.
Yetman, M., and R. Yetman. (2013). Do donors discount low-quality accounting information? The Accounting Review 88 (3): 1041–1067.
Young, G.J., S. Flaherty, D.E. Zepeda, S.R. Singh, and G.R. Cramer. (2018). Community benefit spending by tax-exempt hospitals changed little after ACA. Health Affairs 37 (1): 121–124.
Acknowledgments
We gratefully acknowledge the 2020 RAST Conference participants, Ranjani Krishnan (discussant), Patricia Dechow (editor), and two anonymous reviewers for their valuable insights and suggestions. We also appreciate the helpful comments we received from participants at the 2016 Southeast Summer Accounting Research Conference, the 2016 AAA Southeastern Regional meeting, the 2017 AAA Management Accounting Section midyear meeting, the 2017 AAA annual meeting, and workshops at George Mason University, Georgetown University, University of California – Davis, University of Alabama, and University of Toledo. We also appreciate the advice and feedback of David Cicero, Doug Cook, Shawn Mobbs, Linda Parsons, Shane Underwood, Paul Wong, Bob Yetman, and Michelle Yetman.
Author information
Authors and Affiliations
Corresponding author
Additional information
Publisher’s note
Springer Nature remains neutral with regard to jurisdictional claims in published maps and institutional affiliations.
Appendix
Appendix
1.1 Appendix 1
1.2 Appendix 2
1.3 Appendix 3
1.4 Appendix 4
Rights and permissions
Open Access This article is licensed under a Creative Commons Attribution 4.0 International License, which permits use, sharing, adaptation, distribution and reproduction in any medium or format, as long as you give appropriate credit to the original author(s) and the source, provide a link to the Creative Commons licence, and indicate if changes were made. The images or other third party material in this article are included in the article's Creative Commons licence, unless indicated otherwise in a credit line to the material. If material is not included in the article's Creative Commons licence and your intended use is not permitted by statutory regulation or exceeds the permitted use, you will need to obtain permission directly from the copyright holder. To view a copy of this licence, visit http://creativecommons.org/licenses/by/4.0/.
About this article

Cite this article
Beck, A., Gilstrap, C., Rippy, J. et al. Strategic reporting by nonprofit hospitals: an examination of bad debt and charity care. Rev Account Stud 26, 933–970 (2021). https://doi.org/10.1007/s11142-021-09624-6
Accepted:
Published:
Issue Date:
DOI: https://doi.org/10.1007/s11142-021-09624-6