
Abstract
The main aim of the article is to assess investments in hotel services in Poland in 2018–2020. The assessment was carried out by examining the correlation between financial outlays in the hotel industry in powiats (counties) and voivodeships of Poland and customer opinions expressed in internet entries on the websites of individual tourist facilities. The methodology for testing the sentiment of text documents is an unsupervised classification algorithm applied to the Polish language. The classification task consists of the unsupervised assignment of a text document to one of three sentiment classes: positive, neutral, or negative. The research is based on opinions collected from 906 hotels and the amount of financial investment in individual hotel segments (categories) in the surveyed years on a powiat basis. Financial investment data were gathered from the official statistical yearbook websites and internet entries were scraped from the websites of individual tourist facilities. The analysis shows a positive relationship between the size of investment in hotel services and the sentiment of customers' opinions. The scientific contribution of the research is threefold. Firstly, an attempt is made to assess the efficiency of investments in hotel services in Poland in recent years. Secondly, the approach applied omits the downsides of other popular models of assessing the quality of services. Thirdly, the algorithm used quite precisely finds the categories required for a different kind or broader analysis of the quality of hotel services.
1 Introduction and literature review
The problem of research on the quality of tourist services, including the quality of hotel services, is extremely important both from the point of view of customer satisfaction and the achievement of profit by service establishments. As pointed out by Wojciechowska (2021, p. 241), despite many studies, this problem is still not fully recognized and not widely presented in Polish literature. Of course, there are industry studies and reports on the hotel market in Poland, such as World of Hotels or Hotel Market, but the information presented there mainly concerns the number of tourists, rooms, customer structure, etc. Less attention is paid to analysis of the quality of services, their improvement, customer ratings, investments aimed at improving services, etc., and it seems that this is of great importance from the point of view of increasing the profitability of this type of service: as can be seen, the quality of services (and the perception by the customer and his satisfaction) is closely correlated with the profits obtained by the providers of these services. The subject of quality of services undertaken in the West has a much longer tradition, which translates into the number of studies and publications on this subject. This (customer) point of view was first emphasized in the 1980s (e.g. Crosby 1979; Parasuraman et al. 1985) and has continued until now (Anderson and Sullivan 1993; Anderson 1998; Akbaba 2006; Ghotbabadi et al. 2015; Ali et al. 2021). In this way, attempts have been made to get to know customers' opinions and increase their general awareness (Wojciechowska 2021, cited in Vermeulen and Seegers (2009), Sigala (2011, pp. 607–608); to raise public awareness of sustainable development (Świstak et al. 2016), cited in Houdré (2008); and to compare these results with the opinions of managers on the quality of the services they provide (Coyle and Dale 1993; Scanlan and McPhail 2000; Appaw-Agbola and AfenyoDehlor 2011, p. 112). It should be noted that managers attached importance mainly to the quality of the rooms, while personal ties with the staff, solid performance of services, and their reliability were of great importance to customers (Anwar and Shukur 2015; Cetin and Walls 2016; Sultan et al. 2020). Despite the fact that both approaches mentioned separately are quite well researched and developed, the relationship between the opinions obtained from hotel guests and their impact on the investment activities undertaken by hotel owners is not well recognized. Of course, the opposite question can be asked: how do investment activities affect guest reviews? Regardless of the direction of dependence, it would be interesting to recognize and analyse the above relationships in order to make more accurate investments based not only on external conditions, but also on opinions posted on websites or hotel websites. Due to the scarcity of research, especially in the area of investment efficiency, which is revealed in some way in the opinions of guests, the authors have taken up this thread to examine whether investment resources aimed at the hotel sector in regional and county terms have an impact on customers’ assessment of the quality of hotel services. Of course, one should be aware that the investments undertaken may also be the result of previous opinions of hotel guests; however, this is not the focus of the authors.
2 Hotels and the quality of hotel services
According to Gołąb (2009, p. 12), quoting Turkowski (1997, p. 13), a hotel is “an establishment where travelers can, in return for remuneration, take advantage of accommodation and usually also food. Hotels are classified in different categories, according to the degree of luxury and comfort”. A different but similar definition of a hotel is proposed by Grabiszewski (1998, p. 11), who states that a hotel is “a facility where hotel services are provided, which are understood as the temporary rental of rooms or related places to travelers”. Witkowski (1998, p. 5) similarly defines the concept. Other definitions cited by researchers dealing with the subject of hotel services are similar in their content, so it does not seem reasonable to duplicate them, just to remember that to be deemed a hotel, the facility must have at least ten rooms (mostly single and double rooms) and provide a wide range of services (Ustawa 1997; Nowakowski 2001, p. 22). The hotel is a narrower category than the hotel facility, because next to it you can also include motels, guesthouses, camping, tourist houses, tent campsites, youth hostels, shelters, school youth hostels, resorts, summer camps, training and recreation centres, creative work houses, tourist cottages, health establishments, agritourism quarters, or guest rooms (Cetnarowicz 2007, p. 6). A total of 9766 such facilities were registered in Poland in July 2022, including 2569 hotels (Tourism 2022, p. 24). It is these hotels that are the subject of the research.
When analysing the importance of service quality, it is of course necessary to define the concept of services, especially hotel services. The most general definition is available in the Act of 29 August 1997 on tourist services, which states that a hotel service is the “short-term, generally available rental of houses, apartments, rooms, accommodation places, as well as places for setting up tents or caravans and the provision of related services” (Ustawa 1997).
From here we come to the next term, namely the quality of hotel services. ‘Quality’ can be considered from many points of view, such as economic, philosophical, market (marketing), and technological, and each one is important to the customer’s perception of the product or service. For the purposes of this article, we adopt a definition of quality used in the tourism and hotel industry, namely that it is “a set of features, values, functional and emotional attributes that determine the extent to which the product meets the needs of recipients” (Panasiuk 2005, p. 86). The emotional element contained in the definition emphasizes the subjectivity of the assessment of meeting customer needs and therefore may be significantly different from the specified quality level set by the service provider (Ali et al. 2021, p. 15), especially in the context of hotel service, customer-hotel staff relations, etc.
It is possible to distinguish the assessment of the service provider’s point of view and the customers’ point of view. The two assessments differ significantly, but at the same time they complement each other: without the manufacturer's investment, attention to market share, use of appropriate instruments and strategies in terms of costs, marketing and obtaining profit at the appropriate level, it would be impossible to meet the needs of the customer who counts on kindness, understanding, reliability, competence, etc. (Table 1).
The above approach to the quality features expected by hotel customers is quite comprehensive and customers are not fully aware of the scope of services provided, or even their expectations. However, it is very useful in the context of formulating potential needs of the customer and opportunities to meet them. Approaches from both the supplier and customer sides are presented in Table 2.
As you can see, quality can be perceived differently and may also include elements of competitiveness in the market. However, for Authors, the second level seems to be the most important.
3 Selected service quality models and their measurement
One of the first and most famous comprehensive models of service quality is the Grönroos model, which as early as 1982 assumed that consumers compare their expectations with the perception of the services they receive. On this basis, Grönroos (1982) highlighted two main types of service quality: technical and functional. The first involves what the customer is actually receiving from the service; the second involves the manner in which the service is delivered (Grönroos 1984). The quality of services according to Grönroos (so-called perceived service quality) depends on the distance between expected service (E) and perceived service (P) (Furtak 2003, p. 131).
Due to some limitations in the Grönroos model, the cooperation between Grönroos and another outstanding scientist, Gummesson, led to the creation of a more holistic model based on four types of partial quality (4Q), namely design quality, production quality, delivery quality and relational quality (Gummesson and Grönroos 1987; Govender 1996, pp. 844–845). Noteworthy here is the quality of relationships, communication and cooperation, although the multidimensionality of quality and taking into account all four dimensions when assessing it are emphasized.
The discrepancy between the expected quality of service and that received in the Grönroos model became the basis for Parasuraman et al. (1985, p. 44) constructing the model of service quality gaps. The gap model, as the name suggests, is based on gaps (differences) between expectations and what the customer receives as a final product/service, these differences arising at every stage of service preparation and provision (Stoma 2012, p. 40). These gaps were formulated through executive and focus group interviews about the service quality concept and named accordingly (Yarimoglu 2014, p. 82):
-
GAP 1: The knowledge gap: the gap between customer expectation and management perceptions.
-
GAP 2: The policy gap: the gap between management perception and service quality specifications.
-
GAP 3: The delivery gap: the gap between service quality specifications and service delivery.
-
GAP 4: The communications gap: the gap between service delivery and external communications.
-
GAP 5: The service quality gap: the gap between expected service and perceived service.
Relationship models also include the Haywood-Farmer (1988) service quality model, which distinguishes three groups of attributes (properties) (Bielawa 2011, p. 13): physical, meaning equipment and processes; human behaviour (attitudes); and professional judgement (assessment). Each attribute with properties is affected by several factors, too great a concentration of which can lead to dysfunction (Bielawa 2011, p. 13). This model does not provide any information about the measurement scale and fails to provide direction to the management on the methods and procedures that could be adopted to identify service quality problems and then to keep a check on such problems (Jain and Aggarwal 2015, p. 132).
In addition to the models mentioned above, there are many others that are more or less popular depending on specific needs and changes in consumer expectations over time, and taking into account changes in conditions and circumstances (Moore 1987; Nash 1988; Brogowicz et al. 1990, p. 31; Lehtinen and Lehtinen 1992; Armistead and Clark 1994, pp. 5–22; Berkley and Gupta 1994, pp. 109–121; Spreng and Mackoy 1996; Dabholkar et al. 2000, p. 133). It should also be remembered that these models were constructed in different countries—i.e. in different cultures—and for the needs of different sectors of the economy, which means that their applicability may be limited and one should continue to look for more universal indicators to measure the quality of services.
The aforementioned models for measuring the quality of services require the collection of extensive statistical material. In terms of the Parasuraman gap model, an interesting method of collecting customer feedback called SERVQUAL has been developed. In this method, the expectations of service buyers are measured and the perception of the quality of services received by them is measured using a specially constructed questionnaire as a measurement tool. The authors conducted research (interviews) based on aggregated service quality criteria (initially ten, and eventually five) (Stoma 2012, pp. 66–72):
-
(1)
The materiality of services tangibles, understood as the external and internal appearance of the rooms and the service facility, equipment, infrastructure, promotional materials and clothing, behaviour and appearance of the staff shaping the image in the eyes of the client.
-
(2)
Reliability also defined as conscientiousness—i.e. the ability of the service provider to perform the promised service in the right way and at the promised level, accurately, reliably and on time.
-
(3)
Empathy an individualized approach to each client, the ability to understand the needs and expectations of clients and to empathize and identify with them.
-
(4)
Assurance defined as professionalism (qualifications and substantive knowledge of the staff) and appropriate behaviour of the staff—i.e. courtesy, credibility, safety and trust (the staff’s ability to inspire trust).
-
(5)
Responsiveness understood as the speed of actions and response to customer expectations, timely provision of services, readiness to provide the customer with quick assistance throughout the service provision process, but also readiness to respond immediately to signals of customer dissatisfaction; it is also often referred to as the responsibility or sensitivity of the service provider to the needs of customers.
The SERVQUAL questionnaire developed in this way (Parasuraman et al. 1991b, pp. 176–183) provides information on the percentage share of each dimension in the overall assessment (Berry and Parasuraman 1994, p. 157). For more on this method, see Parasuraman et al. 1988, pp. 12–39; Parasuraman et al. 1991a, pp. 420–450; Parasuraman et al. 1991b, p. 18 ff; Parasuraman et al. 1994, pp. 201–230; Rudawska and Kiecko 2000; Karaszewski 2001). This method is widely used in hotel services due to the possibility of recognizing the size of the gap between expectations and the quality of the service provided and the relatively quick reaction of the management in order to eliminate it. The multidimensionality of the above method is used in the hotel services sector (Fick and Ritchie 1991). However, it should be modified each time (e.g. the number and importance of dimensions) depending on the quality of the hotel or hotel facility and specific differentiating features. It should be added that this model lacks the cost element of increasing quality, which is undoubtedly its major drawback (Bank 1996, p. 36). The methods used to measure the quality of services offered by tourism enterprises, which were created on the basis of SERVQUAL, include, among others, LODGSERV and HOLSERV (Johann 2019, pp. 132–134). LODGSERV was created in 1990 to measure the quality of hotel services (Knutson et al. 1990, p. 277–284), while HOLSERV was proposed by Mei et al. (1999, pp. 136–143), considering the quality of services in hotels in three dimensions: personnel, material elements and reliability.
An alternative way of measuring service quality is SERVPERF (service performance), which omits the assessment of customer expectations as an ambiguous and subjective category; it focuses on measuring the specific performance of the service provider rather than identifying gaps in service quality. The creators of this method are Cronin and Taylor (1994), who emphasize the measurement and assessment of the current state (level of service quality already provided) and relate it to the maximum (Seth et al. 2005, p. 920). The quality of a given service is higher the closer the scores resulting from individual criteria are to the maximum score (Stoma 2012, p. 79).
Service quality is evaluated by perceptions only without expectations and without importance weights according to the formula (Jain and Gupta 2004, p. 28)Footnote 1:
where: SQ—overall service quality; k—the number of attributes; Pij—performance perception of stimulus i with respect to attribute j.
The SERVPERF method is usually used when there is a high probability of relatively high customer expectations in relation to each of the analysed criteria in order to measure effectively the achievements of the examined service institution and indicate places where improvements should be introduced (Stoma 2012, pp. 78–79).
Another, quite simple method of measuring the quality of services is the importance-performance analysis (IPA) method proposed by Martilla and James (1977, pp. 77–79). It is treated as a helpful technique in creating business strategies and in tourism. It is based on measurement of the importance of features (importance) and their implementation in the product (performance). The process of identifying service features based on group interviews or the opinions of hotel management is used here; respondents (consumers or service providers) are then asked to express their opinion on the importance of the presented features (reliability, responsiveness, and tangibles) and their perception of the service provided.
The last quality assessment method presented in this article, but no less important, is the Kano model,Footnote 2 proposed by Kano et al. (1984). The model divides product quality characteristics into five categories according to the relationship between objective product performance and customer subjective feelings, namely must-have quality, one-dimensional quality (performance or linear), attractive quality (exciters or delighters), indifferent quality, and reverse quality (Li and Xiao 2020, p. 2). The Kano model has found application in various fields, including to classify hospitality’s technical innovation attributes and provide suggestions for managers to introduce innovative technologies in the hotel industry (Chiang et al. 2019, pp. 1–12).
4 Alternative ways to measure service quality
The selected models and methods of quality measurement presented above do not exhaust the subject, if only because of the different interpretations and meanings of the term ‘quality’, which makes it difficult to use an appropriate and precise conceptual apparatus. It seems, therefore, that it is necessary further to seek and develop methodology in this area, to develop less costly and time-consuming methods of quality measurement, because, as indicated, the above methods are focused on questionnaire research and the need to develop and analyse the results obtained. The hotel guest satisfaction survey (and thus the measurement of service quality) is an integral part of the strategy in the hotel industry. It is very important to evaluate the customer experience, react quickly, and maintain the right relationship. In the era of the internet, digitization and huge competition, the customer and his expectations are prioritized—hence the need to study the quality of services provided by analysing consumer opinions. Such opportunities include text mining—i.e. a set of concepts, methods and algorithms for processing text resources implemented in the form of computer programs, leading to the automation of processing documents prepared in natural languages (Lula 2005, p. 67), or defined as a process aimed at extracting previously unknown information from text resources (Hearst 1999).
The most popular text mining methods include neural networks (Kohonen 1982), taxonomic grouping methods (Yang and Liu 1999, pp. 42–49) decision trees, support vector machines (Thorsten 1998, pp. 137–142; Basu et al. 2003), linkage analysis (Wong et al. 1999) and many others (see Fig. 6). The application of text mining is very wide, from the analysis of surveys with open questions to automated processing of messages and e-mails for text classification, text translation, and sentiment analysisFootnote 3 (opinion mining) (e.g. Liu 2010; Cambria and Hussain 2015; Velasco et al. 2023). Access to the internet has radically changed the way customers express their opinions. It is no longer necessary to send surveys or use questionnaires to find the opinions of hotel guests on the quality of services (word of mouth marketing): it is enough to go to discussion forums, blogs, hotel websites or network operators' websites and read the product or service review.
Sentiment analysis (opinion mining), which will be used in our research, can be defined as investigating the opinions, sentiments, attitudes, assessments, moods, feelings, emotions (disappointment, happiness, sadness, anger or confusion) expressed in text (Liu 2010, p. 3; Liu 2020) with respect to a predefined object. The terms ‘sentiment analysis’ and ‘opinion mining’ were first used by Dave et al. (2003) and Nakusawa and Yi (2003) and are now widely used and described in the extensive literature on the subject (Lau et al. 2005; Xu and Li 2016; Lee et al. 2018; Zhao et al. 2021; Chen et al. 2022). Related terms for possibly slightly different tasks include opinion extraction, sentiment mining, subjectivity analysis, affect analysis, emotion analysis, review mining, etc. (Liu 2012, p. 7).
The techniques used in sentiment analysis were presented by Medhat et al. (2014) (Fig. 1).

Sentiment classification techniques. Source: Medhat et al. (2014), p. 1095
Two approaches that are fundamentally different in nature are machine learning (ML) and dictionary methods, the first of which can be divided into supervised learning (assigning statements or documents to predefined categories) (Turek 2017, p. 287) and unsupervised learning (without teacher), including hierarchical methods, methods based on measures of similarity, and methods based on measures of text complexity (Tomanek 2014, pp. 119–120).
Sentiment analysis is used in both servicesFootnote 4 and, for example, the financial markets (stock market), using social media sentiment to provide investors with insights into stocks or commodities that they may not be able to find from more conventional sources. Problems and examples related to sentiment analysis, sentiment and subjectivity classification, feature-based sentiment analysis, feature extraction, sentiment analysis of comparative sentences, opinion search and retrieval, opinion spam and utility of opinions are described in detail by Lula (2005), Liu (2010), Chen et al. (2022) and others.
5 General characteristics of investments in the hotel industry in Poland in recent years
Increased competition in the hotel industry makes it necessary to use the most appropriate marketing strategy (e.g. market segmentation) and price and investment strategy to meet the expectations of hotel guests and obtain the highest opinion of the quality of the services offered. From the point of view of success, evaluation of hotel facilities has become one of the most important factors taken into account by providers of these services.Footnote 5 Hence, text (opinion) analysis has become an inseparable element of the business plan and SWOT analysis of the hotel market (Walas 2011, pp. 72–73). This applies to both newly built hotels (proper location) and existing ones (defect removal, financing modernization and quality improvement works, digitization, etc.). Undoubtedly, the location is very important when making investment decisions; this, in turn, is conditioned by the dynamics of tourist movement; the increase in the purchasing power of tourists; the development of economic, entrepreneurial and business activities; the investor's knowledge, intuition and experience; and professionally conducted market analysis (Puciato 2012). The location also translates into the quality of the hotel offer, and, as a result, the quality of services and customer satisfaction (Kachniewska 2009, pp. 145, 202–218) (Table 3).
Selection of the location takes place in three stages. It starts with market selection and, through area analysis, leads to selection of the most favourable specific site (site evaluation) (Wilk 2001, p. 18). The location of the hotel in a given country, region, and ultimately city is referred to as the general location. Its main purpose is to find the most convenient spatial connections of a hotel depending on its surroundings. Indicating a specific location is called a detailed location, taking into account, among other things, the strategy of “following the customer” and knowledge of the spatial behaviour of potential customers (Gruszka et al. 2014, pp. 102–103, 107). Analysis of the distribution of hotels and other accommodation facilities in space is well described (e.g. by Tsung-Yu et al. 2008; Ashworth and Page 2011; Yang et al. 2012). At the same time, it should be remembered that the localization requirements are even more restrictive in the case of business tourism and business hotels, which must meet higher expectations from this customer segment in such areas as location, service offer, conference rooms, media technology, room equipment, dining services, leisure services, conference service, professional competence of hotel staff, proximity to public transport, etc. (Schreiber 2002, p. 134).
It can be said that the location is one of the most important factors taken into account when making investment decisions, but not the only one. Investment in the hotel industry mainly concerns so-called economy hotels (with a reduced gastronomic base) and four-star hotels, aimed at more demanding customers (Fig. 2).

Investments in Poland in 2022 by hotel standard. Source: Raport (2022), p. 9
Five-star hotels are only in third place when it comes to the involvement of investment funds, which may be due to their geographical location, location in an urban area, limited area, and higher maintenance costs. Hotels in a higher category absolutely require higher investments from investors: they are investments with a longer repayment period and they require managers to have professional knowledge of the management of this type of facility (Chroboczyńska 2015). At the same time they are more focused on meeting the needs of individual customers. This is also where the biggest changes in the quality of hotel services should be expected.
6 Research
6.1 Methodology description
The aim of the research was to assess the effectiveness of investments in the hotel industry in Poland in the years 2018–2020 by means of investigating the correlation between the amount of investment and the percentage of positive opinions of tourist facilities. Justification for this kind of approach lies mainly in a couple of downsides of earlier approaches, in our opinion. All of the mentioned models aiming to assess service or product delivery require large research consisting of the collection of reliable statistical data. Firstly, this is costly, both with respect to financial cost as well as time cost. Secondly, such research may sometimes even be infeasible (due to the subjectivity of assessment or complexity of data, for example). The approach that we propose omits these drawbacks as it is relatively low cost research and returns a complete assessment of services. Obviously, such assessments might be biased due to the complexity of services (the equivalent of the aforementioned downsides of earlier approaches) and the requirement to provide a clear-cut final assessment. However, we try to alleviate this bias by using three classes of sentiment grouping—i.e. keeping the neutral class. This neutral class should be very useful for not strictly decided opinions which are quite frequent when assessing the hotel industry as clients may differ in how they assess different categories of service.
Financial investment data were gathered from the official statistical yearbook websites (Polish Statistical Office) and internet entries were scraped from the websites of individual tourist facilities (https://app.outscraper.com/googleReviews).
To carry out the research, we collected detailed information on financial outlays in the hotel industry concerning counties for each of the years 2018–2020. Counties are small administration units in Poland. The whole country is divided into 380 such units (https://stat.gov.pl/…). Bigger administration units, each consisting of about twenty counties, are voivodships. Poland is divided into 16 voivodships. However, one has to remember that these administration units are not equivalent to geographically formed tourist regions. In order to find the percentage of positive opinions about tourist facilities, we scraped from websites clients’ opinions about hotels in Poland (https://app.outscraper.com/googleReviews).
Initially, we had entries from 10,000 hotel facilities (first round); then 906 hotels were selected (second round) (https://app.outscraper.com/tasks). The selection was driven by omitting all hotel facilities other than actual hotels and by problems ascribing some hotels to their counties. The localization of these 906 hotels is presented in Fig. 3. In Fig. 4, a compressed form of presentation of all 906 hotels in 276 counties to which the hotels belong is given.

Source: own research
Localizations of 906 hotels in Poland selected for the research.

Source: own research
Localizations of 276 counties in Poland housing all 906 hotels selected for the research.
Each of the 906 hotels had attracted around 50 written opinions. This resulted in 42,446 documents, usually consisting just of one or two sentences. The hotels are spread over only 276 counties; thus, we have to keep in mind that not all counties are represented. Opinions were collected in the year 2022 and thus are somewhat posterior to the period in which investments were made. We applied a novel algorithm of opinion sentiment detection in order to group the opinions into three classes: positive, neutral and negative. Then, we found the percentage of positive opinions for each of the 276 counties by dividing the number of positive opinions by the total number of opinions for a given county. When we reported on the assessment of the hotels in voivodships, we did the same operation for all hotels in a given voivodship. Detailed data concerning the number of investments in individual counties and the percentage of positive opinions are given in Table 4. Graphical interpretation of this information in the form of a scatter plot is presented in Fig. 5.

Source: own elaboration based on Table 4
Scatter plot of investments in the hotel industry in the years 2018–2020 (thsnd. of zlotys) and positive opinions percentages for 276 counties. Seven most invested counties are truncated to 3000 thsnd. zlotys for the sake of size and clarity of the graph.
6.2 Description of opinion sentiment algorithm
A typical approach to establishing the sentiment of documents involves the following steps: removal of numbers, removal of punctuation marks, removal of stoplist words, removal of redundant marks (space), and lemmatization (transformation to basic forms). The opinions are written in the Polish language. In previous studies, we found that Polish language lemmatization constitutes a problem, especially as far as verbs are concerned. In our opinion, the removal of stoplist words (e.g. ‘no’, ‘nothing’, ‘be’) also does not make much sense because it leads to a typical bag-of-words approach to text mining in which the position of words in a sentence is neglected. If we want to develop a good quality unsupervised algorithm for sentiment detection, then taking into account the position of words in a sentence and the appearance of crucial words like ‘no’ is obligatory. Therefore, we tried the following no lemmatization, no stoplist (NLNS) algorithm for unsupervised sentiment detection.
7 Stages of document grouping
-
1.
Translate each opinion from the given corpus of opinions from Polish into English.
-
2.
Apply the NLNS algorithm to the English version of the corpus.
The detailed steps of the NLNS algorithm are given in the form of the pseudocode in Appendices A and B.
7.1 Results and interpretation
The grouping of documents into 3 groups resulted in about 80% of them being positive, 17% negative and 3% neutral. In order to assess the correlation between the investments X and the percentage Y of positive opinions we used the Pearson linear correlation coefficient
The value of this coefficient depends on the statistical form in which the data is presented. We will use it in the form for individual data with respect to:
-
n = 276 counties;
-
All n = 16 voivodships;
-
Counties in single voivodships (n = from 8 to 33).
The linear correlation with respect to counties indicated no correlation at all, as r = −0.058. This fact is well illustrated in Fig. 5, where the cloud of scattered points does not really point to any kind of correlation. However, the linear correlation with respect to voivodships turns out to be positive. Here, we bear in mind the result for the two statistical series of 16 numbers describing investments (summed from all counties from Table 4 from a given voivodship) and the percentage of positive opinions (computed anew by pooling all opinions from a given voivodship) for all 16 voivodships—i.e. rather big regions, each comprising a couple of hundred hotels. These two series of 16 numbers are presented in Table 5 and in Fig. 6.
The investments values in Table 5 represent mean values for a county in a given voivodship. This operation had to be carried out because the numbers of counties in voivodships are very diversified (from 8 to 33) and, thus, without averaging the investments we would ignore the influence of the number of counties in voivodships.
The analysis for all 16 voivodships showed a slightly positive relationship between the size of investment in hotel services and the sentiment of customers' opinions as r = 0.287. However, as it is clearly visible in Fig. 6, there are some outlying investments values, the two highest represent two richest voivodships: mazowieckie and wielkopolskie. Therefore, we also found a robust version of the Pearson correlation coefficient by jackknifing both voivodships. This time the correlation is much stronger as r = 0.428.

Source: own research
Scatter plot of investments and percentage of positive opinions for 16 voivodships.
How should these results be interpreted? In our opinion, no correlation for all counties considered individually can easily be explained. Counties are small units, sometimes represented by just one or two hotels, which do not have to be included in the part of the industry characterized by financial investments. If we focus our attention on larger regions, the correlation between investments and positive opinions—if there is one—should show itself. In our opinion, a correlation of 0.287 is not a bad result because we consider only investments from three recent years. Poland has been developing dynamically for two decades, so many investments must have been made before the period investigated in our research: thus one should not expect correlation values close to 1. This conclusion is supported by the robust version of correlation in which two richest Polish voivodships were removed resulting in a much stronger correlation indication of 0.428. If we remove richer regions, better developed earlier and being outliers with respect to the bulk of the data, it is quite logical that we should expect a stronger correlation indication.
In order to investigate if there is any possible correlation between the investments and positive opinions in particular voivodships, we present Table 6.
In Table 6, the correlation coefficients regarding counties in a given voivodship are presented. It is very clear that there is no rule whatsoever: the values vary from a strong negative (e.g. −0.772) to a strong positive (e.g. 0.469). In the case of the Mazowieckie voivodship, two variants are given, one including Warsaw and the other not. Warsaw is very different from the rest of the voivodship as it is a much richer city. We can see that the change in the value of correlation is quite significant (from −0.103 to 0.171). The conclusion is that one county with a high number of hotels can bias the result for the entire voivodship. In our opinion, this result is another consequence of the fact that the correlation does not have to show itself for small units.
8 Conclusions
The research carried out allows us to state that there is a positive correlation between financial investments in hotel services in Poland in the years 2018–2020 and clients’ opinions, measured by the percentage of positive opinions. This correlation does not show itself for small territorial units but is rather obvious for larger ones such as voivodships. If we assume that the amount of financial investment in upgrading services is strictly correlated with the quality of the services provided, then we can state that in the research we managed to assess the quality of investments in services, omitting the numerous downsides and loopholes of many popular models for assessing the quality of services. The approach of analysing the percentage of positive opinions by means of a machine learning algorithm (preceded by translation from Polish to English) obviously has limitations, such as the infeasibility of translating everything (slang expressions) or the impossibility of classifying all opinions, but we think that these disadvantages are small compared with what we achieve.
We strongly believe that future work building upon the use of machine learning algorithms in text mining and its subsequent application to assess economic processes is possible. One may, for example, try to adopt the findings from the proposed algorithm for tracing document sentiment to establish the introductory part of a product or service quality assessment model.
Notes
Cronin and Taylor also proposed the weighted versions of the SERVPERF scale: \(SQ = \sum_{j = 1}^k {I_{ij} P_{ij} }\), where Iij is the weighting factor, i.e., importance of attribute ‘j’ to an individual ‘i’ (Jain and Gupta 2004, p. 29).
Of course, according to the authors, only the most important models and ways of measuring the quality of services were selected, although there are many more of them.
Sentiment analysis is an application of natural language processing technologies that train computer software to understand text in ways similar to humans. The analysis typically goes through several stages before providing the final result.
Sentiment analysis is most often used to analyse consumer opinions (Maślankowski 2017, p. 164).
Of course, the fluctuation of demand, climatic conditions, local tourist attractions, the political and economic situation of the country, geographical location, and the attractiveness of the country and its regions are also of great importance, along with the state of security and communication, the wealth of the society and its tourist awareness, the state of development of both domestic and international tourism, business needs in terms of demand for hotel services, etc. (Panasiuk and Szostak 2009; Firlej and Spychalska 2015, p. 203). However, these are not the subject of detailed consideration.
References
Appaw-Agbola, E.T., AfenyoDehlor, S.: Service quality in ghana’s tourism industry: a perspective from tourists and hotel managers in the volta region. World Rev. Bus. Res. 1(5), 110–125 (2011)
Akbaba, A.: Measuring service quality in the hotel industry: a study. Int. J. Hosp. Manag. (2006). https://doi.org/10.1016/j.ijhm.2005.08.006
Ali, B.J., Gardi, B., Othman, B.J., Ahmed, S.A., Ismael, N.B., Hamza, P.A., Aziz, H.M., Sabir, B.Y., Anwar, G.: Hotel Service Quality: the impact of service quality on customer satisfaction in hospitality. Int. J. Eng., Bus. Manag. 5(3), 14–28 (2021)
Anderson, E.: Customer satisfaction and word of mouth. J. Serv. Res. (1998). https://doi.org/10.1177/109467059800100102
Anderson, E.W., Sullivan, M.W.: The antecedents and consequences of customer satisfaction for firms. Mark. Sci. 12(2), 125–143 (1993)
Anwar, G., Shukur, I.: The impact of training and development on job satisfaction: a case study of private banks in Erbil. Int. J. Soc. Sci. Educ. Stud. 2(1), 65 (2015)
Armistead, C., Clark, G.: The „coping” capacity management strategy in services and the influence on quality performance. Int. J. Serv. Ind. Manag. (1994). https://doi.org/10.1108/09564239410057654
Ashworth, G.J., Page, S.: Urban tourism research: recent progress and current. Tour. Manage. (2011). https://doi.org/10.1016/j.tourman.2010.02.002
Bank, J.: Zarządzanie Przez Jakość. Gebethner & Ska, Warszawa (1996)
Basu, A., Watters, C., Shepherd, M.: Support Vector Machines for Text Categorization. In: Proceedings of the 36th Hawaii International Conference on System Sciences (2003)
Berkley, B.J., Gupta, A.: Improving service quality with information technology. Int. J. Inf. Manage. (1994). https://doi.org/10.1016/0268-4012(94)90030-214
Berry, L.L., Parasuraman, A.: Lessons from a Ten-Year Study of Service Quality in America, QUIS 3, ISQA (1994).
Bielawa, A.: Przegląd najważniejszych modeli zarządzania jakością usług. Studia i Prace Wydziału Nauk Ekonomicznych i Zarządzania 24, 7–23 (2011)
Brilman, J.: Nowoczesne Koncepcje i Metody Zarządzania. PWE, Warszawa (2002)
Brogowicz, A.A., Delene, L.M., Lyth, D.M.: A synthesised service quality model with managerial implications. Int. J. Serv. Ind. Manag. (1990). https://doi.org/10.1108/09564239010001640
Cambria, E., Hussain, A.: Sentic Computing: A Common-Sense-Based Framework for Concept-Level Sentiment Analysis. Springer, no place of issuing (2015)
Cetin, G., Walls, A.: Understanding the customer experiences from the perspective of guests and hotel managers: empirical findings from luxury hotels in Istanbul, Turkey. J. Hosp. Market. Manag. 25(4), 395–424 (2016)
Cetnarowicz, T.: Polskie hotelarstwo w statystykach. Akademia Wychowania Fizycznego: Obsługa Ruchu Turystycznego. https://wtir.awf.krakow.pl/pdf/studenci/strony_st/projekty/branzowe/2007%20Cetnarowicz%20Tomasz%20Polskie%20hotelarstwo%20w%20statystykach.pdf, (2007). Accessed 15 July 2023
Chen, Y., Zhong, Y., Yu, S., Xiao, Y., Chen, S.: Exploring bidirectional performance of hotel attributes through online reviews based on sentiment analysis and Kano-IPA model. Appl. Sci. (2022). https://doi.org/10.3390/app12020692
Chiang, C.F., Chen, W.Y., Hsu, C.Y.: Classifying technological innovation attributes for hotels: an application of the Kano model. J. Travel Tour. Mark. (2019). https://doi.org/10.1080/10548408.2019.1575786
Chroboczyńska, M.: Stan dotychczasowych inwestycji hotelowych w Polsce. Innowrota. http://www.innowrota.pl/sites/default/files/images/M.Chroboczynska_1.pdf, Accessed 15 April 2015.
Coyle, M.P., Dale, B.G.: Quality in the hospitality industry: a study. Int. J. Hosp. Manag. (1993). https://doi.org/10.1016/0278-4319(93)90006-U
Cronin, J.J., Taylor, S.A.: SERVPERF versus SERVQUAL: reconciling performance-based and perception-minus-expectations measurement of service quality. J. Mark. (1994). https://doi.org/10.1177/002224299405800110
Crosby, P.B.: Quality Is Free: The Art of Making Quality Certain. New American Library, New York (1979)
Dabholkar, P.A., Shepherd, C.D., Thorpe, D.I.: A comprehensive framework for service quality: an investigation of critical conceptual and measurement issues through a longitudinal study. J. Retail. (2000). https://doi.org/10.1016/S0022-4359(00)00029-4
Dave, K., Lawrence, S., Pennock, D.M.: Mining the peanut gallery: opinion extraction and semantic classification of product reviews. WWW '03: Proceedings of the 12th international conference on World Wide Web (2003). https://doi.org/10.1145/775152.775226
Fick, G.R., Ritchie, J.R.B.: Measuring service quality in the travel and tourism industry. J. Travel Res. (1991). https://doi.org/10.1177/004728759103000201
Firlej, K., Spychalska, B.: Wybrane uwarunkowania rozwoju branży hotelarskiej w Polsce. Roczniki Ekonomiczne Kujawsko-Pomorskiej Szkoły Wyższej w Bydgoszczy 8, 202–221 (2015)
Furtak, R.: Marketing Partnerski na Rynku Usług. PWE, Warszawa (2003)
Ghotbabadi, A.R., Feiz, S., Baharun, R.: Service quality measurements: a review. Int. J. Acad. Res. Bus. Soc. Sci. (2015). https://doi.org/10.6007/IJARBSS/v5-i2/1484
Gołąb, E.: Jakość i relacje z klientami na rynku usług hotelarskich. Rozprawa doktorska, Politechnika Gdańska, Wydział Zarządzania i Ekonomii, Gdańsk. https://depot.ceon.pl/bitstream/handle/123456789/13181/Jakość%20i%20relacje%20z%20klientami%20na%20rynku%20usług%20hotelarskich.pdf?sequence=1&isAllowed=y (2009), Accessed 18 July 2023
Govender, K.K.: Proposing a model for managing service quality in the financial services industry, University of Transkei, South Africa. https://www.researchgate.net/publication/255602085_PROPOSING_A_MODEL_FOR_MANAGING_SERVICE_QUALITY_IN_THE_FINANCIAL_SERVICES_INDUSTRY/link/5739a0f608ae298602e3431a/download (1996), Accessed 19 June 2023
Grabiszewski, M.: Wstęp do Hotelarstwa. Regionalna Agencja Promocji Turystyki Sp. z o.o. w Bydgoszczy, Bydgoszcz (1998)
Grönroos, C.: Strategic Management and Marketing in the Service Sector, Helsingfors: Swedish School of Economics and Business Administration, Helsinki (1982)
Grönroos, C.: A service quality model and its marketing implications. Eur. J. Mark. 18(4), 36–44 (1984)
Gruszka, I., Ilnicki, D., Jakubowicz, E.: Wybrane Aspekty Lokalizacji Hoteli. Studia Miejskie 16, 101–114 (2014)
Gummesson, E., Grönroos, C.: Quality of services: lessons from the products sector. In: Suprenant, C. (ed.) Add Value to Your Service: The Key to Success, pp. 839–854. American Marketing Association, Chicago (1987)
Haywood-Farmer, J.: A conceptual model of service quality. Int. J. Oper. Prod. Manag. 8(6), 41–50 (1988)
Hearst, M.A.: Untangling Text Data Mining. Proceedings of ACL’99: the 37th Annual Meeting of the Association for Computational Linguistics, University of Maryland. http://www.sims.berkeley.edu/~hearst/papers/acl99/ acl99-tdm.html (1999), Accessed 23 June 2023
Houdré, H.: Sustainable development in the hotel industry. Cornell Hospitality Industry Perspectives 2, 6–20 (2008)
https://stat.gov.pl/statystyka-regionalna/jednostki-terytorialne/podzial-administracyjny-polski/
Jain, P., Aggarwal, V.: Service quality models: a review. Bvimsr’s J. Manag. Res. (BJMR) 7(2), 125–136 (2015)
Jain, S.K., Gupta, G.: Measuring service quality: servqual vs servperf scales. Vikalpa (2004). https://doi.org/10.1177/025609092004020
Johann, M.: Satysfakcja Klienta na Rynku Usług Turystycznych. Difin, Warszawa (2019)
Kachniewska, M.: Uwarunkowania konkurencyjności przedsiębiorstwa hotelowego. Szkoła Główna Handlowa w Warszawie, Warszawa (2009)
Kano, N., Seraku, N., Takahashi, F.: Attractive quality and must-be Quality. J. Jpn. Soc. Qual. Control 14(2), 39–48 (1984)
Karaszewski, R.: SERVQUAL – metoda badania jakości świadczonych usług. Probl. Jakości 5, 8–10 (2001)
Knutson, B., Stevens, P., Wullaert, C., Patton, M., Yokoyama, F.: Lodgserv: a service quality index for the lodging industry. Hosp. Res. J. 14(2), 277–284 (1990)
Kohonen, T.: Self-organized formation of topologically correct feature maps. Biol. Cybern. 43, 59–69 (1982)
Lau, K.-N., Lee, K.-H., Ho, Y.: Text mining for the hotel industry. Cornell Hotel Restaur. Admin. Quart. (2005). https://doi.org/10.1177/0010880405275966
Lee, A.S.H., Yusoff, Z., Zainol, Z., Pillai, V.: Know your Hotels Well! An online review analysis using text analytics. Int. J. Eng. Technol. 7(4.31), 341–347 (2018)
Lehtinen, U., Lehtinen, J.R.: Service Quality: A Study of Quality Dimensions. Service Management Institute, Helsinki (1992)
Li, S., Xiao, Q.: Classification and improvement strategy for design features of mobile tourist guide application: a Kano-IPA approach. Mob. Inf. Syst. (2020). https://doi.org/10.1155/2020/8816130
Liu, B.: Sentiment Analysis and Opinion Mining. Morgan & Claypool Publishers, no place of issuing (2012)
Liu, B.: Sentiment Analysis and Subjectivity. Handbook of Natural Language Processing, New York (2010)
Liu, B.: Sentiment Analysis: Mining Sentiments, Opinions. And Emotions. Cambridge University Press, Cambridge (2020)
Lula, P.: Text Mining jako Narzędzie Pozyskiwania Informacji z Dokumentów Tekstowych. StatSoft Polska, Kraków (2005)
Martilla, J.A., James, J.C.: Importance-performance analysis. J. Mark. 41(1), 77–79 (1977)
Maślankowski, J.: Automatyczna analiza treści nieustrukturyzowanej jako przykład źródła informacji dla administracji publicznej. Roczniki Kolegium Analiz Ekonomicznych 46, 161–172 (2017)
Medhat, W., Hassan, A., Korashy, H.: Sentiment analysis algorithms and applications: a survey. Ain Shams Eng. J. (2014). https://doi.org/10.1016/j.asej.2014.04.011
Mei, A.W.O., Dean, A.M., White, C.J.: Analysing service quality in the hospitality industry: managing service quality. An Int. J. 9(2), 136–143 (1999)
Moore, C.D.: Outclass the competition with service distinction. Mortg. Bank. 47(11), 24–32 (1987)
Nash, C.A.: Question of Service: Action Pack. Business Management Programme, Hotel and Catering Industry Training Board, National Consumer Council, London (1988)
Nasukawa, T., Yi, J.: Sentiment analysis: capturing favourability using natural language processing (2003), https://doi.org/10.1145/945645.945658
Nowakowski, M.: Słownik Terminów Związanych z Turystyką i Hotelarstwem. Górnośląska Wyższa Szkoła Handlowa, Katowice (2001)
Panasiuk, A., Szostak, D.: Hotelarstwo – Usługi – Eksploatacja – Zarządzanie. Wydawnictwo Naukowe PWN, Warszawa (2009)
Panasiuk, A. (ed.): Marketing Usług Turystycznych. PWN, Warszawa (2005)
Parasuraman, A., Berry, L.L., Zeithaml, V.A.: Refinement and reassessment of the SERVQUAL scale. J. Retail. 67(4), 420–450 (1991a)
Parasuraman, A., Zeithaml, V.A., Berry, L.L.: Alternative scales for measuring service quality: a comparative assessment based on psychometric and diagnostic criteria. J. Mark. (1994). https://doi.org/10.1016/0022-4359(94)90033-7
Parasuraman, A., Zeithaml, V.A., Berry, L.L.: Delivering quality service: balancing customer perceptions and expectations. The Free Press, New York (1991b)
Parasuraman, A., Zeithaml, V.A., Berry, L.L.: SERVQUAL: a multiple-item scale for measuring consumer perceptions of service quality. J. Retail. 64(1), 12–40 (1988)
Parasuraman, A., Zeithaml, V.A., Berry, L.L.: Conceptual model of service quality and its implications for future research. The J. Market. 49(4), 41–50 (1985)
Polish Statistical Office; https://bdl.stat.gov.pl/bdl/dane/podgrup/tablica
Puciato, D.: Przesłanki lokalizacji wybranych przedsiębiorstw hotelowych w Opolu. Infrastruktura i Ekologia Terenów Wiejskich 2, 113–120 (2012)
Rapacz, A.: Przedsiębiorstwo Turystyczne. Difin, Warszawa (2007)
Raport 2022. Rynek hotelarski w Polsce. Świat Hoteli 2022. https://issuu.com/brogmarketing/docs/rynek_hotelarski_w_polsce_-_raport_2022 (2022). Accessed 2 August 2023
Rudawska, E., Kiecko, R.: Servqual – metoda badania jakości usług i jej praktyczne zastosowanie. Marketing i Rynek 5, 23–28 (2000)
Scanlan, L., McPhail, J.: Forming service relationships with hotel business travelers: the critical attributes to improve retention. J. Hosp. Tour. Res. (2000). https://doi.org/10.1177/109634800002400405
Schreiber, M.T.: Kongress- und Tagungsmanagement. R. Oldenbourg Verlag, München (2002)
Seth, N., Deshmukh, S.G., Vrat, P.: Service quality models: a review. Int. J. Qual. Reliab. Manag. (2005). https://doi.org/10.1108/02656710510625211
Sigala, M.: Special Issue on Web 20 in travel and tourism: Empowering and changing the role of travelers Preface. Computers in Human Behavior, (2011). https://doi.org/10.1016/j.chb.2010.04.005
Spreng, R.A., Mackoy, R.D.: An empirical examination of a model of perceived service quality and satisfaction. J. Retail. 722, 201–214 (1996)
Stoma, M.: Modele i Metody Pomiaru Jakości Usług, Q&R Polska Sp. z o.o., Lublin (2012)
Sultan, K., Ahmed, R.R., Jafar, R., Murtaza, M.M., Gardi, B.: Corporate financial policy and its impact on sustainable capital structure: empirical evidence from textile firms of Pakistan. Human. Soc. Sci. Rev. (2020). https://doi.org/10.18510/hssr.2020.8218
Świstak, E., Świątkowska, M., Stangierska, D.: Strategia zrównoważonego rozwoju w hotelarstwie na przykładzie grupy Accor. Handel Wewnętrzny 1(360), 133–142 (2016)
Thorsten J.: Text Categorization with Support Vector Machines: Learning with Many Relevant Features, In: Proceedings of ECML-98, 10th European Conference on Machine Learning, edited by Claire Nédellec and Céline Rouveirol, Springer-Verlag (1998)
Tomanek, K.: Analiza sentymentu – metoda analizy danych jakościowych. Przykład zastosowania oraz ewaluacja słownika RID i metody klasyfikacji Bayesa w analizie danych jakościowych. Przegląd Socjologii Jakościowej 10(2), 118–136 (2014)
Tourism 2022, Statistics Poland. Statistical Office in Rzeszów. Warszawa, Rzeszów (2023)
Tsung-Yu, Ch., Chia-Lun, H., Mei-Chyi, Ch.: A fuzzy-multicriteria decision model for International tourist hotels location selection. Int. J. Hosp. Manag. 27(2), 293–301 (2008)
Turek, T.: Możliwości wykorzystania analizy sentymentu w procesach prosumenckich. Ekonomiczne Problemy Usług (2017). https://doi.org/10.18276/epu.2017.126/2-29
Turkowski, M.: Marketing Usług Hotelarskich. PWE, Warszawa (1997)
Ustawa z dnia 29 sierpnia 1997 r. o usługach turystycznych, Dz. U. Nr 133, poz. 884, art. 36
de Velasco, M., Justo, R., López Zorrilla, A., Inés, T.M.: Analysis of deep learning-based decision-making in an emotional spontaneous speech task. Comput. Sci. (2023). https://doi.org/10.3390/app13020980
Vermeulen, I.E., Seegers, D.: Tried and tested: the impact of online hotel reviews on consumer consideration. Tour. Manage. (2009). https://doi.org/10.1016/j.tourman.2008.04.008
Walas, B.: Marketingowa Strategia Polski w Sektorze Turystyki na Lata 2012 – 2020. Polska Organizacja Turystyczna, Warszawa (2011)
Wilk, W.: Czynniki Lokalizacji i Rozmieszczenie Wybranych Usług w Warszawie. Wydział Geografii i Studiów Regionalnych, Uniwersytet Warszawski, Warszawa (2001)
Witkowski, Cz.: Kierowanie Przedsiębiorstwem Hotelarskim. Wyższa Szkoła Ekonomiczna w Warszawie, Warszawa (1998)
Wojciechowska, I.: Ocena jakości usług hotelarskich przez użytkowników portalu booking.com a działania organizacyjne podejmowane przez menedżerów – na przykładzie Lublina, Annales Universitatis Mariae Curie-Sklodowska, vol. LXXVI sectio B (2021). https://doi.org/10.17951/b.2022.77.0.149-176
Wong, P.C., Whitney, P., Thomas, J.: Visualizing association rules for text mining. Pacific Northwest National Laboratory (1999) https://citeseerx.ist.psu.edu/document?repid=rep1&type=pdf&doi=15071475d0adeaee9f3ed7781c81f69d182e57d1.
Xu, X., Li, Y.: The antecedents of customer satisfaction and dissatisfaction toward various types of hotels: a text mining approach. Int. J. Hosp. Manag. (2016). https://doi.org/10.1016/j.ijhm.2016.03.003
Yang Y., Liu X.: A Re-Examination of Text Categorization Methods, 22nd Annual International SIGIR (1999). https://doi.org/10.1145/312624.312647
Yang, Y., Wong, K.F., Wang, T.: How do hotels choose their location? Evidence from hotels in Beijing. Int. J. Hosp. Manag. (2012). https://doi.org/10.1016/j.ijhm.2011.09.003
Yarimoglu, E.K.: A review on dimensions of service quality models. J. Mark. Manag. 2(2), 79–93 (2014)
Zhao, M., Zhang, C., Hu, Y., Xu, Z., Liu, H.: Modelling consumer satisfaction based on online reviews using the improved kano model from the perspective of risk attitude and aspiration. Technol. Econ. Dev. Econ. (2021). https://doi.org/10.3846/tede.2021.14223
Funding
The authors declare that no funds, grants, or other support were received during the preparation of this manuscript
Author information
Authors and Affiliations
Contributions
MK: Conceptualization, Writing—original draft preparation, Investigation, Resources, Writing—Review & Editing, Supervision. JK: Methodology, Writing—original draft preparation, Formal analysis and Investigation, Visualization, Validation.
Corresponding author
Ethics declarations
Conflict of interest
The authors have no financial interests to disclose. The authors have no competing interests to declare that are relevant to the content of this article.
Additional information
Publisher's Note
Springer Nature remains neutral with regard to jurisdictional claims in published maps and institutional affiliations.
Appendices
Appendix A
1.1 Positive terms list
Adequate; adequately; affecting; beautiful; beautifully; best; better; convincing; ecstatic; effective; effectively; efficient; efficiently; fine; good; gripping; happy; magnificent; nice; outstanding; positive; positively; pretty; professional; professionally; reliable; satisfied; success; successful; successfully; super; superb; valuable; well; win; wonderful; worth; worthy.
1.2 Negative terms list
Bad; break; broken; destroy; destroyed; dirty; disappointed; disappointing; disillusion; disrupt; dull; inadequate; lousy; miserable; missing; monotone; mundane; plain; poor; poorest; shit; shitty; spoiled; tacky; unclean; unfortunate; unfortunately; unhappy; uninteresting; unprofessional; unreliable; unsatisfied; unsuccessful; unsuccessfully; untrue; invaluable; unworthy; valueless; wasted; worse; worst; defeat; lack; failure; tragedy; loss; sufferance; disappointment; disaster.
Appendix B
2.1 Pseudo code of the algorithm for determining document sentiment
-
Step 1 Find key term candidates for determining sentiment by seeking the following constructions:
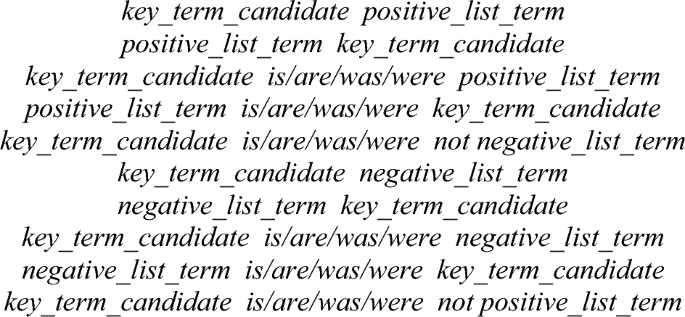
Commas are allowed to appear between the words, but full stops are disallowed. First five constructions define positive context candidates and the last five define the negative context candidates.
-
Step 2 Find key terms by selecting only those key term candidates which appear both in positive and negative contexts and do not appear in neither the positive nor negative terms list.
-
Step 3 Classify as positive documents the ones which meet one of the following conditions:
-
Appearance of a key term accompanied by a term from the positive list without any negation in any place in the document (unless negation of a negative list term);
-
Appearance of a key term accompanied by a negated term from the negative list without any negation in any place in the document (unless negation of a negative list term);
-
Appearance of recommend/recommendable independently of other terms in the document.
-
-
Step 4 Classify as negative documents the ones which meet one of the following conditions:
-
Appearance of a key term accompanied by a term from the negative list without any negation in any place in the document (unless negation of a positive list term);
-
Appearance of a key term accompanied by a negated term from the positive list without any negation in any place in the document (unless negation of a positive list term);
-
Appearance of negated recommend/recommendable independently of other terms in the document.
-
-
Step 5 The document which is not classified assign to either positive or negative class applying the following majority rule: the relative (with respect to the density of classes already possessed) percentage of terms present in the document and in at least one of the classes already possessed.
-
Step 6 The documents which are not classified assign to the neutral class.

Rights and permissions
Open Access This article is licensed under a Creative Commons Attribution 4.0 International License, which permits use, sharing, adaptation, distribution and reproduction in any medium or format, as long as you give appropriate credit to the original author(s) and the source, provide a link to the Creative Commons licence, and indicate if changes were made. The images or other third party material in this article are included in the article's Creative Commons licence, unless indicated otherwise in a credit line to the material. If material is not included in the article's Creative Commons licence and your intended use is not permitted by statutory regulation or exceeds the permitted use, you will need to obtain permission directly from the copyright holder. To view a copy of this licence, visit http://creativecommons.org/licenses/by/4.0/.
About this article

Cite this article
Kozłowski, M., Korzeniewski, J. Studying the effectiveness of investments in hotel services using customer sentiment analysis. Qual Quant (2024). https://doi.org/10.1007/s11135-023-01808-3
Accepted:
Published:
DOI: https://doi.org/10.1007/s11135-023-01808-3