
Abstract
Belief systems matter for all kinds of human social interaction. People have individual cognitions and feelings concerning processes in their environment, which is why they may evaluate them differently. Belief systems can be visualized with cognitive-affective maps (CAMs; as reported by Thagard (in: McGregor (ed) EMPATHICA: A computer support system with visual representations for cognitive-affective mapping, AAAI Press, CA, 2010)). However, it is unclear whether CAMs can be constructed in an intersubjective way by different researchers attempting to map the beliefs of a third party based on qualitative text data. To scrutinize this question, we combined qualitative strategies and quantitative methods of text and network analysis in a case study examining belief networks about participation. Our data set consists of 10 sets of two empirical CAMs: the first CAM was created based on participants’ freely associating concepts related to participation in education (N = 10), the second one was created based on given text data which the participants represented as a CAM following a standardized instruction manual (N = 10). Both CAM-types were compared along three dimensions of similarity (network similarity, concept association similarity, affective similarity). On all dimensions of similarity, there was substantially higher intersubjective agreement in the text-based CAMs than in the free CAMs, supporting the viability of cognitive affective mapping as an intersubjective research method for studying the emotional coherence of belief systems and discursive knowledge. In addition, this study highlights the potential for identifying group-level differences based on how participants associate concepts.
Find the latest articles, discoveries, and news in related topics.Avoid common mistakes on your manuscript.
1 Introduction
Belief systems matter for all kinds of human social interaction. Much research has, therefore, been devoted to developing methods for understanding belief systems, both for analytical purposes and for practical interventions in organizational development, conflict mediation, and the like. One such method is cognitive mapping, a network technique “to visualize the conceptual structures that people use to represent important aspects of the world” (Homer-Dixon et al. 2014: 2; cf. Axelrod 1976; Kitchin 1994; Özesmi and Özesmi 2004). More recently, Thagard and colleagues have developed a variant, cognitive-affective mapping, to account for the observation that semantic cognition is grounded in, and often biased by, affective associations (Thagard 2006, 2010; Homer-Dixon et al. 2014). Cognitive-affective maps (CAMs) allow the researcher to visualize the affective coherence of a set of interdependent concepts in terms of their associations. Going beyond established cognitive-mapping techniques, CAMs guide researchers’ and practitioners’ attention to the motivational and value-laden structuring principles underlying belief systems.
Despite a flourishing research program built on the CAM methodology, empirical evidence supporting the intersubjectivityFootnote 1 and reproducibility of CAMs has been unsatisfactory. One could argue that the process of producing a map from data such as interview transcripts, speeches, or social media is highly subjective, depending on the personal interpretations of the mapper. Therefore, our goal in the present study is to assess to what extent CAMs produced by different researchers, who follow a standardized instruction manual, result in broad intersubjective agreement about cconcepts with respect to their affective values and associations (investigator triangulation, cf. Denzin 1978, 1989; Tracy 2010; Flick 2016).
The paper begins with a brief description of the theory behind cognitive affective mapping as well as a brief review of its conventions and previous applications. We then present our case study, which was part of a research project on the transformation of beliefs of early-childhood educational professionals. The project afforded us a good context for the present study, because discourse around educational innovation is emotionally contested due to its value-laden nature. Our strategy is to compare two scenarios: one, where research participants produced CAMs of their own subjective beliefs about an educational topic, and another, where they were instructed to follow a standardized manual to produce CAMs representing the beliefs of a third party expressed in a text. We use a combination of Grounded Theory (a qualitative method; see Glaser and Strauss 2010) and social network analysis to describe the similarity of the resulting CAMs within and across the two scenarios. We conclude with a discussion of the connection between subjective and discursive affect and knowledge as captured in CAMs.
2 Theory and background
2.1 Cognitive and affective foundations of belief systems
Our fundamental sociological notion is that any individual perspective on a topic contains discursive knowledge transported via semantics that members of a particular (cultural) group are able to decode intersubjectively (cf. Berger and Luckmann 1980). The resulting shared semantic cognitions allow people to synchronize their social interactions in alignment with the cultural norms of their reference groups. Importantly, the emerging belief systems are grounded in affective experience (Ambrasat et al. 2014; Heise 2007; von Scheve 2009). Therefore, we often “feel what is right” rather than building on sophisticated rational justifications (Haidt 2001; Heise 2007). Consequently, the affective component of people’s beliefs requires attention to understand subtle drivers of conflict, resistance to innovation, or other social phenomena. Cognitive-affective mapping (CAM) was developed to this end.
CAM is explicitly based on Thagard’s (2006) theory of emotional coherence. Note that the terminology is a bit inexact as many psychologists refer to “emotions” as specific ephemeral events involving coupled physiological, cognitive, and experiential processes (e.g., Barrett and Russel, 2014; Kajić et al. 2019). CAMs and the underlying coherence theory are mainly concerned with enduring affective meanings of concepts (cf. Ambrasat et al. 2014; Heise 2007), which are assumed to motivate and constrain human cognition, subsequent processes (which may include specific “emotions”), and actions (Mercer 2010; Thagard 2006).
The human mind is a cognitive system of various interconnected representations of the environment, where each conceptual element is valued either affectively positive or negative. The value of a concept is influenced by all connected elements and their associated values. “When people are making sense of a text or making inferences about others, they construct an interpretation that fits with the available information better than alternative interpretations. The best interpretation is one that provides the most coherent account of what we want to understand, considering both pieces of information that fit with each other and pieces of information that do not fit with each other” (Thagard and Verbeurgt 1998: 2). Each individual has their own specific cognitive-affective system processing environmental information. However, that information is then perceived preferentially and classified as important if it is compatible with the existing representations. In other words, it generates maximum coherence (Thagard 2006).
2.2 General structure of CAMs
Structurally, CAMs are networks of concepts, more precisely undirected, labeled graphs, representing any possible topic (Thagard 2010). Within a CAM, the concepts are represented as nodes, associations as edges, similar to many other cognitive-mapping approaches (e.g., Axelrod 1976; Kitchin 1994; Özesmi and Özesmi 2004). The graph consists of an individual’s or collective’s set of interconnected concepts. In the case of a CAM, there is an additional affective value, represented by a certain shape and color (see Fig. 1). The associations between concepts are coherent or incoherent, depending on the attributed values. A coherent relation visualizes mutually reinforcing concepts. An incoherent relation displays the emotional compatibility of two concepts. For an illustration, see Fig. 1: The concepts ‘health’ and’sports’ have a positive value (green oval), their association is coherent. The concept ‘cancer’ is emotionally negative (red hexagon) and therefore has an incoherent association with the concept ‘health’. The concept ‘weather’ has a neutral emotional value (yellow rectangle), the concept ‘aging’ is ambivalent (purple oval/hexagon), their associations are always coherent.

Concepts and associations (Thagard 2010; Findlay and Thagard 2014)
2.3 Fields of CAM application
CAMs have been used by researchers from multiple disciplines. Political scientists, for example, have mapped the mental states of social disputants with the aim to contribute to resolving conflicts based on knowledge about differences between the disputants’ perspectives (e.g., Findlay and Thagard 2014; Homer-Dixon et al. 2013; Thagard 2010). Furthermore, cognitive affective mapping can reveal ideologies by visualizing the concept associations that give them their coherence (Homer-Dixon et al. 2014), and thus detect, for example, ideological barriers to implement innovations in different fields (e.g., Wolfe 2012; Bormann et al. 2018). According to Milkoreit (2012), a number of applications of the method are conceivable, including: understanding individual thinking, collective views and processes of social and institutional change, comparing beliefs across various individuals, exploring the relationship between individual and collective understandings and how this relationship influences mental dynamics (Milkoreit 2012: 7ff).
2.4 Data collection and exploring intersubjectivity with CAMs
The data used to generate a CAM are not restricted to eliciting associations from individuals, i.e., they can also be developed using any kind of written text. There are basically two feasible ways to produce CAMs. They can either be created by respondents themselves, once they have been introduced to the scientific conventions, or the researcher can create a CAM based on their analytical interpretation of a text.
The central question that arises regarding the intersubjectivity of CAMs created by different people is of a methodical-reflexive kind. Like any other piece of research, developing a CAM based on secondary sources needs to meet high standards of research and comply with quality criteria. In qualitative research, different validation strategies are applied. Researchers are not only asked to explain their prior knowledge but also any sensitivities they may have regarding the topic (Strauss and Corbin 1996). With regard to the process of analysis, coding manuals with anchor examples and coding instructions need to be developed to make sure the coding procedure is based on reliable rules and remains the same across time and between different researchers (e.g., Flick 2016). In addition to convening interpretation groups that jointly evaluate material with the goal of achieving high inter-coder reliability through discussions on their preliminary interpretations, data quality can be improved through a joint interpretation of a small selection of the material. This can be achieved by including discussion of differing codes, revision, and so on (e.g., Tracy 2010; Flick 2016).
The validity of CAMs which respondents developed on their own can be confirmed directly by the participants. If researchers develop CAMs based on their interpretation of texts, they are challenged to verify the CAM’s validity. Homer-Dixon et al. (2014) and Milkoreit (2013) suggest the following strategies especially for CAMs:
-
(1)
Discuss a CAM created by a researcher with the respondents themselves (communicative validation, see Flick 2016),
-
(2)
Discuss it with other people who are well-informed of the respondent’s perspectives (communicative validation, ibid.),
-
(3)
Assess it against data that represents the respondent’s views but has not been considered in the process so far (Homer-Dixon et al. 2014: 3; theoretical saturation, see Strauss and Corbin), or
-
(4)
Compare, when possible, maps of the same material generated by multiple researchers and discuss the results (Milkoreit 2013: 82; investigator triangulation: Denzin 1978, 1989).
After all, CAMs as well as other cognitive maps are unlikely to capture an ‘objective’ view on any topic (e.g., Doyle and Ford 1998). Nevertheless, we assume that certain concepts and values are shared by groups. Our approach is built on the possibility that this is manifested in the structure of CAMs as discursive concepts, associations, and values.
To assess how intersubjective CAMs are, it is necessary to identify similarity measures in order to compare them in a comprehensible way. The triangulation of qualitative and quantitative methods is applied to our data in order to reveal both in-depth similarities and statistical measurements. Next, we explain our data collection and analytical strategy.
3 Case study
The case study presented here is part of a larger study analyzing the implementation of a social innovation in the field of early childhood education and care (EQUIPFootnote 2). Using the example of participation, we asked ten people to map their personal associations in a ‘Free CAM’ aiming to see if we could identify the level of intersubjectivity between participants by comparing their unguided responses, and in this way identify if there is common discourse about participation (scenario 1). Later, we asked the same people to map a text on the topic irrespective of their own associations in a ‘Text CAM’ (scenario 2). This step primarily deals with the question of how intersubjective CAMs are when the participants reproduce manual-based text data of a third party; in other words: what maximum intersubjectivity can be achieved with the method? To this end, we created a brief instructional manual to teach participants a standardized procedure (see Appendix A).
3.1 Sample
The ad-hoc sample consists of five students (P4, P5, P6, P7, P10) and five academic researchers (P1, P2, P3, P8, P9) affiliated with the Master's program in Early Education at the University of Applied Sciences Potsdam, Department of Social and Educational Sciences. All participants were novices to the CAM methodology and native German speakers. They created all CAMs freehand with paper and pens. Our sample consists of two network subsets, 10 free CAMs and 10 text CAMs.
(N = 20):
-
1st scenario—After a short introduction to the method based on Thagard (2014), the participants each generated a ‘Free CAM’ individually (according to idiosyncratic maps, see Cossette and Audet 1992). Participation was given as an affectively undefined element. Our goal was to familiarize the participants with the method, to accompany them during their first mapping, and to sensitize them to the topic itself.
-
2nd scenario—Approximately four weeks later, the same participants received a repeated introduction to the methodFootnote 3 and an instructional manual. The participants had to map a ‘Text CAM’ based on an excerpt from a German educational program for day-care centers containing one third party’s perspective on participation. The term participation itself is omnipresent; in social work it is used frequently, yet with vastly different meanings, associated values, and contexts (Urban 2005; Straßburger and Rieger 2019). An example can be found in Fig. 2.
Fig. 2 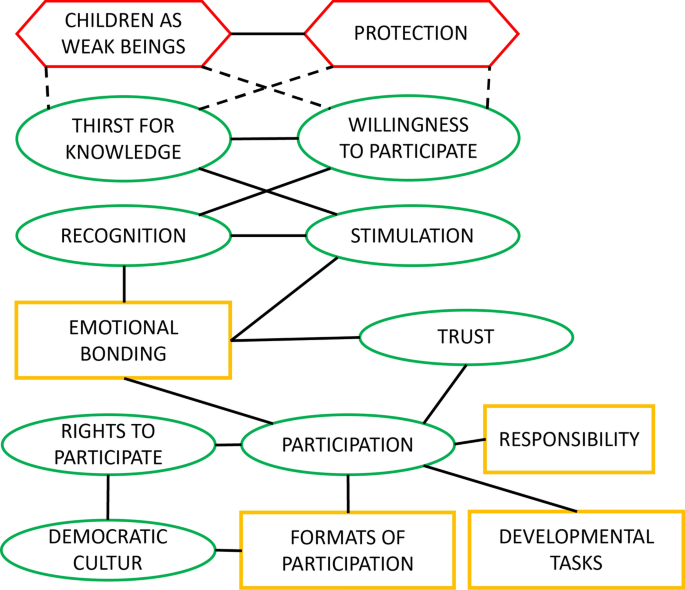
Original (translated) empirical Text CAM (participant 8)

3.2 Grouping concepts and translation as a qualitative analysis step
As a first interpretive step, all concepts were clustered, merged into groups, and labeled inductively.Footnote 4 This alignment of the elements was necessary for the following analyses; e.g., the element ‘the adults are responsible’ in one CAM and the element ‘responsibility of the adults’ in another CAM were replaced by the element 'Responsibility' in both CAMs. The original association between the concepts and the added values were preserved. We converted all CAMs into adjacency matrices (see an excerpt in Appendix A2).
Fundamentally, the interpretative process followed the strategies of the Grounded Theory Methodology (Glaser and Strauss 2010; Luthardt et al., 2020). The theoretical sensitivity and the resulting interpretations of the researcher were reflected in a collegial analysis group (collegial validation, cf. Przyborski and Wohlrab-Sahr 2014).
3.3 Quantitative analysis strategy
We compared three types of CAMs to perform our analyses (see Fig. 3). We compared free and text CAMs to each other, and to simulated networks. The simulations are necessary to determine whether the observed similarity between a given pair of free or text CAMs is greater than we would expect based on chance. With this baseline, we can then assess to what extent prevailing social (common) knowledge influenced the associations participants made. Our hypothesis is that maps that are more similar to each other reflect higher levels of intersubjectivity, and thus more shared meanings.

Different sets of CAMs in our case study
As an analytical baseline, we simulated data by establishing a network null model (Robins et al. 2007) where associations between any pair of nodes is random, but where the overall structure of the graph is similar to the observed graphs. We do this by generating random graphs that have a similar degree distributions and levels of transitive closure (i.e., similar levels of connectedness) using the de Solla Price model (de Solla Price 1965). In this way, we generate a set of graphs that is structurally similar at the system level to the CAMs, but that can vary widely in terms of the ties between a particular set of concepts.
Our analysis strategy consists of the following steps:
3.3.1 Calculating network similarity, i.e., how similar is each participant’s CAM to the CAMs of the other participants
We approach CAMs—as a specialized type of network—by constructing a canonical edgelist for each participant (list of all observed and possible associations) and generating similarity scores based on these lists. By doing this, we assume that each participant, theoretically, could have made an association between any two concepts (i.e., all participants are aware of common set of concepts that they could then associate or not). We refer to the edgelist as canonical because it represents all possible pairs of associations between concepts being studied.
An edgelist, shown in Table 1, is a three-column matrix: the first column indicates one entity (e.g., a person, or in our case a concept, such as ‘Participation’); the second column another entity, usually of the same type (another concept in our case); and the third column whether there is a tie (1) or not (0) between the two entities. Each row indicates a unique pair of entities; and in an undirected network such as a CAM, each pair only occurs only once. Because the edgelist includes all possible pair combinations within a CAM, it contains all the network’s topological information including not only all its dyads but also all higher order features, such as triads and cycles. We use this edgelist to construct a string or vector of values per CAM that allows us to compare one network to another. If vector positions are consistent for all networks being compared, we can calculate the similarity of each CAM to all other CAMs as the similarity between their tie values. Once transformed into a feature vector, we calculate the similarity between two CAMs as the angular similarity between the two vectors. Angular similarity is one of a family of methods for measuring association that includes cosine similarity, Pearson correlations, and OLS coefficients (for detailed explanation of the metric, see Appendix B).
3.3.2 Calculating concept association similarity, i.e., how consistently is a concept associated with other concepts by the participants
In addition to calculating how similar each participant’s network is to all other networks, we also examine how consistently concepts are connected to other concepts. We refer to this type of similarity as concept association similarity. We use this similarity metric to distinguish between concepts that appear frequently but vary from anchor concepts (identified via initial qualitative analysis) in how consistently they are connected. Anchor concepts not only appear frequently but are also consistently connected to the same concepts. We measure a concept’s association similarity by applying a procedure very similar to the one described above; except, instead of calculating the angular similarity of each participant to all other participants with respect to their concept association network, we calculate the angular similarity of each concept to all other concepts across the ten participants (for details, see Appendix C).
3.3.3 Calculating affective similarity, i.e., how similar are the participants in terms of how they evaluated concepts affectively
To compare the affective similarities of the participants’ concept ratings, we first construct a concept-level affective valence score based on the valences reported by the participant and the concept’s frequency in the CAM. Participants could rate a concept as negative, neutral, positive, or ambivalent: − 1, 0, 1, and − 1,1 respectivelyFootnote 5 (for details, see Appendix D).
Mathematically, all these metrics involve a vector representation of the CAM networks, allowing us to use linear algebra to quantitatively compare the CAMs. In each case, we calculated the vectors’ angular similarity by recovering the angle of the two vectors from their cosine similarity (see Appendix B). Cosine similarity, in turn, is related to the Pearson correlation coefficient, except that the measure is normalized only with respect to the vectors’ magnitudes, rather than with respect to both their magnitudes and means. The resulting metric is a straightforward measure of similarity that ranges from 0 to 1.
3.3.4 Random Network Analysis: Features Comparison
When making claims about how one network differs from another, it is important to compare the observed networks to a null-model to establish whether the differences are greater than would be expected by chance (Mucha et al. 2010). We wanted to find out whether the concepts within the Text or Free CAMs were randomly associated with each other or whether there were intentional (discursive) associations between them. To do this, we simulated a dataset of CAMs as a reference as described above.
To establish that the Text CAMs are more similar to each other than the Free CAMs, we compared both scenarios to random networks generated using a variant of the de Solla Price Model (de Solla Price 1965, 1976) implemented in Pajek (de Nooy et al. 2018). The model is a preferential attachment model that generates ties based on a fixed probability and a probability proportional to the in-degree of the node (for details and brief discussion of the rationale for this choice see Appendix E).
3.3.5 Random network analysis: pairwise similarities
The next step includes the comparison of the pairwise similarities of the empirical and simulated networks for each map type (45 and 499,500 pairs, respectively) (for details see Appendix F).
In addition to these similarity analyses, we examine participants’ CAMs using a variety of social network analysis measures to demonstrate more concretely how the two CAM-types differ from each other.
4 Results
All findings presented below are based on the networks resulting from the analytical steps described in Sect. 3.3. To provide an initial sense of the performed analyses, we first present our general findings concerning the similarity metrics, and then elaborate on the results in detail.
4.1 Fundamental findings: similarity metrics
Table 2 presents a descriptive summary of each metric for the Free and Text CAMs, respectively.
We find that the participants’ Free and Text CAMs differ from each other on all three dimensions of similarity. The Text CAMs exhibit a far higher average and max similarity on every metric, providing initial evidence that the participants had a common understanding of the text. Participants are far more similar in terms of the affective meanings they attribute to the concepts than in how they associate them. Nevertheless, despite the seemingly low network similarities, there are some concepts in both the Free and Text CAMs that the participants consistently associate with other concepts as indicated by the mean and max concept association scores.
To address the statistical significance of these findings, we used the BCa (bias-corrected and accelerated) bootstrap procedure to construct robust confidence intervals. We compared the confidence intervals of the four networks’ angular similarity scores to provide a visual sense of the magnitudes of the differences because our simulated sample sizes are large enough that relatively small differences are likely to be significant. We then present p-values calculated using the Van der Waerden procedure (1952) to supplement the simulation analyses.
The shapes of the angular similarity score distributions (shown in Fig. 4), particularly the Free CAMs’ empirical distribution and simulated distributions, necessitate using procedures that account for the non-normality of the residuals.

Text and Free CAMs Empirical and Simulated Angular Similarity Scores
The long tails of the simulated distributions result from the sheer size of the sample (499, 500 comparisons). Although the simulated maps were similar in structure to the empirical maps (see Appendix C), the simulated networks distributions are centered on zero. While the networks were similar with respect to their tie configurations, which nodes occupied which positions in the network was entirely random. Nevertheless, with so many comparisons, there were occasionally network pairs that were randomly more similar, resulting in the long tails we see in Fig. 4. For the Free CAMs, the unstructured nature of the prompt most likely contributed to the skew, but we cannot rule out other factors.
Because we are comparing multiple distributions whose underlying probability distributions potentially differ, we use non-parametric methods to estimate a confidence interval for each distribution based on the data. We use a relatively straightforward bootstrap procedure (BCa) that randomly samples from the observed distribution to construct a percentile confidence interval, but which adjusts the endpoints of the interval to account for potential skewness in the bootstrap samples (Chernick and LaBudde 2011; Davison and Hinkley 1997; Efron and Tibshirani 1986) (Table 3).
Finally, we calculate p-values using Van der Waerden post hoc tests confirming the bootstrap sample results (Table 4) to account for the non-normality of the samples’ residuals (for more details regarding the procedure see Conover 1999).
4.2 Findings in detail: common concepts
In the following we present our findings concerning concepts common to both scenarios:
4.2.1 General categorization of concepts
To a large extent, the concepts within both CAM-types are on a similar level of abstraction. However, there are also concepts that exist at different levels of abstraction: consider the concept children, which is more differentiated in some CAMs. If a concept seemed to imply multiple meanings to the participant, we found additional attributes to specify the concept and to underline its emotional value, i.e., the concepts children as weak beings was mostly associated with a negative emotional value, whereas children as strong beings was mostly associated with a positive emotional value. Most concepts are nouns and can be roughly sorted by theme, illustrated below by some examples. Some concepts can be assigned to several categories, depending on their interpretation. Core categories of concepts we found in both scenarios were:
-
Participants: children, adults, team
-
Formal legitimation: rights, children’s rights, policy
-
Conditions: equality, justice, emotional bonding, stimulation, satisfaction of needs
-
Formats: dialogue, negotiation, interaction, debates
-
Tasks: dealing with power, sharing knowledge, recognition, know-how
-
Benefits: democratic culture, self-efficacy, development, building confidence
-
Obstacles: asymmetry, excessive demands, frictions, exclusion
-
Evaluation: hype, alibi, ambivalence, complicated, disenchantment
-
Localization: urban planning, organization
4.2.2 Number of concepts
The number of concepts varies—as shown in Fig. 5—between participants and within participants in both scenarios with the number of concepts ranging between 11—25 for the Free CAMs and 14—21 concepts for the Text CAMs (although the manual sets the number of elements to a maximum of 15). It turns out that the manual (see Appendix A1) permits individuality.

Left: Number of mapped concepts in each participant’s Free CAM and Text CAM; Right: corresponding boxplot
4.2.3 Accumulation
Figure 6 shows the number of new concepts added per following CAM/participant. The order of the CAMs results from the decreasing number of new concepts they contain. The accumulation curve for the Text CAMs flattens more quickly than the curve for the Free CAMs. Both curves suggest that the participants detect more common concepts in the text than they associate freely. The rapid flattening of the Text CAM curve indicates that there is only a "limited" number of concepts in the text regardless of the number prescribed in the manual. These results provide evidence of discursive knowledge that can be referred to when participants map a concept like participation.

Accumulation curves free and text CAMs show how many new concepts are added per next CAM
4.2.4 Discursive emotional values
We next investigated the affective meanings of the concepts by focusing on two questions: Did the participants hold common affective meanings of the concepts? And was there greater agreement about those meanings when responding to a text in a structured way than when freely associating concepts based on a stimulus word?
Figure 7 (Free CAMs) and Fig. 8 (Text CAMs) display the total frequency of the concepts and their emotional values (for all concepts rated by at least three participants). Participation was the initial concept in both scenarios and has to be disregarded because it appears by design.

Discursive concepts and emotional values (Free CAMs) N = 10, blue box: shared concepts across both scenarios

Discursive concepts and emotional values (Text CAMs), N = 10; blue box: shared concepts across both scenarios
Figure 7 indicates that some of the shared concepts in the Free CAMs carried similar affective meanings for participants. For example, there is agreement that self-efficacy is positive. The meanings of the concepts (recognition, development, equality of perspectives, children’s rights, and shaping) are positive, whereas the concept frictions is perceived as negative. In the Text CAMs displayed in Fig. 8, we find agreement about the emotional valences of the concepts recognition, sharing knowledge, skills, willingness to participate, excessive demands.
There are, however, different emotional connotations for other concepts. These concepts include protection, demand of performance, limits, negotiations and children’s rights. We find a wide range of emotional connotations for these concepts in the Text CAMs.
In summary, we find more shared concepts in the Text CAMs than in the Free CAMs. Only one concept, rights, appears in six out of ten Free CAMs, while the concepts protection, emotional bonding, rights, children as strong beings, stimulation, and democratic culture appear in at least seven out of ten Text CAMs.
4.2.5 Discursive concepts across scenarios
Concepts like rights, empowerment, recognition, responsibility, development, democratic culture, and limits suggest agreement about the importance of many concepts (i.e., they appear frequently in both CAM-types), but we also find variation in the level of consensus about their affective meanings. For example, recognition is always positively rated across the CAM-types, but there is far less agreement about limit.
4.2.6 Pattern of similarities
To better understand the overall pattern of similarities, we next examined how similar the participants were to each other in how they evaluated concepts affectively. We calculate the angular similarity of each participant’s valence scores to those of all other participants (see Appendix B for a description of angular similarity). The resulting similarity score theoretically ranges from 0 to 1, with 1 indicating perfect similarity and 0 complete dissimilarity. In practice, we find a max affective similarity of 0.18 and mean similarity of 0.1 in the Free CAMS, and a maximum affective similarity of 0.4 and mean similarity of 0.18 in the Text CAMs (Fig. 9).

Pairwise affective similarities of the participants' text and free CAMs networks
Figure 8 shows the pairwise affective similarities of each map type per participant. Each cell indicates the affective similarity of a pair of participants using the angular similarity measure. Darker shaded cells indicate greater similarity. The similarities of the Text CAMs are indicated by the upper diagonal, the similarities of the Free CAMs by the lower diagonal.
What we want to emphasize here is that Fig. 8 shows greater agreement between the participants when inferring the affective meanings of an author than when attributing their own emotional values to concepts elicited from a stimulus word. As expected, the participants had a common understanding of the text reflected in the affective valences they attributed to the concepts. It illustrates that the Text CAMs exhibit both higher magnitude similarities and more pervasive similarities than the Free CAMs.
4.3 Findings in detail: Common associations
We next examine the level and uniformity of associations in each CAM-type and which concepts commonly co-occur and how consistently they do so: are the maps primarily connected through a central thematic concept? Do the CAMs exhibit a community structure (dense pockets of connection joined by thematic concepts)? Or, are the concepts uniformly connected, with no one concept playing a central role?
4.3.1 Average path length
We assess the level of connectivity by examining the average path lengths (APL). APL describes a network’s connectivity in terms of the network’s shortest paths. A path is a sequence of nodes for which all the nodes and lines connecting them are distinct. Although any two nodes may be connected to each other in a variety of ways, when considering the network’s absolute level of connection, we focus on the shortest paths connecting a given node to all other nodes. Networks where there are few intermediaries between each node and all other nodes are more highly connected than networks where there are more. The number of intermediaries between nodes i and j translates into the path length between i and j. Networks that have, on average, shorter path lengths are more highly connected.
The APL in our samples oscillates between 1.9 and 3.5 (Free CAMs) and between 2.0 and 2.9 (Text CAMs). An APL of 2.0 (see Fig. 10, Participant 8) means that the average number of links on the shortest paths between concepts is around 2.

Left: average path length shows the average number of steps/associations along the shortest paths for all possible pairs of concepts. Right: Text CAM participant 8, APL = 2.0
When we consider the networks’ average path lengths and clustering coefficients, we find that the concept networks exhibit, for the most part, a community structure (pockets of more densely connected concepts spanned by a few bridging concepts). A network’s global clustering coefficient is the ratio of closed triads to all possible triads (Wasserman and Faust 1994), with closed triads being three fully connected concepts. Higher clustering coefficients indicate more uniform connection. The average clustering coefficients of the Free and Text CAMs are 0.26 and 0.21, with SDs of 0.17 and 0.15, respectively. There are no relevant differences to report.
4.3.2 Concept association similarity
Concept association similarity describes how consistently the participants associated a given concept such as participation with other concepts for both scenarios (for more details see Appendix C). Calculating the score consists of three steps:
-
1.
We isolate the list of concepts the participant associated with the concept of interest. For example, all participants associated participation with other concepts, resulting in ten edge lists (one for each participant) for the concept.
-
2.
We calculate the angular similarity of each edge list to all other lists (for more details about how we calculate angular similarity see Appendix B).
-
3.
For concepts that appear on two maps, we use their similarity score; for concepts that appear on three or more maps, we use the average similarity. Angular similarity ranges from 0 to 1, with 1 indicating perfect similarity.
It is helpful to consider concept association similarity in combination with frequency (see Figs. 10 and 11) when interpreting the former. Concepts that appear often and have high similarity indicate concepts that anchor the discourse—they are important (appear often) and they are shared (high concept association similarity). In contrast, concepts that appear often but with low similarity are also important. But these concepts have divergent meanings (because the participants associate these common concepts in divergent ways).

Concepts Association Similarity Free CAM displays how frequent concepts appear and how similar their associations are
We would expect both more focal and less divergent meanings in the Text CAMs than in the Free CAMs because the participants in this case are interpreting a common text and are able to follow a given associational structure. We might also assume the following for Free CAMs: if there is discursive meaning embedded in a (sub)culture there are concepts which—if they are actually used—also evoke similar associations and thus show a higher concept association similarity. This comparison provides insight into the level of intersubjectivity in the two scenarios at the concept level by highlighting to what extent the samples feature anchor and divergent concepts versus a swarm of low frequency/low consistency concepts.
Although all participants represent participation by default in their Free CAMs (see Fig. 10), it is associated with many other concepts in different ways—the mean concept association similarity is under 0.1. In contrast, the concepts shaping and democratic Culture are the closest analogs to anchor concepts. They appear in three out of ten CAMs and have a mean similarity of 0.45 and 0.38. The concepts empowerment and rights are likely to be divergent concepts. These concepts appear in four out of ten CAMs and are similar enough to suggest patterned differences (0.10 and 0.20, respectively), whereas the concept recognition appears often but has such a low similarity that the differences likely reflect different types of recognition rather than different group-level interpretations about the concept.
What we can describe here is that more concepts are shared within the Text CAMs as previously stated, i.e., the point cloud shifted slightly toward the upper right corner in Fig. 11 in comparison to Fig. 10.). We see enhanced intersubjectivity at the concept-level in the Text CAMs—concepts both appear more often and are more similar. Participation, for one, is more often associated with the same concepts. Although the concepts carefree childhood and clear messages have the highest similarities, they appear in only two CAMs. Rather, the discourse appears to feature no unifying set of concepts, but a set of divergent centers as suggested by APL and clustering coefficients of the Text CAMs. The concepts rights, children as strong beings, children as weak beings, and children appear frequently (more than five times) at roughly a similarity of 0.3, suggesting divergent group-level interpretations. Whereas the similarities of concepts, such as empowerment and emotional bonding, suggest either different types of empowerment or emotional bonding rather than different interpretations centered around these concepts. However, the concepts empowerment and emotional bonding are central components of the construct participation despite the variety of ways in which they are connected (underscoring the importance of considering both frequency and similarity when teasing out what role a concept plays in the discourse).
4.4 Distances and themes: analyzing the structure of similarities
We next extend the analyses of concept frequency and consistency by examining whether the participants grouped into clear sub-groups organized around focal concepts. Do we in fact see that the participants grouped around concepts such as children as weak beings versus children as strong beings? This section presents findings from an analysis of the similarity networks (see Figs. 12 and 13) constructed from the angular similarities of the participants’ CAMs (Appendix B for a more detailed discussion). Nodes in these networks (see the center of the illustration in Figs. 12 and 13) represent participants, while the edges represent how similar the connected participants are to each other in terms of their CAMs. Participants who are more similar to each other are closer together in the network. Participants who are more densely connected to each other than to the rest of network are likely to be tied by a common conceptualization of the concepts and their associations.

Concepts association similarity text CAM displays how frequently concepts appear and how similar their associations are

Free CAM communities I-III. CAM of each participant; clustering: node-size: betweenness centrality: high (bigger nodes), low (smaller nodes)
4.4.1 Communities of participants based on network similarity scores: Free-CAMs
To identify themes, we clustered the Free and Text similarity networks using the Louvain community detection algorithm (Blondel et al. 2008). We visualized the network using GephiFootnote 6 (Bastian et al. 2009). People in the same communities tended to share similar concepts and to associate the same concepts.
We find three communities in the Free CAMs similarity network that differ from each other in their concepts and associations (Fig. 13).
The concept Participation has a subordinate role in this analysis because this concept does not differentiate the communities from each other. Further, we find that even if the associations between the concepts are not directly identical within a community, they are linked to one another via indirect association chains:
-
Community I: Participants 8 and 10 share the concepts rights and interaction.
-
Community II: Participants 1, 2, 3, and 7 share the concepts rights, empowerment, efforts, equality of perspectives, children’s rights, and democratic culture.
-
Community III: Participants 4, 5, 6, and 9 share the concepts self-efficacy, development, efforts, frictions, responsibility, shaping, change, fit, and hype.
This indicates that, for example, community II focuses more on ‘formal legitimation’, ‘conditions’ and ‘benefits’, while community III focuses more on ‘obstacles’, ‘benefits’ and a personal ‘evaluation’ (cf. Section 4.2.1.: core categories). There are different groups among the participants, i.e., they share the same content and focus, and thus serve different discursive strands within the overall discourse on participation.
4.4.2 Communities of participants based on network similarity scores: Text CAMs
Similarly, we find three communities in the Text CAMs similarity network (Fig. 14).

Text CAM communities A-C. CAM of each participant; center: Clustering: node-size: betweenness centrality: high (bigger nodes), low (smaller nodes)
The concepts and associations that distinguish the communities from each other are:
-
Community A: Participants 5 and 7 share the concepts excessive demands, power to decide, children as strong beings, protection, emotional bonding, and carefree childhood. They share the associations between power to decide, participation, and excessive demands as well as between demand of performance, carefree childhood, and children as strong beings.
-
Community B: Participants 1, 2, 4, and 6 share the concepts rights, adults, children, protection, demand of performance, emotional bonding, democratic culture, children as weak beings, skills, responsibility, and empowerment. They share for instance relations between skills, children, adults, stimulation, protection, empowerment, children as weak beings and demand of performance.
-
Community C: Participants 3, 8, 9, and 10 share the concepts dialogue, limits, negotiations, conditions, recognition, protection, sharing knowledge, rights, children as strong beings, willingness to participate, building confidence, emotional bonding, free from fear, and satisfaction of needs. They share subnetworks and associations between participation, protection, rights, emotional bonding, and children as strong beings and between stimulation, sharing knowledge, willingness to participate, recognition, and dialogue.
What can be emphasized here is that the communities partly use the same concepts in their networks. Special discursive strands are revealed only through certain associations. In contrast to the Free CAMs, the differences in the Text CAMs are not particularly strong or sharply separated from each other, in the sense that certain core categories appear prominent. This means that the Text CAMs are more similar to one another and thus exhibit stronger intersubjectivity.
4.5 Regression analyses: network similarity as a function of affective similarity
Finally, we analyze the association between affective similarity and network similarity. We calculate the affective similarity and network similarity for each pair of participants for each network type (see Appendices B and D for more details). We then regress pairwise network similarity on the pairwise affective similarity in separate models for each map type (summarized in Table 5).
We find moderate association between affective similarity and network similarity in the Text CAMs, and a strong association in the Free CAMs. We find that the mean network similarity of the Text and Free CAMs shifts by approximately 0.1 and 0.2, respectively, for a one unit increase in affective similarity. We also find that the affective similarity explains only 4% of the variance in the Text CAMs, but 18% of the variance in the Free CAMs.
Finally, we examine the fit between the data and predicted values generated from the Free CAMs regression (Fig. 15).

Pairwise relational similarity as a function of pairwise affective similarity (Free CAMs)
The blue line and larger grey points indicate the predicted values, while the grey bars and yellow band indicate the confidence interval. We see a clear association between the relational and affective similarity. The affective similarity seems to make the CAMs more similar if the participants, for other reasons, make similar associations. The fact that many participants who share no associations, nevertheless shared some affective meanings (points at zero along the y-axis but greater than 0.05 on the x-axis), suggests that affective similarity likely mediates other forms of similarity. For example, if two participants both believe that participation is the best way to guarantee rights of the child, the fact that they share many affective meanings is likely to contribute to them making other associations. But other forms of similarity must be present, as affective similarity alone is not sufficient to guarantee relational similarity. In general, these results provide concrete evidence that affective similarity and by extension coherence influences the generation of CAMs, and that this influence is most likely stronger when the CAM is being elicited freely and directly.
5 Summary
We now briefly summarize the main results:
-
Free and Text CAMs differ from each other on all three dimensions of similarity. Text CAMs are characterized by higher network, concept association, and affective similarity (Sect. 4.1.).
-
All concepts in both scenarios can be assigned to one of nine core categories (Sect. 4.2.1.).
-
The number of mapped concepts varies between CAM-types per participant, but also between participants in general. The number of concepts fluctuates more within Free CAMs (Sect. 4.2.2.).
-
The number of concepts in both scenarios is limited and cannot be arbitrarily extended (Sect. 4.2.3.).
-
There are discursive concepts and discursive emotional attribution in both scenarios. For some concepts, however, no emotional consensus can be found across the scenarios (Sect. 4.2.4.).
-
There is greater agreement between the participants when inferring the emotional values of an author then when attributing their own emotional values (Sect. 4.2.5.).
-
The average path length (APL) shows no relevant differences. There is a consistent way to map. Because the APL is relatively low, it can be emphasized here that how the concepts are connected is not random. Moreover, there is a slightly higher clustering coefficient for Free CAMs, meaning that there is lower variation in clustering in Text CAMs because the participants more uniformly recall a common structure (Sect. 4.3.1).
-
The participants share more concepts and associate them in more intersubjective ways in their Text CAMs compared to their Free CAMs (Sect. 4.3.2.).
-
For both Free and Text CAMs, groups can be formed which differ from each other by certain concepts and certain associations between the concepts. The differences between the groups are more obvious for the Free CAMs. This indicates that the Text CAMs are more similar to each other in general (Sect. 4.4.1. and 4.4.2).
-
Last but not least, there is a stronger association between affective similarity and network similarity in Free CAMs. Moreover, the affective similarity likely mediates other forms of similarity (Sect. 4.5.).
6 Discussion
Our ambition was to explore a way to use qualitative and quantitative strategies to compare CAMs in order to detect how intersubjective they are. Our study thus adds the previously missing empirical evidence showing to what extent different persons or researchers are able to create intersubjective CAMs when mapping the same text material. Even though our sample size is limited, we have obtained interesting results and we believe this analysis can serve as a useful starting point for future work.
What we have been able to demonstrate is that CAMs based on a given text about participation are more intersubjective than freely associated CAMs on the same topic. First of all, it should be noted that it is possible to create intersubjectively "credible" CAMs with the help of a manual as provided in Appendix A1. Moreover, it seems to be possible to put aside one's own emotional associations when it comes to reflecting on someone else’s perspective, in this case that of the author of the given text.
The fact that almost all core categories can be found in every CAM (both Free and Text CAMs) indicates that discursive knowledge concerning the topic participation circulates between at least the participants of our sample and the author. Without direct interactive contact during mapping, the participants refer back to the same core categories and partly inherent concepts including the same attributed emotional values, and thus, establish and perpetuate a common sense of participation. Since the empirical dataset is small and only members of a specific cohort participated, we recommend conducting similar studies in the future with larger CAM samples made up of a more diverse group of people. This would also allow for more general statements to be made about discursively shared concepts on a certain topic.
Our data has also identified concepts that reveal discrepancies in emotional values. Varying emotional values should not be taken to mean that participants take contrary perspectives, because the method leaves room for interpretation. We focused on already completed CAMs that we did not discuss with the participants during or after the mapping processes. Nevertheless, if we take the concept protection as an example, it is clear that protection, when granted, is something emotionally positive and if it is missing or required because a person or child is at risk, is emotionally negative. It is possible that the participants actually mean the same on a cognitive level, but (obviously) attribute and perhaps associate these concepts in different ways. These differences between all the similarities could simply represent different strands of discourse, and in combination form represent the prevailing discourse on participation with affectively divergent and sometimes contradictory facets.
The stronger association between affective similarity and network similarity in the Free CAMs (Sect. 4.5.) is initially surprising. Given that the Text CAMs are more similar on every dimension, we expected a stronger association between network similarity and affective similarity. When taking into consideration the tasks that generated the CAMs, though, this finding seems more intuitive. When drawing a Free CAM, the participants began with a stimulus word, participation, and associated it freely with other concepts they recalled. Remembered affective associations likely directly influenced the creation of the network, and thus the stronger relationship between affective similarity and network similarity in the Free CAMs. Alternatively, when the participants mapped the text, they recalled its structure by inferring the author’s valences and associations. Affective associations in the text are less tightly coupled in this case because the author either associated the two concepts or not. The valences of the concepts most likely influenced the associations in the author’s mind, but the participants are making associations based on what they recalled from the text, not whether they themselves view the concepts as affectively associated. Consequently, the participants are reconstructing affective associations from the text the author likely had, but the influence of affective meanings on the tie generation process in this case is one step removed and thus weaker.
In general, we assess our methodological approach using three similarity measures combined with social network analysis and qualitative text analysis as promising. It can help in identifying competing perspectives between groups as well as in identifying important commonalities. There were many methodological challenges to our approach. One of them is certainly the analysis of associations: the concepts were not fixed in advance (in order to enable our participants to think and associate freely at all). For a controlled investigation of similar associations, it would be necessary (and interesting) to investigate what happens when concepts are given. The participants would "only" need to attribute values and connect these content-fixed concepts. For further statistical analyses, larger samples could be helpful, especially with regard to the detection of communities or different strands within discourses. Our study is to be understood as a first step in developing and applying a new methodology, and thus there are numerous possibilities to extend what we have done here in fruitful ways. For example, a logical next step would be to sample participants more heterogeneously or e.g. let different actors within a discourse/field create CAMs.
For scientific practice, our results imply that it is possible to represent the perspectives of individuals, groups, or, e.g., political authors/actors intersubjectively and to produce credible results using the methodology of cognitive-affective mapping. However, it would be imprudent to say that an individual researcher does not need to validate their CAM. Rather, they should be used as an opportunity to take a closer look. After all, our findings also show that, in detail, conflicting emotional valences of the same concepts, for example, initially indicate different perspectives with regard to a particular topic. On closer examination, however, they may be synonymous on a cognitive level. The advantage of CAMs is that they make it quite easy to identify similarities, but also differences, and to discuss them.
Notes
In our approach intersubjectivity expresses the fact that a complex issue is equally recognizable and comprehensible by several viewers; there is agreement on how to perceive something, how to classify it, or what it means.
EQUIP (2016–2019) was founded by the Federal Ministry for Family Affairs, Senior Citizens, Women and Youth, Germany.
To familiarize the participants with the method, only neutral, positive, and negative elements were initially introduced (see Thagard 2010). The manual for mapping a given text refers to the extended conventions (see Homer-Dixon et al. 2014). For this reason, no ambivalent concepts can be reported in Free CAMs, but they can in Text CAMs. This methodological limitation must be avoided in future studies.
The list of all labels was translated into English using a common dictionary and translation software (https://www.deepl.com). The translation was double-checked by a native speaker. Subsequently, the original CAMs were translated into English by replacing the original written concept with the label.
In 4 out of 20 CAMs the participants included and rated a concept more than once. For each concept for each participant, we calculate the concept’s frequency and its mean valence. We then weight the mean using the log of the frequency and apply a constant depending on whether the initial valence is positive or negative. We assume that rating a concept more than once conveys meaningful contextual information. For example, if a participant rated the concept Participation twice—once as negative ( − 1) and once as neutral (0)—we infer that the participant distinguished between different forms of participation, some neutral and some negative.
We drop any ties between a concept and itself when constructing the participants’ edgelists because it is unclear what a such a tie would mean in this context.
If we were comparing signed, weighted, or signed and weighted networks, the values indicating a tie would vary accordingly (negative and positive 1 s, integers greater than 1, and positive and negative integers other than 0). We treated CAMs as simple undirected networks, but this approach is applicable to each of these cases.
Namely, the absolute value of the inner product between x and y is greater than or equal to zero, and less than or equal to the product of the lengths of x and y: cosine(x,z) $$\le $$ cosine(x,y) + cosine(y,z).
In the event, a researcher wants to compare CAMs where common knowledge cannot be assumed and the ties are unsigned, we suggest using Berlingerio et al.’s (2012) NetSimile technique or Zöller et al.‘s (2020) extension. NetSimile measures similarity with respect to a set of structural features rather than measuring similarity directly, but would reliably measure relative similarities.
There are eighty-three concepts that appear in only one Free CAM, and fifteen that appear in only Text CAM.
References
Ambrasat, J., von Scheve, C., Conrad, M., Schauenburg, G., Schröder, T.: Consensus and stratification in the affective meaning of human sociality. Proc. Natl. Acad. Sci. U.S.A. 111(22), 8001–8006 (2014)
Axelrod, R.: Structure of decision The cognitive maps of political elites. Princeton University Press, Princeton (1976)
Barrett, L.F., Russel, J.A. (eds.): The psychological construction of emotion. Guilford, New York (2014)
Bastian, M., Heymann, S., Jacomy, M.: Gephi: an open source software for exploring and manipulating networks. https://gephi.org/publications/gephi-bastian-feb09.pdf (2009). Accessed 30 July 2019
Berger, P.L., Luckmann, T.: Die gesellschaftliche Konstruktion der Wirklichkeit. Eine Theorie der Wissenssoziologie. Fischer, Frankfurt am Main (1980)
Berlingerio, M., Koutra, D., Eliassi-Rad, T. & Falousos, C. (2012). NetSimile: a scalable approach to size-independent network similarity. [cs.SI]
Blondel, V.D., Guillaume, J.-L., Lambiotte, R., Lefbvre, E.: Fast unfolding of communitiers in large networks. J. Stat. Mech.: Theory Exp. (2008). https://doi.org/10.1088/1742-5468/2008/10/P10008
Bormann, I., Luthardt, J., Schröder, T.: Zur diskursiven Herstellung von Innovation. Überlegungen zur Kombination von Kognitions- und Diskursforschung. [Discursive production of innovation]. Reflect. Comb. Cogn. Discourse Res. Zeitschrift für Diskursforschung 5(1), 160–182 (2018)
Chernick, M.R., LaBudde, R.A.: An Introduction to the Bootstrap with Applications to R. Wiley, Hoboken, NJ (2011)
Conover, W.J.: Practical nonparametric Statistics, 3rd edn. Wiley, Hoboken, NJ (1999)
Cossette, P., Audet, M.: Mapping of an idiosyncratic schema. J. Manag. Stud. 29(3), 325–347 (1992)
Davison, A.C., Hinkley, D.V.: Bootstrap Methods and their Application. Cambridge University Press, Cambridge, UK (1997)
De Deyne, S., Storms, G.: Word associations: network and semantic properties. Behav. Res. Methods 40(1), 213–231 (2008)
de Solla Price, D.: Networks of scientific papers. Science 149(3683), 510–515 (1965)
de Solla Price, D.: A general theory of bibliometric and other cumulative advantage processes. J. Am. Soc. Inf. Sci. Tec. 27(5), 292–306 (1976)
de Nooy, W., Mrvar, A., Batagelj, V.: Exploratory Social Network Analysis with Pajek: Revised and Expanded Edition for Updated Software, 3rd edn. Cambridge University Press, Cambridge, UK (2018)
Denzin, N.K.: The Research Act, 2nd edn. Aldine, Chicago (1978)
Denzin, N.K.: The Research Act, 3rd edn. Prentice Hall, Englewood Cliffs, NJ (1989)
Doyle, J.K., Ford, D.N.: Mental models concepts for system dynamics research. Syst. Dyn. Rev. 14(1), 3–29 (1998)
Efron, B., Robert, J.: Tibshirani: bootstrap methods for standard errors, confidence intervals, and other measures of statistical accuracy. Stat. Sci. 1(1), 54–75 (1986)
Findlay, S.D., Thagard, P.: Emotional Change in international negotiation: analyzing the camp david accords using cognitive-affective maps. Group Decis. Negot. (2014). https://doi.org/10.1007/s10726-011-9242-x
Flick, U.: Qualitative Sozialforschung. Eine Einführung (7th ed.). Rowolth, Reinbek bei Hamburg (2016)
Glaser, B. G., Strauss, A. L.: Grounded Theory. Strategien Qualitativer Forschung. (3rd ed.). Hans Huber, Bern (2010)
Hackert, N.A., Filliben, J.J.: In NIST Handbook 148: DATAPLOT Reference Manual: LET Subcommands and Library Functions, vol. 2. NIST, Washington, D.C. (2018)
Haidt, J.: The emotional dog and its rational tail: a social intuitionist approach to moral judgment. Psychol. Rev. 108(4), 814–834 (2001)
Heise, D.R.: Expressive order. Confirming sentiments in social action. Springer, Heidelberg (2007)
Hills, T., Maouene, J., Riordan, B., & Smith, L. B. (2009). Contextual diversity and the associative structure of adult language in early word learning. Paper presented at the Proceedings of the Annual Meeting of the Cognitive Science Society.
Homer-Dixon, T., Leader Maynard, J., Mildenberger, M., Milkoreit, M., Mock, S., Quilley, S., Schröder, T., Thagard, P.: A complex systems approach to the study of ideology: cognitive-affective structures and the dynamics of belief change. J. Pers. Soc. Psychol. 1(1), 337–363 (2013)
Homer-Dixon, T., Milkoreit, M., Mock, S., Schröder, T., Thagard, P.: The conceptual structure of social disputes: Cognitive-affective maps as a tool for conflict analysis and resolution, SAGE Open. http://sgo.sagepub.com/content/4/1/2158244014526210 (2014). 12 January 2018
Hunter, D.R., Handcock, M.S., Butts, C.T., Goodreau, S.M., Morris, M.: Ergm: a package to fit simulate and diagnose exponential-family models for networks. J. Stat. Softw. (2008). https://doi.org/10.18637/jss.v024.i03
Kajić, I., Schröder, T., Stewart, T.C., Thagard, P.: The semantic pointer theory of emotion: integrating physiology, appraisal, and construction. Cogn. Syst. Res. 58, 35–53 (2019)
Kitchin, R.M.: Cognitive maps: What are they and why study them? J. Environ. Psychol. (1994). https://doi.org/10.1016/S0272-4944(05)80194-X
Luthardt, J., Schröder, T., Hildebrandt, F., Bormann, I.: „And then we’ll check if it suits us” – cognitive-affective maps of social innovation in early childhood education. Front. Educ. (2020). https://doi.org/10.3389/feduc.2020.00033
Mercer, J.: Emotional Beliefs. Int. Organ. (2010). https://doi.org/10.1017/S0020818309990221
Milkoreit, M.: What’s the mind got to do with it? A Cognitive Approach to Global Climate Governance. SEI, Working Paper 2012–04 (2012)
Milkoreit, M.: Mindmade Politics – The Role of Cognition in Global Climate Change Governance. UW Space. http://hdl.handle.net/10012/7711 (2013). Accessed 27 March 2017
Mucha, P.J., Richardson, T., Macon, K., Porter, M.A., Onnela, J.P.: Community structure in time-dependent, multiscale, and multiplex networks. Science 328(5980), 876–878 (2010)
Özesmi, U., Özesmi, S.L.: Ecological models based on people’s knowledge: a multi-step fuzzy cognitive mapping approach. Ecol. Model. (2004). https://doi.org/10.1016/j.ecolmodel.2003.10.027
Przyborski, A., Wohlrab-Sahr, M.: Qualitative Sozialforschung. Ein Arbeitsbuch. Oldenbourg, Munich (2014)
Robins, G., Snijders, T., Wang, P., Handcock, M., Pattison, P.: Recent developments in exponential random graph (p*) models for social networks. Soc. Netw. 29(2), 192–215 (2007)
Steyvers, M., Tenenbaum, J.B.: The large-scale structure of semantic networks: statistical analyses and a model of semantic growth. Cogn. Sci. 29(1), 41–78 (2005)
Straßburger, G., Rieger, J.: Bedeutungen und Formen der Partizipation – Das Modell der Partizipationspyramide. In: Straßburger, G., Rieger, J. (eds.) Partizipation kompakt. Für Studium, Lehre und Praxis sozialer Berufe (2nd Ed.), pp. 12–41. Beltz Juventa, Weinheim Basel (2019)
Strauss, A., Corbin, J.: Grounded theory: grundlagen qualitativer sozialforschung. Beltz, Weinheim Basel (1996)
Thagard, P.: Hot thought: mechanisms and applications of emotional cognition. MIT University Press, Cambridge, MA (2006)
Thagard, P.: Value maps in applied ethics. Teach. Ethics (2014). https://doi.org/10.5840/tej20149221
Thagard, P., Verbeurgt, K.: Coherence as constraint satisfaction. Cogn. Sci. (1998). https://doi.org/10.1207/s15516709cog2201_1
Thagard, P.: EMPATHICA: A computer support system with visual representations for cognitive-affective mapping. In: McGregor, K. (ed.) Proceedings of the workshop on visual reasoning and representation, pp. 79–81. AAAI Press, Menlo Park, CA (2010)
Tracy, S.J.: Qualitative quality: eighth “Big-Tent” criteria for excellent qualitative research. Qual. Inq. (2010). https://doi.org/10.1177/1077800410383121
Urban, U.: Demokratiebaustein: Partizipation. BLK, Berlin (2005)
van der Waerden, B.L.: Order tests for the two-sample problem and their power. Indag. Math. 14, 453–458 (1952)
Vitevitch, M.S.: What can graph theory tell us about word learning and lexical retrieval? J. Speech Lang Hear Res. 51(2), 408–422 (2008). https://doi.org/10.1044/1092-4388(2008/030)
von Scheve, C.: Emotionen und soziale Strukturen: die affektiven Grundlagen sozialer Ordnung. Campus Verlag, Frankfurt (2009)
Wasserman, S., Faust, K.: Social network analysis: methods and applications. Cambridge University Press, Cambridge (1994)
Watts, D.J., Strogatz, S.H.: Collective Dynamics of » Small- World « Networks. Nature 393, pp. 440 – 442 (1998)
Wolfe, S.E.: Water cognition and cognitive affective mapping: identifying priority clusters within a Canadian water efficiency community. Water Resour. Manag. (2012). https://doi.org/10.1007/s11269-012-0061-x
Zöller, N., Morgan, J. H., Schröder, T.: . A topology of groups: What GitHub can tell us about online collaboration. Technol. Forecast. Soc. Change. 161, 120291 (2020). https://doi.org/10.1016/j.techfore.2020.120291
Funding
Open Access funding enabled and organized by Projekt DEAL.
Author information
Authors and Affiliations
Corresponding author
Additional information
Publisher's Note
Springer Nature remains neutral with regard to jurisdictional claims in published maps and institutional affiliations.
Appendix
Appendix
1.1 (A): Manual and data preparation
1.1.1 (A1): Manual
A CAM (Cognitive-affective Map) represents an attitude/conviction system as a network of mental representations. A CAM consists of concepts (shapes) and relations (lines) (Fig.

Elements of a CAM
16):
-
Ovals stand for emotionally positive (pleasant) concepts (green)
-
Hexagons stand for emotionally negative (unpleasant) concepts (red)
-
Rectangles represent concepts that are emotionally neutral (yellow)
-
A superimposed oval and hexagon indicates ambivalence—a concept that can create positive and negative emotions simultaneously or alternately (purple)
The thickness of the shape’s border represents the relative strength of the positive or negative value assigned to the concept. When a color is present, ovals are green, hexagons are red, rectangles are yellow, and superimposed ovals/hexagons are purple. Solid lines represent mutually supporting associations—the emotion towards both concepts feels similar. Dashed lines represent opposing associations between the concepts; the emotion towards both concepts feels different. The thickness of the line indicates the strength of the emotional relationship.
Procedure for text analysis
-
Step 1: Read the text
-
Step 2: Mark sense units in the text
-
o
What is the central idea, the central theme in this section?
-
p
Which concepts are presented here?
-
o
-
Step 3: Code each sensory unit and compare/contrast (keywords)
-
o
In which sections, do similar concepts occur?
-
p
Are there links to other concepts?
-
q
Which emotions can be assigned to the concepts?
-
o
-
Step 4: Get an overview of all codes
-
o
Sort, categorize and summarize all codes
-
p
Determine the emotional values
-
o
-
Step 5: Draw a CAM
-
o
Prioritisation: select a maximum of 15 concepts (which appear to be the most important, relevant and reflect the text)
-
p
Checking whether the concepts are on the same level or have the same level of detail (reduction/abstraction/summary)
-
o
The CAM, all concepts and their values, must reflect the text. So, the content of the text-based CAM are not your personal thoughts and feelings, but are taken from the text and interpreted by you.
Example: Table summary/abstraction levels of detail; (Fig.

Arrangement
17).
1.1.2 (A2): Data preparation
See Tables
6,
7,
8,
1.2 (B): Calculating network similarity
When comparing networks, we start by constructing a comprehensive edgelist because we can then use this list to construct a string of values that allows us easily and efficiently compare one network to another.Footnote 7 To differentiate this type of edgelist from a typical edgelist, we refer to it as a canonical edgelist. The edgelist is canonical in the sense that each row specifies a unique pair of concepts that can theoretically occur in each of the compared networks, where the order of the rows is consistent across all participants’ edgelists. For example, when comparing cognitive affective maps generated from the BLIND text, row one of each participant’s edgelist always indicates a possible connection between the concepts: participation and protection. Whereas, row two always indicates a possible connection between the concepts: participation and emotional bonding. To construct each participants’ canonical edgelist, we enumerate all possible unique pairs between all observed concepts across all the participants, and then populate the tie column of the participant’s edgelist with a 1 if the participant linked the two concepts or a 0 otherwise.Footnote 8
In a canonical edgelist, the third column, the tie column, represents a unique string or vector of values that summarizes all the information contained in the network. Given knowledge of the dyad pairs associated with each row of the edgelist or each position in the vector, a researcher can reconstruct the network represented by the string in its entirety. If vector positions are consistent for all networks being compared, we can calculate the similarity of each CAM to all other CAMs as the similarity between their tie values.
Once transformed into a feature vector, we can calculate the similarity between two CAMs as the angular similarity between the two vectors. Angular similarity is one of a family of methods for measuring association that includes cosine similarity, Pearson correlations, and OLS coefficients. These methods measure the association between two variables by calculating their inner product. If x tends to be greater where y is greater and lower where y is lower, the inner product will be high, indicating similarity and a positive association.
The methods differ in how they normalize the inner product. Cosine similarity normalizes the inner product with respect to the Euclidean distances of the two vectors, with the distances derived from the square root of the inner product of the vector and itself, A and B in Eq. 1. Cosine similarity is, thus, interpreted as the cosine of the angle between the two vectors. When x and y are non-negative numbers, the cosine similarity is bounded between 0 and 1, with 1 indicating perfect similarity.
Our job, however, does not end here. For our purposes, cosine similarity has two major drawbacks. First, it is not a formal distance metric because it violates the triangle inequality,Footnote 9 making it unsuitable for assessing the relative similarities of participants with reference to a common dimensional space. Second, cosine similarity is prone to over-estimate the similarity of vectors as they become more similar and the angle between them becomes less because when the angle is small the cosine of the angle is very close to one, resulting in a loss of precision. For many text analysis applications where cosine similarity is commonly used, these drawbacks are not critical because researchers are primarily interested in the relative ordering of the similarities (x is more similar to y then to z for example).
Nevertheless, it is important to have a more precise measure in our case for two reasons. First, as we will discuss shortly, ratings of the concepts’ affective valences are likely to be similar and thus susceptible to this lack of precision. Second, small differences between the participants ‘CAMs are likely to be important, and thus a method capable of discriminating finer differences is desirable. For even a small to medium-sized network, the number of features (dyad positions) being compared is large. For example, the networks generated from the BLIND text consist of 42 nodes and thus 861dyad positions, in other words 861 ways for the participants to differ from one another. Consequently, we need a measure that can capture small differences.
To calculate the angular similarity between two CAMs, we recover the angular distance by normalizing the cosine similarity in Eq. 2 (Hackert & Filliben, 2018).
We can then compute the angular similarity for each pair of CAMs by simply subtracting angular distance from 1, as shown in Eq. 3.
Note, this approach assumes that all the participants theoretically had the opportunity to associate all concept pairs. In our other words, we assume all the participants knew, for example, how the concepts participation and protection are used in the education discourse, and could have associated them even if these concepts do not appear in the CAM they themselves constructed. If the CAMs are generated from a common text, this assumption is unproblematic. The assumption of common knowledge, however, becomes an important scope condition when comparing CAMs generated by participants from memory.Footnote 10 For the purposes of our case study, we believe our participants memory-based CAMs meet this criterium because all the students and faculty belonged to the same academic unit, reacted to the same stimulus word, and used words common to that knowledge community to construct their maps. Nevertheless, this assumption has important implications for studying groups where we cannot necessarily assume a consensus understanding of the concepts’ meanings.
1.3 (C): Calculating association similarity: similarity at the concept level
We measure a concept’s association similarity by applying a very similar procedure to the one described in Appendix B; except instead of calculating the angular similarity of each participant to all other participants with respect to their entire network, we calculate the angular similarity of each concept to all other concepts across the ten participants. We do this by taking the word networks of each concept for each participant (again assuming that each concept could have been connected to all other concepts) and comparing it to the word networks of the other participants for that concept. For example, we compare participant one’s word network for the concept participation (the concepts participant one tied to participation) to participant two’s word network for participation (the concepts participant two tied to participation). For those concepts that appear in more than one map, we calculate the mean similarity of the concept to generate a final concept association score.Footnote 11
1.4 (D): Calculating affective similarity
To compare the affective similarities of the participants’ concept ratings, we first construct a concept-level affective valence score based on the valences reported by the participant and the concept’s frequency in the CAM. Participants could rate a concept as negative, neutral, positive, or ambivalent: − 1, 0, 1, and − 1, 1 respectively. Participants could also rate a concept more than once. For each concept for each participant, we calculated the concept’s frequency and its mean valence. We then weight the mean using the log of the frequency and apply a constant depending on whether the initial valence was positive or negative. We assume that rating a concept more than once conveys meaningful contextual information. For example, if a participant rated the concept participation twice, once as negative ( − 1) and once as neutral (0). We infer that the participant distinguished between different forms of participation, some being neutral and some being negative.
To retain this kind of contextual information, we would multiply the frequency (log(2 + 1)) by the mean (0.5) and add a constant to retain the valence in the final score ( − 1 if the initial valence was negative and 1 if the valence was positive or zero). The resulting score in this case is − 1.55. We treat the mean of ambivalent concepts as 0 resulting in an affective score of 1. Unrated concepts receive a score of 0. After calculating each participant’s concept valences, we calculate the angular similarity of each participant’s valence scores to those of all other participants. Given the relatively coarse measure and the topical focus of the study, we find that the participants are more similar in terms of their affective meanings than in terms of their network similarity. Nevertheless, we find that the variety of concepts combined with differences in their valence result in enough variation to create a range of similarity scores. Finally, we regress pairwise network similarity on the pairwise affective similarity to test whether there is a clear association between the two.
1.5 (E): Random network analysis: features comparison
There are several alternatives when generating random graphs, but they fall into two major categories parametric and network growth models. We ultimately used a network growth model as our null model rather than a parametric model because it was unclear whether the maps come from the same probability distribution. Parametric models assume that the observed network is a realization of an underlying probability distribution of random graphs (Hunter et al. 2008). The researcher specifies a model based on features such as homophily, mutuality, transitive closure, as well as higher-order features. New networks can then be simulated from the underlying probability distribution implied by the fitted model to test hypotheses. We, however, did not begin with one network but ten of each type, with substantial intra-group variation in the networks’ structural indices. Although we considered selecting a representative graph for each map type and developing models based on these graphs, we chose not pursue this strategy because it was unclear after comparing the maps with respect to a variety of measures which were the most representative. In contrast, growth models provided a straightforward alternative for generating a variety of graphs based on a plausible and reproducible set of mechanisms.
There are a variety of network growth models. After considering Bernoulli, small-world, and preferential attachment models, we chose a preferential attachment as our null model for several reasons. First, preferential attachment models replicate many of the features of associative memory and learning (Hills et al. 2009; Steyvers et al. 2005). Humans tend to recall concepts that are associated with other highly connected concepts in memory. Second, past work has found that highly central nodes tend to be frequent and appear early in word association tasks ruling out using a Bernoulli model (De Deyne and Storms 2008; Vitevitch 2008). Highly central nodes, however, appear in both small-world and preferential attachment models, with the difference between these two processes being the relative proportion of highly connected nodes to other nodes. We, thus, compared networks generated using a small-world model (Watts-Strogatz 1998) with those generated using the de Solla Price preferential attachment model. We ultimately chose the de Solla Price model both because it generated networks that more closely resembled our empirical networks and because the growth of the model paralleled in many ways the tasks the participants performed when drawing their maps.
The participants drew their maps based on either one stimulus word or a set of words they recalled from the text in the case of the Free CAMs and Text CAMs respectively. The stimulus word is the most connected concept in the vast majority of the maps. The Free CAMs networks tend to feature one or two highly connected nodes; the Text CAMs exhibit a bit more variation. Participants tended to branch out from the stimulus word in chains and small clusters in a manner similar to that of a preferential attachment model.
We generated the graphs of our null model by adding new vertices and lines to a seed set of nodes during each repetition of the model. The seed set is analogous to the stimulus words in the two mapping tasks. In the model, the probability of receiving an arc is proportional to the indegree of the nodes (highly connected nodes will tend to receive more connections in the future than less connected ones). The model, however, also establishes a baseline probability of connection to account for the fact that a new node (nodes with a degree of 0) would never receive ties if connection depended exclusively on in-degree.
The ratio of the baseline probability to the degree-based probability determines the strength of the preferential attachment mechanism in the model. If the baseline probability is less than network’s average degree, preferential attachment has a stronger effect than the baseline probability on the random process, if equal both mechanisms have an equal influence, and if greater the baseline probability has the stronger effect. We found that having the baseline probability and degree-based probability have an equal effect on the model generated graphs that best fit the maps.
For undirected graphs like our maps, the degree-based probability is constrained between 0 and 0.5 because the edges are, for the purposes of the model, treated as bi-directed arcs, meaning that the weighting of in-degree and out-degree is treated as equivalent. A degree-based probability of 0.5 in an undirected network, thus, is equivalent to assuming that the random process is driven entirely by preferential attachment because the combined probability of in-degree and out-degree sums to 1. We set the degree-based probability to 0.25 for both map types, making the overall degree-based effect on the model 0.5 (see de Nooy, Mrvar, and Bateglj (2018, pp. 370–372) for more details).
We evaluate each model’s fit with respect to nine commonly used network measures. Figure 14 compares the Free and Text CAMs to 1,000 randomly generated graphs. The Fig.’s rows correspond to three system level measures (size, the largest component proportion, and diameter), three path-based measures (degree centralization, average geodesic distance, and betweenness centralization), and three measures of local structure (global clustering coefficient, empty triad count, and complete triad count). Each cell corresponds to a measure: observations associated with the Text CAMs and Free CAMs are on the left and right respectively, grey coloration indicates simulated values blue empirical ones. We use dot plots to visualize the mean and confidence interval of each measure. If the measure has a few modal values, we represent the measure using a bar plot; if more, we visualize the measure’s distribution using a swarm plot with the mean and confidence interval underneath the swarm plot (Fig.

Comparisons of empirical and random network for text and free CAMs
18).
The simulated models replicated the majority of the features of both map types. The models replicated more of the features of the Text CAMs (eight of the nine features) than of the Free CAMs (five of the nine). An overlapping confidence interval and distributions that mirror each other indicate good fit in the Fig. 15. The model struggled to replicate the size of the networks for both graph types, although the confidence intervals of the simulated and Text CAMs do overlap. The model tended to overestimate the number of nodes beyond the seed set connected to central concepts. The only significant difference between the simulated networks and the Text CAMs, the proportion of the network in the largest component, results from one map having two components, where the model predicts a fully connected graph. It is difficult to evaluate the implications of this difference because at our sample size one idiosyncratic feature of one graph makes a significant difference. Nevertheless, the model across a variety of dimensions generated comparable graphs.
Fitting the Free CAMs was more difficult because the networks varied considerably with respect to the measures. Overall, the differences between the model and the Free CAMs arise from the fact that the model expects a greater level of overall connection (smaller diameter) but a lower level of local connection (more empty triads and lower betweenness centralization) than we observed. The denser local structure is not entirely surprising given past work on word association networks (De Deyne and Storms 2008). Nevertheless, the variation between moderately connected and sparsely connected graphs in our sample suggests that the model would benefit from additional correlates such as expertise that would help account for this variation. Despite these caveats, the model was able to reproduce important structural indicators at both the system and local level, and thus achieves its aim of providing a reference point with which to evaluate differences.
1.6 (F): Random network analysis: pairwise similarities
Having established that the simulated networks are structurally similar to the maps, we next compared the pairwise similarities of the empirical and simulated networks for each map type (45 and 499,500 pairs respectively). The left panel of Fig. 19? displays the distribution and cumulative distribution of the Text CAMs, the right panel the distribution and cumulative distribution of the Free CAMs (Fig.

Cumulative distributions of the empirical and simulated networks’ angular similarity scores for text and free CAMs
19).
As noted in Appendix B, network similarity scores tend to be low because the number of compared features is large, 861 and 6,670 dyads for the Text and Free CAMs respectively. Nevertheless, the map pairs are clearly more similar to each other than the simulated networks are for each map type. Focusing first on the Text CAMs, the modal pairwise similarity of the simulated text networks is 0 (approximately 65% of the sample compared to 16% of the Text CAMs), while the modal similarity of the Text CAMs is 0.04 with a mean similarity of 0.06. Although the simulated text networks reach a higher max similarity, these networks are outliers. The reason for the greater similarity between the Text CAMs is because the raters tended to associate concepts such as Carefree Childhood and Clear Messages similarly whereas concepts associations between the simulated text networks were at random. Consequently, although the simulated networks are structurally similar to each other, there is far less consistency in the associations across the networks and thus lower overall similarity.
The Free CAMs are also more similar to each other than the simulated networks, although the difference between the map pairs and simulated networks is less. The modal pairwise similarity of the simulated networks is 0 (80% of the sample compared to 49% of the Free CAMs). Although the modal pairwise similarity of the simulated and empirical Free CAMs is 0, a little more than 50% of the cumulative distribution of the map pairs is greater than 0, whereas only 20% of the simulated networks pairs had a similarity greater than 0. The simulated network pairs reach a higher maximum similarity, but these observations are outliers resulting from comparing so many network pairs. Like the Text CAMs, the Free CAMs exhibited higher overall similarity than the simulated free networks because the raters associated concepts such as Democratic Culture and Interaction in similar ways, resulting in greater pairwise similarity. The Free CAMs are less similar than the Text CAMs, however, because of the elicitation strategy used. Having participations freely associate concepts with a stimulus word resulted in more varied networks, a larger number of theoretically possible associations, and thus generally less similar networks. Nevertheless, although less similar, the Free CAMs exhibit some coherence, reflective in the greater overall similarity than would be expected by chance.
Rights and permissions
Open Access This article is licensed under a Creative Commons Attribution 4.0 International License, which permits use, sharing, adaptation, distribution and reproduction in any medium or format, as long as you give appropriate credit to the original author(s) and the source, provide a link to the Creative Commons licence, and indicate if changes were made. The images or other third party material in this article are included in the article's Creative Commons licence, unless indicated otherwise in a credit line to the material. If material is not included in the article's Creative Commons licence and your intended use is not permitted by statutory regulation or exceeds the permitted use, you will need to obtain permission directly from the copyright holder. To view a copy of this licence, visit http://creativecommons.org/licenses/by/4.0/.
About this article

Cite this article
Luthardt, J., Morgan, J.H., Bormann, I. et al. Quantifying emotionally grounded discursive knowledge with cognitive-affective maps. Qual Quant 56, 1557–1595 (2022). https://doi.org/10.1007/s11135-021-01195-7
Accepted:
Published:
Issue Date:
DOI: https://doi.org/10.1007/s11135-021-01195-7