
Abstract
Mobility as a Service (MaaS) is the integrated and on-demand offering of new mode-sharing transport schemes, such as ride-share, car-share or car-pooling. MaaS schemes may solve some of the most pressing mobility problems in large conurbations like London. However, MaaS schemes pose significant implementation challenges for operators and city authorities alike. With the existing transport and traffic planning tools, even basic questions do not have easy answers: e.g. how many vehicles are needed; how should they be deployed; what infrastructure changes are needed, and what will happen with congestion? This paper reports on the novel integration, through co-simulation of two independent agent-based simulators: MATSim and IMSim. MATSim generates realistic transport demand for a city: allocating travellers to the best mobility option according to their preferences; while IMSim provides a highly realistic operational execution of autonomous and manually driven transport fleets. We show how the simulation tools complement each other to deliver a superior Autonomous Mobility on Demand (AMoD) modelling capability. By combining the two, we can evaluate the impact of diverse AMoD scenarios from different standpoints: from a traveller’s perspective (e.g. satisfaction, service level, etc.); from an operator’s perspectives (e.g. cost, revenue, etc.); and from a city’s perspective (e.g. congestion, significant shifts between transport modes, etc.). The coupled simulation methods have underpinned the extensive MERGE Greenwich project investigation into the challenges of offering ride-share services in autonomous vehicles in the Royal Borough of Greenwich (London, UK) for travellers, service-operators, the city, and vehicle manufacturers.
Introduction: the transport revolution
A transport revolution is underway. The fiercely competitive development of digital and autonomous technologies is enabling new travel modes that may fundamentally change the way people move around in cities. Autonomous Mobility on Demand (AMoD) services (Pavone 2015) are one such MaaS solution that could allow autonomous vehicles (AV) to service ride-requests from customers on demand. These types of services may significantly improve urban mobility by providing a more efficient and safer transport while reducing the number of privately-owned vehicles (Heilig et al. 2017).
However, there are many potential challenges in the successful implementation of these services. Among the most significant is the likely increase in congestion and pollution due to the vehicles’ dead-running (or re-balancing), when an empty vehicle is directed towards an area of higher demand to enhance its chance of picking up a passenger. Another important potential issue is passenger safety. Rather than the technology risks (which many prospective customers perceive as solvable) ‘stranger danger’ is perceived as a greater risk (MERGE Greenwich Consortium 2018). This includes the infringement of social rules, the invasion of privacy, and the threat to personal security due to travelling with strangers in a confined space. The final pressing issue is range and charge-infrastructure: when and where should possibly electric AMoD services recharge, for acceptable service levels, and what are the implications for the power network? The provision of effective AMoD services requires reconciliation of multiple competing parameters involving multiple stakeholder groups representing both infrastructure and mobility service providers.
Consequently, commercial operators and city authorities fundamentally need tools capable of demand estimation and fleet simulation to enable a transparent assessment of the benefits and challenges of AMoD services. Demand estimation is an active field of research and practice, with alternative models currently being available in commercial software tools (such as PTV Group 2017; Department for Transport, Diadem 2012; Citilabs 2013). However, some of the software vendors have yet to address the topic. In the absence of an established commercial AMoD demand estimation solution and to avoid the limitations of existing tools, we decided to use an open-source, agent-based tool (Horni et al. 2016) which has already been used in similar studies (Hörl 2017; Maciejewski and Bischoff 2015).
Contribution statement
This research presents a comprehensive simulation approach to study the deployment of a ride-share AMoD service. Our approach couples a demand simulation model (built in MATSim) with a fully featured fleet simulation engine: IMSim, the Intelligent Mobility Simulator. This combination uniquely enables the study of a broad variety of mobility services with very detailed specifications, taking a realistic multi-agent demand model into consideration. It allows both commercial operators and city authorities to evaluate the impact that AMoD will have on the mobility ecosystem (with or without ride-sharing). For example, city authorities can use this tool to study the interplay between demand mode shift and prospective AMoD scheme. In contrast, commercial operators can study how best to tailor their offering to the customer market, and better understand the potential business opportunities arising from variations in the service features. These include, but are not limited to, the following: a multi-tiered service implementing service variations including fuel type [e.g. Electric Vehicles (EV) vs. Internal Combustion Engine (ICE)], seating capacity, and vehicle specification (e.g. no frills minibuses to executive vehicles); and a heterogeneous customer base with different sensitivities to wait and detour times, and different loading and unloading times (e.g. the impatient business person versus the wheelchair customer).
Literature review
Most of the modelling approaches that we discuss below allocate a pre-defined set of trips to a pre-configured AMoD fleet. All the studies assume a homogeneous demand without considering the specifications of the individual fleet vehicles. Zhu and Kornhauser (2017) possibly present the first end-to-end model to study the impact and deployment of AMoD. Using a simple grid-like simulation model of New Jersey, they have characterised a basic AMoD service according to fleet size and service level. A limitation of the study was the use of a Euclidian grid-like motion model that does not consider road travel times, congestion, etc.
Fagnant and Kockelman (2015) present a simulation model for a ride-share AMoD system in Austin, Texas. They use a MATSim model to estimate network conditions (such as link travel times), together with a simple ride-sharing allocation strategy based on homogenous demand and service levels. A noteworthy feature of their analysis is the inclusion of a return of investment (RoI) calculation showing the feasibility of commercial ride-sharing business models. More recently, Hörl et al. (2017), use a MATSim model for the city of Zurich to investigate the performance of different ride allocation algorithms. Notably, they did not model: ride-sharing, recharge, or limited vehicle range.
On a more theoretical front, Zhang and Pavone (2015) and Zhang et al. (2018) and references therein provide a formalisation of AMoD systems based on Queueing Theory concepts. These facilitate succinct model formulations that can be far more amenable to analysis provided aggressive simplifying assumptions are made. Typical assumptions include a station-based network, with a finite number of pick-up and drop-off locations, and homogeneous demand and service offerings. Ride-sharing and range-considerations are not considered.
A somewhat similar AMoD service to ride-share is car-share. Instead of simultaneous use of the same vehicle (ride-share), different users use the same vehicle sequentially (car-share). Car-sharing customers typically pick up a vehicle owned by a third-party for a short duration (usually an hour or less) drive it to their destination (or nearby), and park-up to end use of the service. These services are also known as One-Way Car-Sharing Systems. In Vosooghi et al. (2017) the authors provide an up-to-date review of the different techniques used to estimate the demand for such services. A salient deduction from their review is that most analyses are multi-agent based and a large proportion of them implemented using MATSim (Balac et al. 2015; Ciari et al. 2014).
It is notable that the existing models are unable to assess accurately the interdependence between the demand and the Level of Service (LoS) of the supply. In this paper, we fill this gap by proposing a dual agent-based model that integrates the AMoD operations into the demand modelling process.
Our modelling approach: IMSim meets MATSim
This section describes how we integrated the accurate estimation of demand for AMoD services and simulated the efficient operation of those AMoD services.
The demand model (MATSim)
Assessing the commercial viability of an AMoD ride-share service requires a good estimate of the potential uptake. In the UK, the National Trip End Model (NTEM) (Department for Transport, NTEM 2017) is a widely used source of information regarding (future) transport demand. We used NTEM to produce a set of Origin–Destination (OD) matrices, which were integrated into a MATSim (Horni et al. 2016) model. MATSim was used to estimate changes in peoples’ travel behaviour (in our case, mode shift) and predicted the effect on traffic conditions due to the introduction of the new AMoD services. Simulations were undertaken for the year 2025 which was considered as the earliest realistic time horizon for the widespread adoption of AMoD services (Futurism 2018).
In a major contribution, the MERGE Greenwich (2017) project commissioned an attitude survey towards the adoption of AMoD ride-share services by prospective customers. This allowed the MATSim model to include a probability factor for individual agents accepting a shared ride. This factor can be reduced should negative factors, such as a personal aversion, detract from ride-sharing.
The output of the demand model came in the form of aggregated OD matrices. Since, MATSim is an agent-based tool, the trips in OD matrices had to be disaggregated before use. Each trip was assigned information regarding the purpose, departure time, and initial mode of transport before the introduction of AV ride-sharing. The Value of Time (VoT) for each trip was also included together with demographic characteristics (i.e. age, gender, and income) derived from the National Travel Survey (NTS) and the UK census data, allowing each simulated trip to be attributed to agents.
An important feature of the combined MATSim/IMSim model is its inherent capability to personalise costs for each agent. For instance, according to WebTAG (Department for Transport, WebTAG 2017) the VoT changes depending on the purpose of the trip and the income of the traveller. This is something that can be explicitly defined in our agent-based framework which in turn, allows the assessment of niche scenarios and policies at a fine-grained level.
MATSim uses utility theory concepts (Horni et al. 2016; Kickhofer and Nagel 2016) to simulate changes in travel behaviour. A ‘plan’Footnote 1 is the term used by MATSim to describe an agent’s sequence of activities during its journey from origin to destination. Agents test a wide variety of potential plans by alternative modes of transport, and after enough iterations, decide on their preferred mode of transport. In our case, since the original transport demand derives from a trip-based model, no information can be extracted regarding the sequence of activities (trip-chaining). Instead, all plans were expressed as two activities: one at the origin and one at the destination, linked by an intermediate trip.Footnote 2 For each executed plan, a score representing the derived utility is calculated, influenced by:
transport mode costs, including operational costs (such as energy costs per distance driven) as well as out-of-pocket expenses (such as public transport fares and/or parking fares);
total travel time (treating waiting, detour, and actual travel time separately);
Value of Time (VoT); and
the attitude towards AMoD
Once the agents have executed and evaluated a wide range of different plans, the MATSim simulation stops. At this stage agents have selected their preferred transport mode, including AMoD. The proper evaluation of the plans using an AMoD service can only be achieved by knowing the additional waiting and detour delays due to ride-share. These additional travel-time components can significantly affect the benefit that agents derive from AMoD services. Potential delays play a critical role in determining the likely adoption of new services. Fortunately, the IMSim fleet simulator enables the accurate calculation of the additional waiting and detour delays due to ride-share.
The fleet simulation model—IMSim
IMSim is a novel agent-based mobility simulator for cities, urban areas, road infrastructure, and fleets of vehicles that has been developed as part of the TALON project (Immense Simulations Aug 2018; Immense Simulations Sept 2018) funded by Innovate UK. IMSim simulates ‘agents’—be they riders or vehicles—in a mode close to real operational service. Users can configure different scenarios to answer “what-if” mobility questions relating to people, vehicles, and travel infrastructure. This paper focuses on a TALON use-case: the methodology for managing ride-share with fleets of passenger vehicles, which forms part of the MERGE Greenwich project.
The Fleet Management Component (FMC) is the backbone of fleet operation simulation undertaken by IMSim. It models different types of vehicles (fuel or electric vehicles, with different ranges, fuel or battery capacities, and passenger capacities) according to different tiers of service operation. Although the FMC can model multiple tiers, this paper focuses on only two tiers: shared standard or shared minibus services.
The FMC emulates a human dispatcher allocating trip-requests to vehicles: specifying the routing criteria and dispatching vehicles to pre-position in the network to await expected demand. Two main methods are used to allocate trips to vehicles:
- 1.
Single pick-up—allocating a vehicle to a single trip (e.g. as it is done with traditional taxis nowadays); and
- 2.
Ride-share—allowing for multiple passengers to board the vehicle at different locations and computing the best route for pick-ups and drop-offs to maximise user satisfaction (this method is described below).
IMSim is also responsible for keeping track of the remaining range of the vehicles and sending them to refuel/recharge when required (e.g. range falling below a critical threshold). The vehicles are then routed to the closest refuelling or recharging station and are temporarily “out of service” until they have refuelled/recharged sufficiently.
Trip allocation for ride-share fleets
Any ride-share allocation algorithm needs to explore an extremely large solution space to discover suitable rider-vehicle allocations efficiently so that the customer gets a near-real time experience. Ride-share algorithms have been the subject of substantial research effort, see, for example, Hosni et al. (2014) and Agatz et al. (2012) for two recent reviews, and Alonso-Mora et al. (2017) for a state-of-the-art algorithm. The best allocations are those that unite riders and vehicles with well-matched geographical and temporal journeys. They start from similar origins (or points along a journey route) and travel to similar destinations at the same sort of time. This induces an extremely large search space. Furthermore, large scale ride-sharing schemes in the real-world need to incorporate additional considerations, the most critical of which we identify as: customer segmentation, and city compatibility.
Customer segmentation in a MaaS service is critical. Most algorithmic approaches consider a homogeneous customer base. However, there is a broad range of customer preferences such as: premium/business, silent trips, accessibility-enabled, women only, etc (Merge Greenwich Consortium 2018). These introduce further complexities in the solution space that need to be accounted for in finding an allocation solution.
In ride-share mode, the FMC allocates the passenger-requested ride-share trips to vehicles with freely available seats, so that the rides meet or exceed the service levels offered by the service operator. IMSim seeks to maximize passengers’ convenience by:
- 1.
Assuring that the allocated vehicle meets the passengers’ quality standards (i.e. for a standard or minibus ride);
- 2.
Minimizing the passengers’ waiting times for pick-ups; and
- 3.
Maximizing the number of sharing passengers because their trips:
- a.
are within a similar time frame;
- b.
go in similar or overlapping directions; and
- c.
have acceptable detour durations for a shared ride when compared to a direct journey; and
- a.
- 4.
ensuring that the rider gets the paid-for level of service.
IMSim features a proprietary optimization method which aims to find an optimal solution. The final solution may not be a truly optimal one, but a ‘good-enough’ approximation achieved in a reasonable amount of computer time. The algorithm takes two sets of inputs:
- 1.
The set of trips to be served, \({\mathcal{T}}\), with each trip characterised by:
- a.
Instances and Durations in Time—expected pick-up and maximum wait times;
- b.
Journey Location—pick-up and drop-off locations; and
- c.
Commercial Factors—the requested vehicle quality, the price points for each tier, together with a function that describes the sensitivity of customers to detours, i.e. the cost of the delays due to sharing a ride.
- a.
- 2.
A set of vehicles (i.e. a fleet), \({\mathcal{F}}\),with the current vehicle status being characterised by:
- a.
Vehicle Type—vehicle quality specification (e.g.,standard minibus etc.); and
- b.
Vehicle Locations—and their remaining range; and
- c.
Vehicle Capacity—current number of passengers on board and their individual delivery locations and times.
- a.
The algorithm’s goal is to partition the set of trips \({\mathcal{T}}\) among the vehicles so that no ride is allocated twice. This partition is obtained while attempting to solve the following optimisation problem:
where
\(S_{i}\) denotes the subset of rides allocated to vehicle \(i \in {\mathcal{F}}\)
\(g_{i} \left( {j |S_{i} } \right)\) is a customer experience function that quantifies the experience of trip \(j\) being served by vehicle \(i\) while \(i\) is serving also the other trips in \(S_{i}\).
The shape of the customer experience function is dependent on the vehicle tier (whether it be minibus or standard, etc.), the customer segment, and several trip- (and customer-) specific attributes. It is a measure of how well a given customer is served by the requested service. For example, an executive-tier trip would score well when delivered on time and incur higher (penalty) costs when it experiences a long detour in its service. In contrast, a minibus-tier trip would be more tolerant of delays.
Naturally, in addition to the experience functions there are several hard constraints that must be satisfied for a trip to be served. These include, but are not limited to, trip constraints such as pickup time being at or after the requested time and before the maximum wait-time has elapsed; and vehicle constraints, such as finding routes within the available range. Like the customer experience function, constraints can be trip- or tier- specific (e.g. the executive-private tier has more stringent time-constraints than, say, the minibus tier).
The problem defined above is a variant of the multi vehicle routing problem, which is a well-known problem in Operational Research, and it is NP-hard (just as an example, with 100 vehicles and 1000 trips, there are over 10300 possible combinations). Finding a uniquely optimal solution is almost certainly impossible to achieve in a reasonable amount of computational time. However, broadly speaking, the problem can be reformulated in such a way that efficient approximated solutions can be found. This is critical for a large-scale simulation engine which solves instances with hundreds of vehicles and thousands of trips. In summary, the algorithm tries to offer the best possible service to its customers given the resources available to it, and the characteristics of the service that is to be delivered.
Co-simulation—the fleet models respond to travel demand
Although new features [such as the dvrp module (Ronald et al. 2017)] have been introduced, MATSim cannot simulate an AMoD fleet out of the box and therefore, coupling with a fleet simulator is required. In this section, we describe the co-simulation interface between MATSim and IMSim agent-based simulators. The process begins by initiating MATSim with a population of agents wanting to complete a plan. A random set of those agents change their preferred mode to AMoD and execute their trip. As MATSim cannot calculate the total travel time including the waiting and detour times accurately, the total travel times for AMoD trips are calculated by IMSim. The MATSim–IMSim communication interface between the demand model and AMoD fleet operations is shown in Fig. 1:

Communication interface between MATSim and IMSim
- 1.
Initial demand—MATSim only
As discussed above, the computational time to calculate the trip allocations for the shared fleets can be significant. To minimise the need for coupled iterations between MATSim and IMSim, an initial estimate for AMoD service demand can be calculated solely by MATSim. The demand estimation is imprecise because MATSim does not know the occupancy of each vehicle or the waiting and detour time for each trip. For this reason, typical initial average values are estimated for these quantities (and held constant) rather than being precisely calculated by IMSim. This approach can give a reasonable demand-estimate in significantly less time than a fully-coupled ab initio MATSim–IMSim co-simulation. More than eight hundred MATSim iterations can be completed in less than a day compared to a fully coupled ab initio co-simulation requiring almost 24 days.
- 2.
Demand refinement—MATSim–IMSim co-simulation
Once an initial demand for AMoD is established, the co-simulation starts, and trip-requests are exported to IMSim. The exported trip-requests consist of the origin, destination, and departure time for each agent willing to use the AMoD service. MATSim also informs IMSim about the network conditions, i.e. the link travel times. IMSim uses the trip-requests and network conditions to calculate the optimum routes for the AMoD fleet. Simultaneously IMSim tracks the waiting- and detour- times that each agent has experienced. Moreover, information regarding the average occupancy of the fleet throughout the simulation period are recorded. This information is reported back to MATSim which in turn updates a) the perception (score) of the affected agents and b) the Passenger Car Unit (PCU) factor used to simulate the effect on traffic for each AMoD trip in MATSim. The communication interface between the two models is shown in Fig. 1.
When a trip-request cannot be served within the operator’s acceptable service limits, the trip is dropped, and a penalty score is assigned to this plan. The agent with the dropped request will abandon use of the AMoD service and thereafter rely on their initial mode of transport. This behaviour may not be entirely realistic, but the model can easily be modified to account for the effect of negative experiences on people’s perception of the new mobility services.
The co-simulation continues until the average score for all the executed plans reaches a steady value. Figure 2 (top) shows the evolution of the average score of the executed plans. The first 800 iterations refer to the initial (MATSim) demand estimation (Phase 1) while the last 35 refer to the demand refinement (the Phase 2 co-simulation). Including realistic delay information for the AMoD services gives agents a better understanding of the available transport options. Just after the co-simulation starts, this causes a slight but sudden increase in the average score of executed plans: agents can make better informed decisions with more accurate information.

Monitoring convergence. Top: evolution of average score of executed plans (Phase 1 and 2), bottom: trip-requests during demand refinement (Phase 2)
Coupling MATSim and IMSim increases the calculation complexity and the risk of divergence and improbable results. So, to assure a mutual and harmonious co-simulation, we monitor key simulation parameters for stable and convergent behaviour:
Modelling insights: the MERGE Greenwich case study
The Royal Borough of Greenwich (RBG) is one of thirty-three local authority administrative areas in London. It represents a typical urban area where AMoD services might complement the existing public transport services. As part of the MERGE Greenwich project (Addison Lee 2018; MERGE Greenwich 2017) different configurations of the IMSim ride-share model were tested to evaluate the potential viability of alternative future AMoD service-blueprints, from the operator-, city- and traveller- perspectives.
The agent-based nature of the overall IMSim model can generate very detailed results with wide applicability. These allow different stakeholders to focus on different aspects of the results. For example, a fleet operator will tend to focus on operational issues, such as fleet size, service performance, occupancy per vehicle, etc. City authorities will focus on the wider, social, legal, transport and administrative borough-level responsibilities, including the effects on congestion, modal shift from private and public transport, and fairness and accessibility for the broader community etc. This section presents a case study based on the RBG that shows how our tool can be used to address a variety of issues from both the operator and city perspectives.
Although the focus area for the AMoD ride-share service was limited to the Royal Borough of Greenwich, the whole of London (see Fig. 3) had to be modelled to some extent, to capture the trips into, out of, and across Greenwich. The overall MATSim model therefore included 65 zones, of which 33 are within Greenwich, and 32 for the other London boroughs. The network model was comprised of 14,063 nodes and 26,312 links.

Map of the modelled area (Greenwich, London, UK)
The total simulated demand involving Greenwich as origin, destination or via point was 640,641 trips, of which 27% (165,813) take place wholly within Greenwich. Only these “in-Greenwich” trips were allowed to switch to the AMoD service. The rest of the trips were private car trips crossing Greenwich and were simulated so that congestion effects could be properly evaluated.
The MERGE Greenwich case study: the service blueprints
The MATSim–IMSim simulator was used to analyse different market propositions as part of the MERGE Greenwich project. The market propositions were called “service blueprints” and were differentiated by the available vehicle types (fleets or tiers), the level of service offered, and the price to the consumer.
Separate vehicle fleets provide the different service tiers. This study considered two tiers of fleet:
- 1.
Minibus (8-seater), and
- 2.
Standard (4-seater).
Like any service operator, the model allowed the delivery a (defined) service levels for each tier:
- 1.
Minibus: 80% of trips served; 500% detour ratioFootnote 3 tolerated; 25 min max waiting time.
- 2.
Standard: 95% of trips served; 300% detour ratio tolerated; 15 min max waiting time.
Three Service Blueprints were considered:
- 1.
Accessibility Blueprint:
Readily accessible for the impaired; affordable on-demand AV ride-sharing maximizing transport accessibility; delivered by an 8-seater minibus (minibus tier); priced slightly above bus fares
- 2.
Convenience Blueprint:
Prioritises on customer convenience by offering a greater level of service; delivered by a 4-seater vehicle (standard tier); at the price of a standard service
- 3.
Combined Blueprint:
Offering the previous two services simultaneously to achieve a balance between accessibility and convenience; delivered both by minibus and standard tier vehicles
The configurable parameters for each simulation can be grouped in four classes:
Vehicle specifications:
- 1.
Number of seats: 8 for Minibus, 4 for Standard;
- 2.
Battery size/fuel capacity; and
- 3.
Battery/fuel consumption.
- 1.
Fleets:
- 1.
Number of fleets: this paper reports results for single fleet with multiple (cooperating) tiers of service; and
- 2.
Number of vehicles of each type (specification) within the fleet.
- 1.
Infrastructure (shown in Fig. 4 below):
Fig. 4 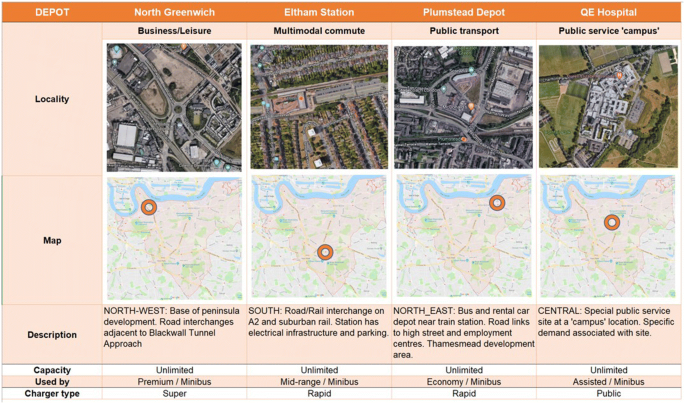
Location of fleet depots and charging/refuelling locations
- 1.
Depot locations; and
- 2.
Charging/Fuelling locations.
- 1.
Service offering:
- 1.
Maximum permitted wait time; and
- 2.
Maximum permitted detour ratio.
- 1.

The MERGE Greenwich case study: calibration and validation
Many approaches having been suggested for the calibration of agent-based models (Balakrishna et al. 2007; Fabretti 2014; Bianchi et al. 2007). From a transport modelling perspective, interest seems to have centred around the calibration of microsimulation models under Dynamic Traffic Assignment (DTA). Recent studies (Ben-Akiva et al. 2012; Oh et al. 2019) have suggested variations of the Simultaneous Perturbation Stochastic Approximation (SPSA) to estimate the requisite model parameters that minimise the discrepancy between the predicted and observed mode shares (e.g. by using traffic counts, surveys, etc.). Specific to the calibration of MATSim, the Cadyts calibration framework (Flötteröd 2009) offers a calibration approach that adjusts all the available parameters (such as departure time and mode choice) so that traffic counts are matched.
Despite the existing body of research, the authors believe that significantly more research is required to improve confidence in the calibration and validation of agent-based models. For this study, the proposed model was calibrated using a trial and error approach until the mode shares of the permitted simulated modes (prior to the introduction of the AMoD service) matched the corresponding values estimated by NTEM. According to NTEM the mode share for the year 2025 for private car is roughly 75% while for bus 25%. The transport mode-shares in Greenwich were calculated omitting modes not modelled (such as trips completed by overground or underground train).
Validation of the MERGE Greenwich models against prevailing travel demand and traffic conditions was performed through a cordon analysis and travel-time comparison process. UK Department for Transport data was used to compare the number of trips entering and exiting Greenwich against the corresponding number calculated by the model. Although there is room for improvement, actual trip numbers differed from the predicted trip numbers by less than 10%. A travel time comparison showed Google Maps® data to be broadly comparable with our model prediction (Fig. 5).

Travel time comparison on two routes between Google Maps® and MATSim
Even though our results could have been improved, they were considered adequate for the purposes of this research project. We believe that a significantly more detailed calibration and validation exercise is required before the model can be used for production purposes. However, this was beyond the scope of this study which was mostly focused on developing the required tools and methodology for the assessment of AMoD services.
The MERGE Greenwich case study: the operator’s perspective
Fleet-sizing
The full MERGE Greenwich blueprint has four different tiers or fleets. In this experiment we studied how the number of vehicles affected the level of service in a tier. We assumed long-range ICE vehicles and studied the number of vehicles in a single fleet, one fleet at a time. The vehicles were assumed to have the following power-plant parameters:
Fuel Capacity: 70.5 L (i.e. 18.62 gallons or 0.0705 m3);
Fuel Consumption rate: 20.9 L/100 km, (i.e. 11.25 mpg or 2.09 × 10⁻⁷ m3/m);
Refuelling time: 3 min (i.e. 180 s).
The full City Perspective analysis allows the MATSim model to adapt: the demand changes according to the customer-experience of using the fleets. For fleet-sizing studies, however, this creates a closed loop between demand (trips) and vehicles (supply). Convergence is not guaranteed, and the more complex analysis is beyond the scope of this paper. For fleet-sizing we therefore freeze MATSim’s daily demand for AV ride-share (AVRS), as shown in Fig. 6, to study the ability of different sized fleets to serving the demand with different numbers of vehicles.

Changing AVRS demand throughout the day
By fixing the number of vehicles for three of the tiers and only changing the number of vehicles in one fleet tier, (e.g. the minibuses), it is possible to see how adding more vehicles better serves the number of trip-requests. Figures 7 and 8 show this effect in the form of occupancy distribution graphs for the standard and minibus tiers for the three different minibus fleet sizes. The figures show the proportion of the fleet with a given number of passengers-on-board for 30-min time intervals throughout the day, where the proportion is measured by counting the number of vehicles with a specific head count and dividing by the total number of vehicles in the specified tier. The vehicle occupancy is indicated by colour (0-blue, 1-orange, 2-green, 3-red, 4-purple, 5-brown). With a small minibus fleet, ride-sharing is more evident: more purple in the histograms. With a larger minibus fleet, ride-sharing is less evident: less purple.

Fleet occupancy distribution for the standard tier

Fleet occupancy distribution for the Minibus Tier
Collectively the curves like those shown in Figs. 7 and 8 have been useful in estimating the necessary fleet sizes that give the required levels of service. We estimated ‘Base Case’ fleet sizes as requiring the following number of vehicles to give the indicated level of service (i.e. trips-served):
Minibus: 60 vehicles (86% of trips served)
Standard: 15 vehicles (91% of trips served)
Electrification
In the second set of experiments we studied the impact of using electric vehicles (EV), replacing the ICE minibus tier with an EV minibus fleet with the following vehicle specifications:
Energy Capacity: 80 kWh (c.f. 70.5 L of Petrol or 0.0705 m3);
Energy Consumption rate: 1440 J/m (c.f. 11.25 mpg or 2.09 × 10⁻⁷ m3/m, Petrol.)
Range: 200 km (c.f. 330 km, Petrol)
Recharge time: 30 min (c.f. 3 min, Petrol)
All the other parameters, such as fleet size and vehicle specifications for the remaining tiers were kept constant.
Figure 9 show the vehicles’ states over time: Idle, On-Call, In-Service, Waiting-Passenger, Dead-Running-To-Depot, Dead-Running-To-Recharge, Recharging. Each horizontal ‘bar’ indicates the state of an individual vehicle as it moves through the simulated day. The difference between the electric and the petrol tier is highlighted by the recharging pattern (in purple) in the case of the electric fleet.

State sequence per vehicle for the Minibus Tier—Petrol versus Electric
The bands of purple indicate when the EV minibuses return for recharge. Potentially this points to an operational problem as no minibuses will be available during parts of the morning and evening peaks. It is interesting to note that the service level only dropped by 4% so the overall service target was still satisfied. However, some of the ‘minibuses’ trips were served by the standard tier, compensating for the absent minibuses when they are recharging. This demonstrates that the ride-share model and vehicle allocation is behaving as intended. The service levels achieved for Experiment 2 are listed below (compared to the base case):
Minibus: 82% (vs. 86%)
Standard: 94% (vs. 91%)
Ride-share versus taxi
In the third set of experiments, we compared a non-ride-share simulation against the base ride-share case. All the parameters were kept constant except for the ride-share dispatcher components that were switched off and substituted by a traditional taxi-like, nearest-vehicle allocation of a single rider per vehicle. As a result, service levels consistently drop, as indicated below (compared to the base case):
Minibus: 44% (vs. 86%)
Standard: 40% (vs. 91%)
The observed drop happens mainly because ride-sharing allows a fleet to serve a greater number of rides. For a taxi-like service, the fleet is less utilised, as each vehicle now only allows one passenger at a time and trip-requests get cancelled once the maximum waiting time is exceeded:
Minibus: 25 min
Standard: 15 min
The number of trips served is now lower than the total trip-requests causing the observed drop in service level.
The MERGE Greenwich case study: the city’s perspective
This section focuses on outcomes of most interest to the city and transport authorities, such as RBG and Transport for London. These authorities need to develop a detailed understanding of how nascent AMoD services will affect citizens and travellers. Impact assessments—using simulation tools—can help authorities to understand the effect of new mobility services on, for example, the existing road network performance, accessibility, and shifts in public transport. Extending the earlier fleet-sizing and operating characteristics experiments, we can assess the various MERGE Greenwich project service blueprints. Now, with fleet sizes fixed, the demand floats freely and permit shifts in travel mode according to the MATSim methodology described previously. Table 1 summarises the effect on key performance indicators (KPIs) resulting from introducing AMoD ride-share services in Greenwich.
Table 1 shows that the three proposed blueprints give considerably different outcomes. The most successful blueprint in terms of total trip-requests is the Accessibility Blueprint while the least is the Convenience Blueprint. This seems to be driven by the low cost of the Accessibility Service coupled with a high level of service. Regardless of the blueprint, accessibility levels improve significantly because the travel-time reduction between buses and AMoD services is between 41 and 21%. The AMoD services also show a great potential for reducing the parking space requirements because of a 16–38% reduction in the number of trips requiring parking.
Nevertheless, the new AMoD services may not always have a positive effect. For instance, although the private car-usage is reduced by between 6 and 15%, bus trips are also reduced by 8–34%. This highlights the potential threat from new services to core public transport patronage. Somewhat surprisingly, the total number of kms driven by all vehicles (including the AMoD fleet) throughout the network also increases significantly by 57%. So, although travel times for private car users are reduced by 4%, CO2 emissions increase by 24% because of the overall increase in total vehicle distances driven.
Despite the apparently negative impact of some aspects of the proposed AMoD services, we believe the model has achieved its primary goal: the realistic simulation of AMoD fleet services in a city compatible environment. Clearly the potential for negative impact needs to be understood. Further research is clearly required. However, we believe that we have presented a tool to facilitate the forward-looking research: our MATSim–IMSim co-simulation tool will allow robust scenarios to be developed to test the transport environment of the future.
Conclusions
In this paper we have presented a novel simulation tool that enables the simulation of sophisticated ride-share AMoD services. This tool is composed of two main agent-based components: a demand generation and mode shift model, implemented using MATSim, and a cutting-edge fleet simulator IMSim.
Coupling simulations has been critical in developing an understanding of the challenges faced by key stakeholders offering and adopting AV ride-share services in Greenwich, be they travellers, service-operators, the city, or vehicle manufacturers. However, Greenwich is an important proxy for other UK urban areas. So, the challenges and solutions in Greenwich are likely to apply around the UK.
The model has allowed the assessment of a wide range of the effects arising from the adoption of AMoD services for multiple stakeholders. The model gives operators a better understanding of optimum vehicle fleet size, the type and size of powertrain, the vehicles’ occupancy, wait and detour times for each passenger, etc. A key feature of the model is its ability to evaluate the effect of service level offered on likely demand. Equally it gives transport and public authorities a better understanding of the likely effects on congestion, public transport patronage, and the environment, etc.
Many other important factors can be assessed too. For example, should a fleet operator want to study the impact of guaranteeing a certain level of service, our method would allow them to investigate how fleet sizes and energy (or range) requirements might affect the proposed pricing models. The complementarity of service tiers could also be investigated. For example, a commercial rideshare fleet used by commuters to connect with the city‘s transport network during the morning and evening rush hours might be used to deliver social service rides during the mid-day (off-peak) ‘demand valley’.
We believe that the methodology that we have presented delivers a general, enhanced decision-making capability, both strategically and operationally. These capabilities can, therefore, be leveraged to increase efficiencies in the delivery of AMoD services and improve their interoperability with the transport eco-system. In practice, the reported simulation tool can be applied prior to, and in parallel with, trials of service deployments to accelerate the delivery of effective schemes and to explore the mitigation of any adverse impacts.
Notes
MATSim agents can differentiate their plans in dimensions such as departure time, route and destination but for this study they were constrained to the transport mode.
Although MATSim can be used as a trip-based simulator (Horni et al. 2016), we plan to develop an improved activity-based model to estimate future demand for AMoD services.
Detour ratio is a measure of the additional time a trip could take due to picking up/dropping off other passengers in a shared ride compared to non-shared ride.
References
Addison Lee Ltd. MERGE Greenwich: The MERGE Greenwich Project (p. 33). Connected and autonomous vehicle research and development projects, September 2018. https://assets.publishing.service.gov.uk/government/uploads/system/uploads/attachment_data/file/737778/ccav-research-and-development-projects.pdf. Accessed 08 May 2019
Agatz, N., Erera, A., Savelsbergh, M., Agatz, N.: Optimization for dynamic ride-sharing: a review. Eur. J. Oper. Res. 223, 295–303 (2012)
Alonso-Mora, J., Samaranayake, S., Wallar, A., Frazzoli, E., Rus, D.: On-demand high-capacity ride-sharing via dynamic trip-vehicle assignment. Proc. Natl. Acad. Sci. 114, 462–467 (2017)
Balac, M., Ciari, F., Axhausen, K.W.: Carsharing demand estimation. Transp. Res. Rec. J. Transp. Res. Board 2536(August), 10–18 (2015)
Balakrishna, R., Antoniou, C., Ben-Akiva, M.E., Koutsopoulos, H.N., Wen, Y.: Calibration of microscopic traffic simulation models: methods and application. Transp. Res. Rec. J. Transp. Res. Board 1999, 198–207 (2007)
Ben-Akiva, M.E., Gao, S., Wei, Z., Wen, Y.: A dynamic traffic assignment model for highly congested urban networks. Transp. Res. Part C Emerg. Technol. 24, 62–82 (2012)
Bianchi, C., Cirillo, P., Gallegati, M., Vagliasindi, P.A.: Validating and calibrating agent-based models: a case study. Comput. Econ. 30, 245–264 (2007)
Ciari, F., Bock, B., Balmer, M.: Modeling station-based and free-floating carsharing demand. Transp. Res. Rec. J. Transp. Res. Board 2416, 37–47 (2014)
Citilabs: Cube Voyager Reference Guide, version 6.1. California, USA (2013)
Department for Transport: Dynamic integrated assignment and demand modelling (DIADEM) software. 9 October 2012. Retrieved from https://www.gov.uk/government/publications/diadem-software. Accessed 6 June 2019
Department for Transport: National Trip End Model (NTEM). 01 March 2017. https://data.gov.uk/dataset/11bc7aaf-ddf6-4133-a91d-84e6f20a663e/national-trip-end-model-ntem. Accessed 6 June 2019
Department for Transport: TAG Unit M2. March 2017. Retrieved from https://webarchive.nationalarchives.gov.uk/20190509013913/. https://www.gov.uk/government/publications/webtag-tag-unit-m2-variable-demand-modelling-march-2017. Accessed 6 June 2019
Fabretti, A.: A Markov Chain approach to ABM calibration. In: Social Simulation Conference (2014)
Fagnant, D.J., Kockelman, K.M.: Dynamic ride-sharing and optimal fleet sizing for a system of shared autonomous vehicles. Washington, DC (2015)
Flötteröd, G.: Cadyts—a free calibration tool for dynamic traffic simulations. In: STRC 2009 (2009)
Futurism: The First Driverless Uber Could Hit the Road as Soon as Next Year. futurism.com, 24 January 2018. Retrieved from https://futurism.com/first-driverless-uber-hit-road-soon-2019/. Accessed 6 June 2019
Heilig, M., Hilgert, T., Mallig, N., Kagerbauer, M., Vortisch, P.: Potentials of autonomous vehicles in a changing private transportation system - A case study in the Stuttgart region. Trans. Res. Procedia 26, 13–21 (2017)
Hörl, S.: Agent-based simulation of autonomous taxi services with dynamic demand responses. Procedia Comput. Sci. 109, 899–904 (2017)
Hörl, S., Ruch, C., Becker, F., Frazzoli, E., Axhausen, A.K.: Fleet Control Algorithms for Automated Mobility: A Simulation Assessment for Zurich. Arbeitsberichte Verkehrs- und Raumplanung, vol. 1270, Research Collection, IVT, ETH Zürich (2017)
Horni, A., Nagel, K., Axhausen, K.W.: The Multi-agent Transport Simulation MATSim. Ubiquity Press, London (2016)
Hosni, H., Joe, N.-S., Artail, H.: The shared-taxi problem: formulation and solution methods. Transp. Res. Part B Methodol. 70(C), 303–318 (2014)
Immense Simulations Ltd. TALON: Tools for Autonomous Logistics Operation & Management (p. 20). Connected and autonomous vehicle research and development projects, 4 September 2018. https://assets.publishing.service.gov.uk/government/uploads/system/uploads/attachment_data/file/737778/ccav-research-and-development-projects.pdf. Accessed 08 May 2019
Immense Simulations Ltd. TALON: Tools for Autonomous Logistics & Management, 31 August 2018. http://www.talon.world/. Accessed 08 May 2019
Kickhöfer, B., Nagel, K.: Microeconomic interpretation of MATSim for benefit-cost analysis. In: Nagel, K., Horni, A., Axhausen, K. (eds.) The Multi-Agent Transport Simulation MATSim, pp. 353–364. Ubiquity Press, London (2016). http://www.jstor.org/stable/j.ctv3t5r7p.58
Maciejewski, M., Bischoff, J.: Large-scale microscopic simulation of taxi services. Procedia Comput. Sci. 52, 358–364 (2015)
MERGE Greenwich: Autonomous ride-sharing vehicles, the future of urban transport (2017). Retrieved from: https://mergegreenwich.com/. Accessed 6 June 2019
MERGE Greenwich Consortium: Autonomous vehicle ride-sharing services: Will they make cities greener, more efficient and more accessible? London (2018). Retrieved from https://mergegreenwich.com/wp-content/uploads/sites/13/2018/07/MERGE-Greenwich-Will-AV-ride-sharing-make-cities-greener-more-efficient-and-more-accessible.pdf. Accessed 6 June 2019
Oh, S., Seshadri, R., Azevedo, C.L., Ben-Akiva, M.E.: Demand calibration of multimodal microscopic traffic simulation using weighted discrete SPSA. Transp. Res. Rec. J. Transp. Res. Board. (2019). https://doi.org/10.1177/0361198119842107
Pavone, M.: Autonomous mobility-on-demand systems for future urban mobility. In: Maurer, M., Gerdes, J., Lenz, B., Winner, H. (eds.) Autonomes Fahren. Springer Vieweg, Berlin, Heidelberg (2015)
PTV Group: PTV Visum 17 (2017). Retrieved from http://vision-traffic.ptvgroup.com/fileadmin/files_ptvvision/Downloads_N/0_General/2_Products/1_PTV_Visum/Overview_PTVVisum17_EN.PDF. Accessed 6 June 2019
Ronald, N., Thompson, R., Winter, S.: Simulating ad-hoc demand-responsive transportation: a comparison of three approaches. Transp. Plan. Technol. 40(3), 340–358 (2017)
Vosooghi,R., Puchinger,J., Jankovic,M., Sirin, G.: A critical analysis of travel demand estimation for new one-way carsharing systems. In: 2017 IEEE 20th International Conference on Intelligent Transportation Systems (ITSC), Oct 2017, pp.193–199. Yokohama, Japan (2017)
Zhang, R., Pavone, M.: Control of robotic mobility-on-demand systems: a queueing-theoretical perspective. Int. J. Robot. Res. 35, 186–203 (2015)
Zhang, R., Rossi, F., Pavone, M.: Analysis, control, evaluation of mobility-on-demand systems: a queueing theoretical approach. IEEE Trans. Control Netw. Syst. 6, 115–126 (2018)
Zhu, S., Kornhauser, A.: The interplay between fleet size, level-of-service and empty vehicle repositioning strategies in large-scale, shared-ride autonomous taxi mobility-on-demand scenarios. Washington, DC (2017)
Acknowledgements
The authors would like to acknowledge the help and support from fellow members of the MERGE Greenwich consortium, including colleagues from the Addison Lee Group, Ford, DG Cities, TRL and our own organisations. The UK government’s £31m CAV2 Competition funded the industrial research undertaken by the MERGE Greenwich consortium (Addison Lee 2018). Immense Simulations Ltd are also grateful for partial funding for work reported in this paper from the TALON project. TALON is being developed through industrial research funded from government’s £100m Intelligent Mobility fund. Both the CAV2 competition and the Intelligent Mobility fund are administered by the Centre for Connected and Autonomous Vehicles (CCAV) and delivered by the UK’s innovation agency, Innovate UK (Immense Simulations September 2018).
Author information
Authors and Affiliations
Contributions
RN, DK, PS-G, VP: study conception and design; PS-G: model development (IMSim); HB: model development (MATSim); DB, PS-G: software development (IMSim); VP, PS-G: model experimentation; VP, PS-G, HB, DK, RN: interpretation of results; DK, VP, PS-G, HB, DB: draft manuscript preparation.
Corresponding author
Ethics declarations
Conflict of interest
On behalf of all authors, the corresponding author states that there is no conflict of interest.
Additional information
Publisher's Note
Springer Nature remains neutral with regard to jurisdictional claims in published maps and institutional affiliations.
Rights and permissions
Open Access This article is distributed under the terms of the Creative Commons Attribution 4.0 International License (http://creativecommons.org/licenses/by/4.0/), which permits unrestricted use, distribution, and reproduction in any medium, provided you give appropriate credit to the original author(s) and the source, provide a link to the Creative Commons license, and indicate if changes were made.
About this article

Cite this article
Segui-Gasco, P., Ballis, H., Parisi, V. et al. Simulating a rich ride-share mobility service using agent-based models. Transportation 46, 2041–2062 (2019). https://doi.org/10.1007/s11116-019-10012-y
Published:
Issue Date:
DOI: https://doi.org/10.1007/s11116-019-10012-y