
Abstract
Flood vulnerability assessment (FVA) informs the disaster risk reduction and preparedness process in both rural and urban areas. However, many flood-vulnerable regions like Malawi still lack FVA supporting frameworks in all phases (pre-trans-post disaster). Partly, this is attributed to lack of the evidence-based studies to inform the processes. This study was therefore aimed at assessing households’ flood vulnerability (HFV) in rural and urban informal areas of Malawi, using case studies of Traditional Authority (T/A) Kilupula of Karonga District (KD) and Mtandire Ward in Lilongwe City (LC). A household survey was used to collect data from a sample of 545 household participants. Vulnerability was explored through a combination of underlying vulnerability factors (UVFs)-physical-social-economic-environmental and cultural with vulnerability components (VCs)-exposure-susceptibility and resilience. The UVFs and VCs were agglomerated using binomial multiple logit regression model. Variance inflation factor (VIF) was used to check the multicollinearity of variables in the regression model. HFV was determined based on the flood vulnerability index (FVI). The data were analysed using Multiple Correspondence Analysis (MCA), artificial neural network (ANN) and STATA. The results reveal a total average score of high vulnerability (0.62) and moderate vulnerability (0.52) on MCA in T/A Kilupula of Karonga District and Mtandire Ward of Lilongwe City respectively. The FVI revealed very high vulnerability on enviroexposure factors (EEFs) (\(0.9\)) in LC and\((0.8\)) in KD, followed by ecoresilience factors (ERFs) (0.8) in KD and\((0.6\)) in LC and physioexposure factors (PEFs) (\(0.5)\) in LC besides 0.6 in KD for the combined UVFs and VCs. The study concludes that the determinants of households’ flood vulnerability are place settlement, low-risk knowledge, communication accessibility, lack of early warning systems, and limited access to income of household heads. The study recommends that an FVA framework should be applied to strengthen the political, legal, social, and economic responsibilities of government for building the resilience of communities and supporting planning and decision-making processes in flood risk management.
1 Introduction
Floods are a natural hazard that many communities have to cope with. Climate change and variability have resulted in changes in terms of the frequency and magnitudes of flood-inducing storms in many regions (Hodgkins et al. 2017; Kundzewicz et al. 2019). The Emergency Events Database (CRED, 2019) reported that around 50,000 people died and approximately 10% of the world population was affected by floods between 2009 and 2019 (Moreira et al. 2021). In recent years, the world has deviated from flood hazard control to flood vulnerability assessments (Ndanusa et al. 2022; Ran et al. 2018). This is because the vulnerability of a community partly induces floods to become disasters (Nong and Sathyna 2020; Salami et al. 2017) and such assessments are important in strategic decision-making and planning (de Risi et al. 2013). Consequently, vulnerability assessment has become a primary component of flood hazard mitigation, preparedness and management (Ndanusa et al. 2022). Based on the findings of many studies in the assessment of flood vulnerability, it has been noted that several studies have not combined indicators of UVFs and VCs in their assessments. Those that have combined the indicators (Karagiorgos et al. 2016; Mwale 2014; Nazeer and Bork 2021) have not gone further to propose FVA frameworks to support decision-making, creating a gap which has been addressed in this current study. Anwana and Oluwatobi (2023) provided a review of the literature on flood vulnerability in informal settlements globally and in South Africa, in particular. Their review found a distinct knowledge gap in flood vulnerability studies. In the Ibadan metropolis area of Nigeria, Salami et al. (2017) proposed and applied a flood vulnerability assessment framework to provide flood vulnerability assessments of the human settlements and their preparedness to mitigate flood risk. The study established that previous experience of flooding was a key factor in awareness levels, although this awareness was not significantly related to the level of preparedness during flooding. De Risi et al. (2013) proposed a probabilistic and modular approach to analysing flood vulnerability in informal settlements of Dar es Salaam City in Tanzania. Alam et al. (2022) conducted a vulnerability assessment based on household views from the Dammar Char in Southeastern Bangladesh by constructing a vulnerability index using quantitative and qualitative data. The study revealed that, on average, the people living in the Dammar Char have a high vulnerability to coastal hazards and disasters. In North-West Khyber Pakhtunkhwa of Pakistan, Nazeer and Bork (2019) carried out a flood vulnerability assessment through different methodologies of rescaling, weighting and aggregation schemes to construct the flood vulnerability indices. The study found that the weighting scheme had a greater influence on the flood vulnerability ranking compared to data rescaling and aggregation schemes. Oyedele et al. (2022) analysed vulnerability to flooding in Kogi State of Nigeria as a function of exposure, susceptibility and lack of resilience using 16 sets of indicators. The indicators were normalized and aggregated to compute the flood vulnerability index for the 20 purposively selected communities. The study established that the selected communities had varying levels of risk of flooding, “very high” to “high” vulnerability to flooding. Munyai et al. (2019) examined flood vulnerability in three rural villages in South Africa’s northern Limpopo Province using a flood vulnerability index. The study revealed that all three villages have a “vulnerability to floods” level, from medium to high vulnerability. While all these studies have assessed flood vulnerability, a framework for guiding its assessment process has been not proposed. The lack of such a framework implies that flood risk reduction is not programmed to address current and future risks. This could be a reason why disaster risk management in Malawi, for example, is described as post-event humanitarian actions and reactive.
The Sentinels-4-African DRR rank Malawi position 11 out of 53 African countries affected by floods from 1927 to 2022 with statistics of 42 events, 948 deaths and 3531, 145 people affected (Danzeglocke et al. 2023). Similarly, the 2011 Climate Change Vulnerability Index by the British Risk Analysis Firm Maplecroft ranks Malawi 15 out of 16 countries with extreme risks to climate change impacts in the world. GOM (2023) indicates that over twenty-five disasters experienced in Malawi have been associated with severe rainfall events in the last decade. For instance, between the periods of 2015–2023, about four major floods induced by tropical cyclones have affected communities. The most destructive was the floods of 11–13 March 2023, influenced by tropical cyclone Freddy (TCF), which killed about 679 people, injured 2178 people, displaced about 563,602 people, and about 511 people were reported missing, including causing several other damages and loss in sectors such as agriculture, infrastructure, food security and health (GOM, 2023). A “state of disaster” was declared on the 13th of March in the districts that were affected by the cyclone namely; Blantyre City and District, Chikwawa District, Chiradzulu District, Mulanje District, Mwanza District, Neno District, Phalombe district, Nsanje district, Thyolo district and Zomba city and district. Relatedly, in January 2022, the passage of a tropical storm named “Ana” over southern Malawi with heavy rainfall caused rivers to overflow, floods and landslides. The flooding affected 19 districts in the southern region and among the heavily affected districts were Chikwawa, Mulanje, Nsanje and Phalombe. The event caused 46 deaths, and 206 injuries, 152,000 people were displaced with several infrastructural damages. The country also experienced the worst cyclone Idai which originated from Mozambique in 2019. This cyclone induced floods which killed 60 people as well as affected 975,000, displaced 86,976 and injured 672 people (PDNA, 2019). In January and February 2015, over 1 million people were affected and about US$ 335 million was incurred on infrastructural damage (PDNA, 2015). However, floods have been considered largely as a rural manifestation during the past years (Chawawa, 2018), with district councils taking the lead in flood management through the development of disaster risk management strategies and policies (Manda and Wanda, 2017). This neglect made disaster management policies and strategies to be limited to cities as compared to rural areas. Recently, Lilongwe City has experienced numerous flooding with varying impacts of damage in schools, health centres, shops, houses and loss of lives (LCDRMP, 2017). This increased occurrence and devastating impacts calls for putting measures in place to protect people living in flood-prone areas, including flood risk reduction, prevention, mitigation and management. However, strong measures cannot be put without FVA which is a cornerstone for disaster risk reduction (Munyai et al. 2019; Nazeer and Bork 2021; Nong and Sathyna 2020).
FVA provides a significant opportunity towards identifying factors leading to flooding losses (Lidiu et al. 2018; Nazeer and Bork 2021; Ndanusa et al. 2022). FVA is an impetus in which science may help to build a resilient society (Ran et al. 2018; Birkmann et al. 2013). In addition, FVA provides metrics that can support decision-making processes and policy interventions (Mwale et al. 2015; Ndanusa et al. 2014) and is a proactive task for pre-hazard management and planning activities (Parvin et al. 2022). Nazir et al. (2013) argue that FVA provides an association between theoretical conceptions of flood vulnerability and daily administrative processes. Mwale (2014) holds that vulnerability must be quantified and analysed to identify specific dimensions of vulnerability. Birkmann et al. (2013) add that the need to understand vulnerability is a primary component of disaster risk reduction at the household and community level and culture of building resilience. Iloka (2017) highlights that measuring vulnerability helps to determine immediate impacts on lives as well as future impacts of the affected households and communities. The Sendai Framework (2015–2030), an international policy for DRR also emphasises vulnerability assessment as a tool for minimizing the impact of hazards (UNISDR 2017). The Sendai Framework posits that vulnerability assessment should be conducted to understand risk in all dimensions of vulnerability, capacity, exposure of persons, hazard characteristics and the environment (UNISDR 2017). Birkmann et al. (2013) suggest that a vulnerability assessment is a prerequisite to reducing any natural hazard's impacts. Therefore, this study was aimed at assessing household flood vulnerability in both rural and urban informal settlements in Malawi. This was achieved by: (1) analysing the variability of households' flood vulnerability (based on physical, social, economic, environmental and cultural factors (2) quantifying household vulnerability to floods in Karonga District and Lilongwe City using multicollinearity analysis of vulnerability factors (physical, social, economic, environmental and cultural) and vulnerability components (exposure, susceptibility and resilience) (3) proposing FVA framework for rural and urban informal settlements, including constructing a multi-hazard vulnerability indicators which is missing in most studies. The study contributes to scanty literature on FVA in developing countries such as Malawi. As many areas of Malawi are flood-prone, the study directly informs decision-making for both preparedness and mitigation measures among the vulnerable communities.
2 Materials and methods
2.1 Study approach
This study carried out flood vulnerability assessment (FVA) using an inductive approach (Abass 2018; Kissi et al. 2015). The use of an inductive approach allows the study to apply quantitative techniques (Fig. 1). These techniques helped to isolate variables and indicators that were significant to contribute to household flood vulnerability.
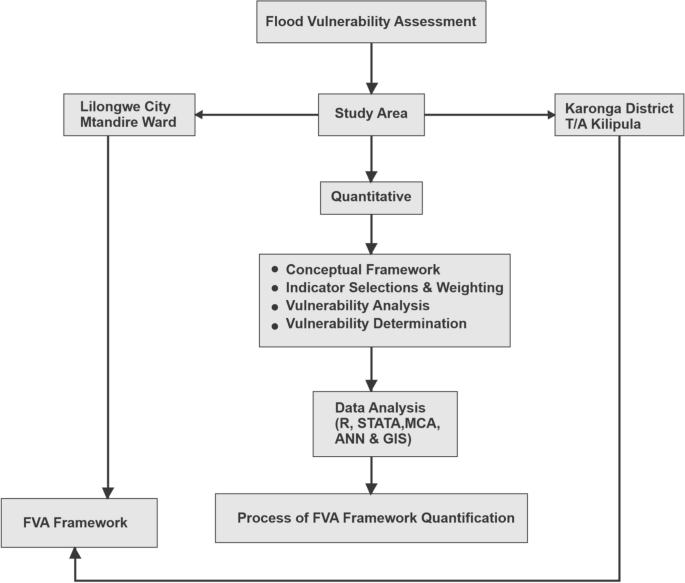
Methodology layout
2.2 Study area
This study was carried out in Karonga District and Lilongwe City in the northern and central regions of Malawi respectively. Specifically, this study was carried out in Mtandire Ward and Traditional Authority Kilupula in Karonga District and Lilongwe City respectively.
The target flood-prone area of T/A Kilupula in KD was the Lufilya catchment (Fig. 2). This study targeted two groups of village headmen (GVH) in T/A Kilupula of the northern part of Karonga district. These include GVH Matani Mwakasangila and Mujulu Gweleweta in Traditional Authority Kilupula. The area of GVH Matani Mwakasangila is found in T/A Kilupula located about 16 km north of Karonga town. GVH Matani Mwakasangila has five Village headmen (VH) namely Eliya Mwakasangila, Matani Mwakasangila, Chipamila, Shalisoni Mwakasangila and Fundi Hamisi. The greater part of the area—Eliya Mwakasangila, Chipamila and Matani Mwakasangila, are bounded by Lake Malawi to the eastern side and the M1 road-Songwe-Tanzania border to the Western side. The other two villages Shalisoni Mwakasangila and Fundi Hamisi are to the Western side of the M1 road. The area has numerous networks of rivers such as Lufilya, Kasisi, Fwira, Ntchowo, and Kasoba.

Map T/A Kilupula in Karonga District showing Villages of Study Area
This catchment of T/A Kilupula was selected based on the frequency of flood occurrence (Table 1). Kissi et al. (2015) indicate that the magnitude of an extreme event is inversely related to its frequency of occurrence. It was also chosen because the nature of their locations is prone to flooding (Mwalwimba 2020, 2024; SEP-2013–2018). This makes the residents vulnerable to flood hazards that cause disaster every year.
The area is dominated by floodplains along the shores of Lake Malawi (SEP-2013–2018). These areas are flat and low-lying areas as such this becomes the pre-requisite to flooding in the event of a heavy downpour (Karonga Met Office 2021). Furthermore, the choice of this area was due to settlement patterns, located in flood plains and issues of culture that have forced the people to occupy dangerous areas and even occupy the protected areas rendering them vulnerable to the effects of flooding (Mwalwimba 2020) (Fig. 3).

Settlement patterns of households in T/A Kilupula of Karonga District
Lilongwe district hosts the capital city of Malawi. The district became the host of the Capital city in 1975 after it was relocated from Zomba. The district owes its name to the Lilongwe River, which flows across the centre of the district (SEP, 2017–2022). The city has grown tremendously since 2005 when the government relocated all the head offices from Blantyre (SEP 2017). This growth has been also amplified by the presence of numerous opportunities in the city like access to socio-economic services and availability of markets for the produced products. This growth has contributed in generating a lot of vulnerable conditions of people to hazards such as floods, accidents, fires, droughts, environmental degradation and disease epidemics (LCDRM 2017) because of increased environmental degradation, and increased conversion of agricultural land into urban infrastructural development. Though hazards in the city overlap and interact in cause and effect, floods are the most frequently occurring hazards that affect many parts of the city (SEP 2017). As a category related to water and weather, floods, mostly affect areas like Mtandire (area 56), Kauma, Kaliyeka, Chipasula, Kawale, Nankhaka, Area 22, Kauma, New Shire, Area 25, Kawale, and Mgona in the city (LCDRM 2017) (Fig. 4).

Map of Malawi showing the Location of Karonga District and Lilongwe City
Mtandire Ward in Lilongwe City (Fig. 5) was chosen because it is an informal settlement, a condition that would likely put residents susceptible to environmental hazards like floods. The records indicate that floods repeated in 2013, 2014, 2015, 2016 and 2017. Data indicates that in February 2017, floods caused a magnitude of the disaster which caused great damage; more than 4000 people were affected including loss of people’s lives. The affected areas were Mtandire, Kauma, New Shire, Area 25, Kawale, Nankhaka and Mgona.

Settlement Patterns in Mtandire Ward of Lilongwe City
2.3 Flood vulnerability
Vulnerability is a complex concept and includes diverse components (Rana et al. 2018). Therefore, vulnerability requires a comprehensive methodology which can help to reveal various components (Moreira et al. 2021). Rana et al. (2018) stipulate that there is a lack of integrated methodology that fuses all the components. This study used an indicator-based approach to quantitatively assess household flood vulnerability. As accorded by ISDR (2014), the quantitative approach was useful in establishing indicators of the FVA framework. Kablan et al. (2017), and Nazeer and Bork (2021) agree that quantitative indicators are used to predict flood vulnerability. However, variation exists in the selection of the quantitative tools (Kissi et al. 2015). For instance, Nazeer and Bork (2021) applied Pearson’s correlation to predict flood vulnerability. Kissi et al. (2015) used deductive and inductive approaches to select flood vulnerability indicators. This study used binomial multiple logistical regression to predict household flood vulnerability. The use of this method allowed us to agglomerate the indicators of the UVFs and VCs (Fig. 6).
Conceptual framework
2.3.1 Conceptual framework on flood vulnerability
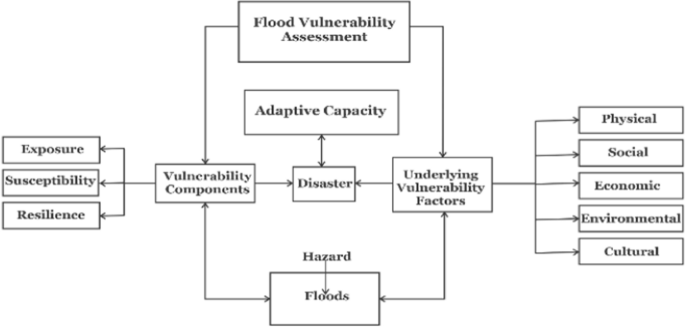
This study developed a conceptual framework based on the understanding that a vulnerability occurs as an intersection of biophysical vulnerability and social vulnerability (Iloka 2017; Wisner et al. 2004, Cutter 2003). This entails that the combination of hazard (floods) and vulnerability to harm society depends on the physical risk and social risk.
This conceptual framework indicates that two forces create vulnerability of households/communities to floods. First, households can be vulnerable to floods when subjected to the underlying vulnerability factors (physical, social, economic, environmental and cultural causes). Each of the causes, physical-social-economic-environmental-cultural, have the indicators that are used to identify households’ vulnerability to floods. Depending on variations that exist among these indicators in terms of their scores, percentages, inertias and probability values, households may be determined and/or predicted their vulnerabilities. The second force is determined by vulnerability components (exposure, susceptibility and resilience) (Kissi et al. 2015). Households are vulnerable to floods if they are exposed and susceptible to it and have less resilient to withstand its impacts (Rana et al. 2018). In this study, exposure is portrayed as the extent to which an area that is subject to an assessment falls within the geographical range of the hazard event (Nazeer and Bork 2021). This implies that exposure looks at possibility of flooding to impact people and their physical objects (Nazeer and Bork 2021) in the location they live. Furthermore, susceptibility means the predisposition of elements at risk (social and cultural) to suffering harm resulting from the levels of fragility conditions (Birkmann et al. 2013; Kablan et al. 2017; Nazeer and Bork 2021). Resilience of households is evaluated based on the capacity of people or society potentially exposed to hazards to adapt, by resisting or changing in order to reach and maintain an acceptable level of functioning and structure (Ndanusa et al. 2022). This is determined by the degree to which the social system is capable of organising itself to increase its capacity for learning from past disasters for better future protection and to improve risk reduction measures as well as to recover from the impact of natural hazard (Birkmann et al. 2013; Nazeer and Bork 2021). Iloka (2017) states that low incomes, lack of resources, and unemployment are some of the factors that make vulnerability leading to disasters. This study’s conceptual framework highlights the scenario that the occurrence of hazards (floods) in a community (Lilongwe city and Karonga district) where households are subjected to many characteristics in the vulnerability factors while at the same time the households are exposed and are susceptible to floods, the condition may turn floods to become disasters. It is only when the households have enough resilience and adaptive measures that they can either cope up with or respond quickly to the hazard (floods). Similarly, if the households are not resilient and have fewer adaptive measures, a situation that may increase vulnerability of households to the hazard impact resulting in a devastating disaster. Therefore, lack of adaptive capacity means that the community may be limited to respond to the disaster on time thereby their vulnerability will be always high. This conceptual framework gives a basis that flood vulnerability assessment therefore should examine factors that predict household vulnerability to floods and link them to the composite indicators of vulnerability, including understanding their adaptive capacity that would help them to cope with flood impacts. The assessment, using this framework should analyse several indicators from the underlying vulnerability factors and components of vulnerability to fully identify which of these conditions contribute to vulnerability in a specific location to generate standardised indicators of flood vulnerability assessment.
2.3.2 Indicators of flood vulnerability
Flood vulnerability was explored through the lens of underlying vulnerability factors (UVFs)-physical-social-economic-environmental and cultural (Table 2). The physical vulnerability (PV) has been defined as the vulnerability of the physically constructed materials. The indicators were defined as pre-underlying factors that may contribute to the constructed elements (houses & other infrastructures) being vulnerable to flood hazards. Social vulnerability (SV) is looked at by the influences of the variety of social processes which create the vulnerability of households to floods (Joakim 2008). Economic vulnerability (EcV) is defined as the influences of economic processes existing in the community i.e. livelihood activities that may or may not contribute to household vulnerability. Environmental vulnerability (EnV) is the vulnerability of the built environment as described by pre-existing conditions like residing in prone areas and use of natural resource base. Cultural vulnerability has been defined as vulnerability influenced by cultural fabric such as beliefs, customs, cultural conflicts and absence of resource ownership.
The vulnerability components (VCs)-exposure-susceptibility and resilience (Table 3) were combined by UVFs. Physical and environmental factors linked to exposure (i.e. human settlement damage, house type, location, rivers). Social and cultural factors combined with susceptibility (i.e. community accessibility, flood risk awareness, adaptation mechanisms, warning systems) to determine household vulnerability. Economic factors linked with resilience (i.e. a source of income, the capacity of economic skills and resource skills).
Both the UVFs and VCs were selected based on a thorough review of contemporary frameworks such as Pressure and Released Mode (Wisner et al. 2014); Urban Flood Vulnerability Framework (Salami et al. 2017); and the Hazard of Place Model (Cutter 1996). Since there is no generally acceptable way of selecting vulnerability indicators (Kablan et al. 2014; Nazeer and Bork 2021), this study considered the indicators based on a cut-off point of probable value zero to one where zero represents the minimum and one indicates maximum values (Kissi et al. 2015; Nazeer and Bork 2021; Ndanusa et al. 2022). Data on the UVFs and VCs were collected using a quantitative cross-sectional structured survey questionnaire from 200 and 345 household participants in T/A Kilupula of KD and Mtandire Ward of LC respectively. The questionnaire was programmed in KoBocollect and Android tablets were used to capture the data from household participants. Data were also collected for the elements at risk from each underlying vulnerability component to determine the contribution of vulnerability for the households.
The vulnerability component indicators (Table 3) were normalised to have a comparable set of indicators, the study adopted the Min–Max normalisation to convert the values to a linear scale (such as 0–1) (Balica et al 2012; Erena et al. 2019; Kissi et al. 2015; Nazeer and Bork 2021; Ndanusa et al. 2022). Vulnerability increases with an increase in exposure and susceptibility, and it decreases with an increase in Resilience (Kissi et al. 2015; Mwale 2014; Munyani et al. 2019; Nazieer 2021). Therefore, normalisation was based on the assumptions that:
(a) Vulnerability (V) increases as the absolute value of the indicator also increases. In this case, where the functional relationship between the indicator and vulnerability is positive, the normalised indicator is derived using the following equation (Oyedele et al. 2022).
(b) Vulnerability (V) decreases with an increasing absolute value of the indicator. Here, when the relationship between vulnerability and the indicator is found to be negative, the data are rescaled by applying the equation (Oyedele et al. 2022).
where Xi = normalised value; Xa = actual value; XMax = maximum value; XMin = minimum value for an indicator i (1, 2, 3... n) across the selected communities.
Furthermore, no weight was assigned to the indicators of vulnerability components. The reason for not including weights was that most of the responses during the stakeholders’ engagement were contradictory and highly inflicting. Therefore, to avoid an index value that will mislead the end users, the normalised indicator was aggregated into its respective sub-indices for the final flood vulnerability index. The additive arithmetic function was employed in the aggregation of the indicator into its respective sub-indices (exposure, susceptibility, and lack of resilience) using an equation (Kissi et al. 2015; Nazeer and Bork 2021; Oyedele et al. 2022).
The overall flood value of the vulnerability index was computed with Eq. (4), an additive function (Nazeer and Bork, 2019; Lee and Choi 2018; Oyedele et al. 2022).
where SIE means sub-indices exposure, Susceptibility (SIS), and lack of resilience (SILoR) for “n” numbers of indicators in each component of vulnerability.
The study measured the level of vulnerability of the elements at risk in all the underlying vulnerability factors (Table 4). These were evaluated based on the constructed scale which modified the Balica et al. (2012) and was calibrated as (0–0.2) very low vulnerability; (0.2–0.49) moderate vulnerability; (0.5–0.59) vulnerability (0.6–0.79) high vulnerability and (0.8–1) very high vulnerability. However, in the actual data collection tool (household questionnaire survey), Mwalwimba (2020) measurements scale of “not vulnerable”, “slightly vulnerable”, “vulnerable”, “severely vulnerable” and “do not know” were used and later the percentage obtained during univariate analysis were computed and compared to the weighting scale constructed (Balica et al. 2012) (3.10). Ndanusa et al. (2022) argued that a breakdown of the elements at risk poses a serious threat to communities' vulnerability and prosperity. This consequently contributes to the higher vulnerability of the community to hazards.
2.4 Study population and sampling determination
The target flood-prone area of TA Kilupula in KD was selected based on the frequency of flood occurrence. Kissi et al. (2015) indicate that the magnitude of an extreme event is inversely related to its frequency of occurrence. Whilst, Mtandire Ward in Lilongwe City was chosen because it is an informal settlement. Household participants in Mtandire ward were those specifically in two Group Village Headmen, Chibwe and Chimombo of Senior Chief Ligomeka. These villages are located along the Lingadzi River opposite area 49 (New Gulliver). This study used a total of 10 headmen (VH). The choice of the VH was based on proximity to Lingadzi River. Mtandire has a total population of 66,574 people, but 5000 people are reported to be at risk of floods (MDCP 2010–2021; MPHC 2018). Relatedly, the target population in Karonga district were households of GVH Matani Mwakasangila and Mujulu Gweleweta in Traditional Authority (TA) Kilupula. These household villages share a network of water systems such as Lufilya, Mberere, Ntchowo and Fwira (Mwalwimba 2020). This study used a total of 10 village headmen (VH), five from each GVH. The choice of five VH in each GVH was based on the fact that each GVH in T/A Kilupula has a minimum number of five Village Headmen (Karonga Chief Classification 2016). T/A Kilupula has a total population of 78,424 people, with approximately 9500 households at risk of floods (KD-SEP 2013-2018; MPHC 2018).
The sample size (n) for this study was calculated using the formula in Fisher et al. (2010) as shown in the Eq. (5). The formula in Eq. (5) returns the minimum sample size required to ensure the reliability of the results.
In Eq. (7), Z is the confidence level (1.96 for 95%), p is the proportion of the target households, q = is the alternative (1-P) and d is the power of precision (d = 0.05 at 95%). The formula requires knowing the target population (P) and it also assumes “P” to be 0.5 which is conservative. Therefore, the fact that the number of households prone to floods in T/A Kilupula and Mtandire ward is known, using this formula, 384 and 246 households were obtained from Mtandire ward and T/A Kilupula respectively. The study used 0.5 (50%) to represent “P” in Mtandire Ward and 0.2 (20%) to represent “P’ in T/A Kilupula. The reason for differentiating the “P” was that in the Mtandire ward, the whole area was selected while in T/A Kilupula not all the GVHs were selected and involved in the survey. Furthermore, unlike in T/A Kilupula where the population is sparsely distributed and households were selected based on location to flood-prone areas, in Mtandire ward 50% was used as conservative because of high population density such it was possible to interview many households. During data collection, the researcher managed to collect data from 345 and 200 household participants, representing 90% and 81% of the total sampled in Mtandire ward and T/A Kilupula respectively. The reason for not completing the actual sample size was that the household survey interviewed houses along the buffer zones of Lingadzi and Lufilya rivers and the whole area of the buffer was randomly selected. Therefore, continuing to interview every household in the buffered area would have meant interviewing every household. This would have worked against the rule of simple random sampling strategy and survey ethics (Kissi et al. 2015).
2.5 Questionnaire design and administration
This study used a structured household questionnaire survey. This questionnaire captured information that provided the linkages of households’ vulnerability factors, exposure, susceptibility and resilience. Associations of vulnerability factors have been supported in the literature (Kissi et al 2015; Mwale 2014; Nazeer and Bork 2021). Nazeer and Bork (2021) argue that the issue of double counting of the indicators is an important step to be considered in the formation of composite indicators. The household questionnaire survey was coded in KoBoToolBox. The household questionnaire survey was administered face-to-face with household participants who were above 21 years old. The age parameter was controlled in the KoBoToolBox environment such that the interviewers could not proceed with administering the questionnaire if this question was not answered even if the age entered was below 21. It is also important to note that the attributes of the variable age were not coded because it is a continuous variable hence the ages were manually collected from the participants. Finally, the household questionnaire survey was pretested and piloted in Mchesi and Mwanjasi in LC and KD respectively. Before pretesting and piloting, the research assistants (RAs) were trained to have a common local understanding of the terms that were contained in the questionnaire, specifically vulnerability, floods, resilience, susceptibility, adaptive capacity and exposure.
2.6 Data analysis
To determine variations among the indicator variables of UVFs for the predicted factors, a Minitab statistical test called Multiple Correspondence Analysis (MCA) was computed. MCA produced two outputs called “Indicator Analysis Matrix” and “Column Contribution table”. The column of contribution is used to determine the variations that exist between indicators (Husson 2014). On the other hand, the total inertia in the Analysis of Indicator Matrix (AIM) was averaged for all the five UVFs in LC and KD to obtain a single inertia which was used to determine a multi-correspondence variations of vulnerability factors (MIHVF).The indicators in the assessment that contributed to flood vulnerability were marked with red ink in the measurement scale of important (INT) and very important (VINT). The significance levels between demographics and vulnerability factors were analysed using the single chi-square test and a combined value analysis package. Also, chi-square tests and probability value (p value) were used to compute significance levels of variables in UVFs and VCs. The formula for chi-square statistics is:
In addition, it follows a with (r−1) (c−1) degrees of freedom. Where
-
Oij is the observed counts in cell ij; i = 1, 2, 3…..r and j = 1, 2, 3…..c where r is the number of rows and c is the number of columns in an r × c contingency table.
-
Eij the expected counts in cell ij; i = one, 2, 3…..r and j = 1, 2, 3…..c where r is the number of rows and c is the number of columns in an r × c contingency table.
Those that were significant were computed in the modified binomial multiple logistical regression model using equations. All these were performed in “r” and STATA version 12.
A post-analysis of computed results was carried out using an artificial neural network (ANN). ANN is a machine learning method that stands more independent in comparison than statistical methods (Ludin et al. 2018; Parvin et al. 2022). Several studies have used ANN to predict specific events (Mwale 2014). Due to its predictive ability, this method was applied in this study as a post-analysis to predict the causes of flood vulnerability of the variables which were statistically tested using a combined P value package between UVFs and VCs. ANN comprises several nodes and interconnected programming elements (Mwale 2014; Parvin, et al. 2022). It contains input layers, hidden layers and output layers (Ahmadi 2015) (Fig. 7).

Example of ANN using MLP
The multivariate level used the multiple binomial logistical regression model (Eq. 6) (Israel 2013) to predict household flood vulnerability. It utilised a paired comparison model (Hamidi et al. 2020; Chen et al. 2013), in which each UVF was linked with a selected vulnerability component (exposure, susceptibility and resilience). This link is accorded in the studies of Wallen et al. (2014) and Mwale (2014). This model generated significant levels of physical exposure, social-susceptibility, eco-resilience, enviro-exposure and cultural-susceptibility. Then, the Flood Vulnerability Index (FVI) was applied to determine which factor contributes to vulnerability (Balica et al. 2012; Kissi et al. 2015). The FVI uses a probability range of 0–1 (Balica et al. 2012) where 0 means not vulnerable and 1 means more vulnerable. Using Eq. 1, the paired attributes were run in r environment through the modified binomial logit multiple regression (Eq. 6). However, it would have been significant to use logit-ordered regression since the vulnerability has a certain order (Kissi et al. 2015; Hamidi et al., 2020).
where \({y}_{j}\) is a response variable (i.e., as selected from exposure, susceptibility and resilience) \({\beta }_{i}\) is intercepted (values generated by the equation after extraction in r- environment, \({\delta }_{i}\) is predictor variable (selected from physical, social, economic, environmental and cultural), \({O}_{i}\) operator (i.e., measurement scale, less important and very important which considered by the model), \({\epsilon }_{j}\) is an error. This equation was applicable for all the \(UVFs,\) thus parameters in the \(UVFs\) were predicted separately based on the \(VCs\) to which they were associated. The link of UVFs and VCs in the regression model was computed in an implicit relationship showing the predictor and response variables (Table 5).
The binomial logit regression model was used based on three assumptions which implied that:
-
a.
The indicators for UVFs should be measured as a proportional value of household participants involved during the survey. The percentage values should be generated using a scale range with the operator of “less important”; “important” and “very important” to contribute to flood vulnerability”. However, for flood vulnerability determination, a cut-off point should be placed at greater or equal to 50% for each indicator from the operator of the scale range of “important” and “very important”. In this case, all the values generated in the scale of “less important” as responded by the participants should be left out during determination and selection.
-
b.
The linkage of UVFs and VCs should be based on statistical tests using P-values or correlation (r) or simply any statistical test applicable to the researcher. The values that are significant at a certain confidence level (i.e. 0.05 in this study) should be selected to be included in the framework for specific combinations like Physical Exposure Factors (PEFs), Socio-Susceptibility Factors (SSFs), Eco-Resilience Factors (ERFs), Enviro-Exposure Factors (EEFs) and Cultural-Susceptibility Factors (CSFs). Furthermore, those values significant at an appropriate confidence level should be considered as factors generating flood vulnerability in the studied areas.
-
c.
Multicollinearity of the UVF and VC variables should be checked using variance independent factor (VIF) to assess the level of correlation in the regression model. It is assumed that a variable with VIF ≥ 10 has higher variance inflation in influencing other response variance and is redundant with other variables. As such, that variable should be dropped. In this study, the VIF process was done in SPSS.
Flood vulnerability index (FVI) was used in the determination of household flood vulnerability based on the output of the analysis of the results. A summarized comparison flood vulnerability index (FVI) probability scale 0 to 1 (Balica et al. 2012) has been presented in Table 6.
Results were presented on spatial distribution maps, computed in ArcGIS 10.8 Desktop. Shapefiles for Malawi administrative boundaries were downloaded from MASDAP (Malawi Spatial Data Application Portal). Then Excel was used to generate the tabulated information and pie charts and later exported the output to ArcMap. The Maps were coloured to show the contribution of each variable to households' flood vulnerability (Fig. 8).

Vulnerability levels
3 Results and discussions
3.1 Variability of underlying vulnerability factors
The results of Multiple Correspondence Analysis (MCA) output have been outlined in Tables 7, 8, 9, 10 and 11, with those with higher quality value (Qual.), inertia, correlation (Corr.) and contribution (Contr.) marked with red ink to depict variation in flood vulnerability.
The results in Table 7 show all the physical variables marked by red ink have larger quality values in Mtandire Ward of LC. However, the results in T/A Kilupula of KD show the greater quality value in the scale of “VINT” for indicator values of poor construction standards for houses (0.551) and lack of construction materials (0.708). Furthermore, the results also indicate a higher correlation (corr.) for poor construction standards for houses in the scale value of “INT” and ‘VINT, accounting for a higher amount of inertia in both rural and urban areas. Construction of roads and other infrastructures (0.234) account for a high contribution to the inertia in Mtandire Ward of LC while poor construction of housing standards account for a higher inertia value (0.201) in both Mtandire Ward of LC and (0.313) and in T/A Kilupula of KD (Table 7). The results further established that physical elements at risk on the scale of “severe vulnerable” have the vulnerability thresholds of 0.5 and 0.6 in Mtandire ward and T/A Kilupula respectively.
The results of MCA show a significant contribution of vulnerability with a quality value in the category of social security on the scale of INT (0.506) and VINT (0.500). The results further show a significant contribution of vulnerability in the category of inavailability of health services (0.513) in the scale of INT in LC. In T/A Kilupula of KD, the results show significant quality values on lack of capacity to cope (0.821) in the scale of INT, social security and human rights in the scale of INT and VINT (Table 7). While the results of the inert values in Mtandire Ward of LC do not deviate much from the expected, in T/A Kilupula of KD the inert value of lack of capacity to cope (0.124) in scale of INT and social security (0.117) in a scale of VINT deviate from the expected value. The results also indicate a higher correlation (corr.) social security (0.504) and human rights (0.648) and unavailability of health services (0.506) in Mtandire Ward of LC while lack of capacity to cope (0.790) and social security (0.560) have higher Corr in T/A Kilupula of KD accounting higher amount of inertia to contribute to vulnerability. The results further show all the indicator variables in the scale of “INT) contribute higher to the inertia in Mtandire Ward of LC while only lack of capacity to cope (0.2613) and social security (0.2141) contribute higher to the same in T/A Kilupula of KD (Table 8).
The results in Table 9 show that lack of markets (0.574) and poverty (0.513) in the scale of “INT” have higher quality value in Mtandire Ward of LC while lack of credit unions and lack of markets showed higher quality value in T/A Kilupula of KD. These results suggest that lack of markets, poverty and lack of credit unions contribute more to household vulnerability to floods than lack of alternative livelihoods. The results further show that all the indicator variables in Mtandire Ward of LC have an inertia value at the expected rate of less than 10% while in T/A Kilupula of KD lack of credit unions (0.103), lack of markets (0.499) and poverty (0.123) display values that deviate from the expected. Similarly, the results show a weak correlation (less than 1) for all the economic indicator variables in Mtandire Ward of LC and only lack of markets (0.499) is close to 1 in T/A Kilupula of KD thereby contributing highly to the inertia. The lack of credit unions and lack of markets account for a high contribution to the inertia, thereby suggesting a high contribution to flood vulnerability. The results also found that the economic elements at risk have a higher vulnerability value in T/A Kilupula (0.55) compared to Mtandire ward (0.33) on the scale of severe vulnerable.
The results in Table 10 show that except for poor land management in T/A Kilupula of KD for scales of INT and VINT, environmental mismanagement and inappropriate use of resources have larger quality values in Mtandire Ward of LC and T/A Kilupula of KD. No indicator variable depicted the unexpected inertia value in Mtandire Ward of LC and T/A Kilupula of KD. In LC, the results further revealed that the correlation is higher for environmental mismanagement (0.524) in the scale of INT, poor land management is also higher in both scales and inappropriate use of resources (0.518) in the scale of INT. However, extensive paving (0.674), environmental mismanagement (0.557) and poor land management (0.677) have higher correlation values close to one. Environmental mismanagement (0.169), poor land management (0.202; 0.104) and inappropriate use of resources (0.152; 0.105) account for high contribution to the inertia in Mtandire Ward of LC while extensive paving (0.1721) and environmental mismanagement (0.137; 0.101) account for higher contributions in T/A Kilupula of KD (Table 10). It was also found that environmental elements at risk are more vulnerable in T/A Kilupula of Karonga on a scale of “slightly vulnerable” (Fig. 4.39) compared to the Mtandire ward of Lilongwe City.
The results in Mtandire Ward of LC showed that lack of safety measures (0.551) and lack of personal responsibility (0.632) have high-quality values above the cut-off of 50% while in T/A Kilupula of KD traditional beliefs (0.508), settlements conditions (0.579), lack of safety measures (0.596) and lack of personal responsibility (0.636) have high-quality values. No indicator variable depicted the unexpected inertia value in Mtandire Ward of LC and T/A Kilupula of KD. The results further revealed no strong correlation (close to 1) in Mtandire Ward of LC to contribute to inertial variability. Nevertheless, in T/A Kilupula of KD, the results showed a strong correlation between traditional beliefs (0.506) and poor settlement conditions (0.576). This suggests people living in Mtandire Ward are not aware that they live informally. It was noted that Mtandire Ward is not properly defined as it is part of the Lilongwe City or Lilongwe District. While results show no higher value for contribution (Contr) in Mtandire Ward of LC, traditional beliefs (0.187), settlement conditions (0.199) and language of communication (0.1526) account for high contribution to the inertia in KD (Table 11).
Cumulatively, the results of the MCA for all indicators in the category of quality value \(\ge\) 0.50 (50%) revealed an average of “high vulnerability” (0.62) in T/A Kilupula of KD and “moderately vulnerability” (0.52) in Mtandire Ward of LC. Based on individual factors, the results found high physical vulnerability in both T/A Kilupula (0.61) and Mtandire Ward (0.65), high social vulnerability in T/A Kilupula (0.68) compared to moderate social vulnerability in Mtandire Ward (0.58), high economic vulnerability in T/A Kilupula (0.60) compared to moderate economic vulnerability in Mtandire Ward (0.51), high environmental vulnerability in both T/A Kilupula (0.67) and Mtandire Ward (0.68) and moderate cultural vulnerability in T/A Kilupula (0.54) compared to very low cultural vulnerability in Mtandire Ward (0.16).
3.1.1 Artificial neural network: multi-layer Perceptron (MLP)
The results of the ANN in multi-layer perceptron (MLP) to show the relationship between the indicators used in the UVFs and those in the VCs are presented in Tables 12, 13, 14, 15 and 16.
The results of exposure linked with physical factors reveal that there is a strong relationship between house type with PCS in T/A Kilupula of KD, while in Mtandire Ward of LC the relationship is not very strong (−9.116) (Table 12). The relationships of house type with CRFs imply that these contribute to household flood vulnerability. Lack of construction materials (PCMs) has a strong network value in T/A Kilupula of KD compared to Mtandire Ward of LC with a negative value (Table 12). The results reveal that houses made up of bamboo followed by those made up of mudstone are strongly associated with PCS in T/A Kilupula of KD. The results further show that houses made up of unburnt bricks are strongly associated with poor settlement conditions in Mtandire Ward of LC. Lack of construction materials has a strong relationship in T/A Kilupula of KD than in Mtandire Ward of LC. Similarly, CRF and AI have a strong relationship with house material type in Mtandire Ward of LC thereby contributing to high household flood vulnerability in LC.
In Table 13, the results revealed that sex is significant with social vulnerability factors (0.0539), physical vulnerability factors (0.0371), economic vulnerability factors (0.0562) and cultural vulnerability factors (0.0594) in KD while only environmental factors are significant with sex (0.0331) in LC. The result further revealed that marital status is significant with physical vulnerability factors in T/A Kilupula of KD (0.0265), environmental factors (0.0383) and economic factors (0.0497) in Mtandire ward of LC while in T/A Kilupula (0.0526) with cultural factors (Table 13). In terms of education, the results established that social factors (0.001), environmental factors (0.0064) and economic factors (0.0235) are significant to education in Mtandire ward of LC while economic factors (0.0378) are significant in T/A Kilupula of KD (Table 13). Finally, the results show that cultural factors (0.0075) and economic factors (0.0106) are significant to occupation in T/A Kilupula and Mtandire ward respectively (Table 13).
The results show positive and negative outcome of LOC in T/A Kilupula of KD and Mtandire Ward of LC respectively (Table 14). These results point to the fact that lack of capacity to cope contributes to household vulnerability in T/A Kilupula of KD than in Mtandire Ward of LC. The results further show that LAL and LS have positive values both in Mtandire Ward of LC and T/A Kilupula of KD, but with greater contribution to household flood vulnerability in Mtandire Ward of LC. Finally, the results reveal that AHS has positive and negative value in T/A Kilupula of KD and Mtandire Ward of LC. This result indicates that AHS contribute to household flood vulnerability in T/A Kilupula of KD compared to Mtandire Ward of LC (Table 14).
The results of ANN revealed that all the UVFs for economic factors have positive values in Mtandire Ward of LC and T/A Kilupula of KD, but with higher values in Mtandire Ward of LC. Lack of income generating activities was revealed to be higher both in Mtandire Ward of LC and T/A Kilupula of KD. These results imply that the NCU, LAL, PO and LGA contribute to household flood vulnerability in Mtandire Ward of LC and T/A Kilupula of KD (Table 15).
The results of geography linked with environmental factors reveal that there is strong relationship between them, all with a value greater than “0” in Mtandire Ward of LC compared to T/A Kilupula of KD (Table 15). The results show that poor land management (PLM) has strong network value (9.554) in Mtandire Ward of LC and (0.951) in T/A Kilupula of KD, followed by RPA in Mtandire Ward of LC (3.839). These results point to the fact that the CL, RPA, EMS, PLM and IUR contribute to households flood vulnerability in LC and KD, with higher contribution in Mtandire Ward of LC (Table 16).
The results of communication linked with cultural factors revealed a strong relationship between in the sets of the combined indicators, all with value greater than “0” in Mtandire Ward of LC compared to T/A Kilupula of KD (Table 16). The results show that traditional beliefs (TB) have strong network value (79.789) in T/A Kilupula of KD compared to a network value of 7.872 in Mtandire Ward of LC followed by cultural conflicts with value of 11.864 in T/A Kilupula of KD compared to a value of 6.426 in Mtandire Ward of LC (Table 17).
3.1.2 Relationships between vulnerability factors and components
This section combined underlying vulnerability factors (UVFs) and vulnerability components (VCs) to determine indicators that integrate the two parameters to determine households’ vulnerability. The analysis was carried through bivariate statistical test after normalisation of indicators of UVFs and VCs (Table 18). The results between physical factors and exposure variables reveals significant relationships between proximity to rivers and settlements (0.0380) in KD, house type (0.0001) in LC and roofing material (0.0072) in Lilongwe and (0.0364) in KD.. The results reveal that all the susceptibility factors are significant to social factors. This result indicates that the susceptibility variables contribute to generate households’ vulnerability to floods in Mtandire ward of LC and T/A Kilupula of KD. The results show that communication accessibility, access to healthcare, access to water, and sanitation contribute to vulnerability to floods in LC and KD are all significant at P-value 0.05 in both Mtandire Ward and T/A Kilupula (Table 16). The results reveal that all the resilience variables are significant to economic factors in KD while only income of household head is significant in LC. This result indicates the resilience variables contribute to generate households’ economic vulnerability to floods in T/A Kilupula district than in Mtandire Ward (Table 18). The results reveal that some exposure variables combined with environmental variables contribute to household’s flood vulnerability. While geography contributes to very high vulnerability of households to floods in T/A Kilupula of KD (0. 0084), the same is not the case in Mtandire Ward of LC (0.864). House type contributes to very high vulnerability of households to floods in Mtandire Ward of LC compared to T/A Kilupula in KD while roofing material contributes to generate vulnerability in both Mtandire Ward of LC and T/A Kilupula of KD (Table 17). The combined results of susceptibility variables with human/cultural factors reveal that communication accessibility contributes to flood vulnerability in Mtandire Ward of LC (0.0002) and not in T/A Kilupula of KD (0.5136). The results further indicate that limited education facilities as well as health facilities contribute to vulnerability in T/A Kilupula of KD and not in Mtandire Ward of LC at p-value 0.05 (Table 18).
3.2 Quantification and prediction of household vulnerability
The binomial Logit Multiple Regression was computed in r to generate five scores outlined in the Eqs. 12 to 15.
3.2.1 Computation of socio-susceptibility score
The underlying social vulnerability factors (SVFs) linked with communication accessibility (ca) in the susceptibility indicators generated the output of socio-susceptibility score (Eq. 12).
where S = Susceptibility, ca = communication accessibility, HR = human rights, HS = health services sint = scale of less important, svint = scale of very important.
The above output (Eq. 12) linked the susceptibility indicators (communication accessibility) with social variables. Therefore, to compute the scores in Lilongwe City (Mtandire Ward) and Karonga District (T/A Kilupula), the percentage values generated using descriptive statistics from the scale of “important” and “very important” were separately inputted in the equation (Eq. 12).
3.2.2 Computation of physio-exposure score
The underlying physical vulnerability factors (PVFs) linked with housing material types (hmt) in the exposure indicators generated the output of physio-exposure score (Eq. 13).
where E = Exposure, hmt = housing material type, PC = Poor construction, CM = Construction materials, CR = Construction of roads, sint = scale of less important, svint = scale of very important.
The output (Eq. 13) linked the exposure indicators (housing material type) with physical variables. Therefore, to compute the scores in Lilongwe City (Mtandire Ward) and Karonga District (T/A Kilupula), the percentage values generated using descriptive statistics from the scale of “important” and “very important” were separately inputted in the equation (Eq. 13).
3.2.3 Computation of eco-resilience score
The underlying economic vulnerability factors (EVFs) linked with income of household head (ihh) in the resilience indicators generated the output of eco-resilience score (Eq. 14).
where R = Resilience, ihh = income of household head, PV = Poverty, AL = Alternative livelihoods, sint = scale of less important, svint = scale of very important.
The output (Eq. 14) linked the resilience indicators (income of household head) with economic variables. Therefore, to compute the scores in Lilongwe City (Mtandire Ward) and Karonga District (T/A Kilupula), the percentage values generated using descriptive statistics from the scale of “important” and “very important” were separately inputted in the equation (Eq. 14).
3.2.4 Computation of enviro-exposure score
The underlying environmental vulnerability factors (EVFs) linked with geography (ge) in the exposure indicators generated the output of enviro-exposure score (Eq. 15).
where E = Exposure, Ge = Geography, CL = Cultivated land, EM = Environmental mismanagement, PLM = Poor land management, AUR = Inappropriate use of resources, sint = scale of less important, svint = scale of very important.
The output (Eq. 15) linked the exposure indicators (geography) with environmental variables. Therefore, to compute the scores in Lilongwe City (Mtandire Ward) and Karonga District (T/A Kilupula), the percentage values generated using descriptive statistics from the scale of “important” and “very important” were separately inputted in the equation (Eq. 15).
3.2.5 Computation of cultural-susceptibility score
The underlying cultural vulnerability factors (CVFs) linked with inaccessibility of communication (ic) in the susceptibility indicators generated the output of cultural-susceptibility score (Eq. 15).
where S = Susceptibility, cb = cultural behaviour, LN = local norms, sint = scale of less important, svint = scale of very important.
The output (Eq. 16) linked the susceptibility indicators (cultural behaviour) with cultural variables. Therefore, to compute the scores in Lilongwe City (Mtandire Ward) and Karonga District (T/A Kilupula), the percentage values generated using descriptive statistics from the scale of “important” and “very important” were separately inputted in the equation (Eq. 16).
The score measure of UVF (physical, social, economic, environmental and cultural) against VCs (exposure, susceptibility and resilience) generated a single value according to the association which was as follows: Physical with exposure factors (PEFs), Social with susceptibility factors (SSFs), economic with resilience factors (ERFs), environmental with exposure factors (EEFs) and cultural with susceptibility factors (CSFs). This association further generated value that was divided by the total sample size 345 and 200 household participants in Lilongwe City and Karonga District and multiplied by the 100 percent to obtain a percentage value of each category in the calibrated formula, for example:
Then the percentage result obtained in equation (Eq. 17) for each factor was further divided by 100% to generate the vulnerability level (extent of vulnerability) of each factor (i.e., VLPEFs). This computed arbitrary value was compared to the FVI to predict the extent of vulnerability per factor, for example:
where VLPEFs means the extent (level) of vulnerability to Physio-Exposure factors. This formula was applied to all the combined categories (i.e., SSFs, ERFs, EEFs and CSFs) by substituting the category that was required to be worked out in the equation to obtain the value that was used to determine vulnerability. Finally, the result was used to predict vulnerability in terms of “high vulnerability” and “very high vulnerability” per the FVI scale range. Ordinal categories for the indicators of vulnerability determinants (less important, important and very important) and indicators of elements at risk (not vulnerable, small vulnerable, vulnerable, highly vulnerable and very highly vulnerable) were used for selection of variables.
Finally, the relationship (using Eq. 18) generated results in the category of the physio-exposure factors (PEFs), social susceptibility factors (SSFs), eco-resilience factors (ERFs), enviro-exposure factors (EEFs) and cultural-susceptibility factors (CSFs) (Fig. 8).
The results of PEFs fall in scale range of “vulnerability” in Mtandire Ward of Lilongwe City (0.52) compared to “high vulnerability” in T/A Kilupula of Karonga District (0.64). This means that while it contributes to vulnerability in both areas, it is much higher in T/A Kilupula of KD compared to the Mtandire ward of LC. The results of the digitized flood maps overlayed with surveyed households’ showed that most houses that are highly vulnerable to floods are between a distance of 0.06–0.12 km to Lingadzi river in Mtandire ward of LC and 0.198–0.317 km along the buffer zones of Lufilya river in T/A Kilupula of KD (Figs. 9 and 10).

Map of Mtandire showing households/buildings about Wetlands and drainage systems

Map of T/A Kilupula showing households/buildings about Wetlands and drainage systems
4 Discussion
Though variations exist in the causes of vulnerability, the results of this study have demonstrated that the vulnerability of households to floods in rural and urban informal settlements is very high based on a lack of building materials, proximity to catchments, and limited communication among other factors. Similar, to this finding Alam et al., (2022) also found a high vulnerability value of 0.7015 for rural people living in the Dammar Char in Southeastern Bangladesh compared to urban areas. While, Alam et al. (2022), did not specify the causes of such high vulnerability, this study attributes the high vulnerability to the aspect of lack of construction materials, distance to markets and transport cost that people have to incur to access construction materials in rural areas. These causes agree with the findings of Qasim et al. (2016) in which vulnerability to flooding was attributed to poor/lack of materials used to construct houses. The results also revealed that poor construction of infrastructural facilities falls in the scale of “high flood vulnerability in both LC and KD. This implies that substandard construction of infrastructure such as houses contributes to vulnerability. This finding is supported by literature that substandard infrastructures contribute to flood vulnerability (Salami et al. 2017). Furthermore, the ANN results in MLP revealed a strong association of physical vulnerability factors (lack of construction materials, construction of infrastructures, and ageing infrastructures) with housing type. This implies that they contribute to generating vulnerability because people live in substandard houses. This finding confirms the result finding of Movahad et al. (2020) and Aliyu Baba Nabegu (2018) who indicated that people are vulnerable to floods because they usually live in substandard housing conditions which become prone to floods.
The SFFs generated a vulnerability value (0.61) for people living in T/A Kilupula in Karonga District compared to a low vulnerability value (0.2) for people living in Mtandire Ward in Lilongwe City. The above findings indicate that key factors for households’ flood vulnerability are associated with knowledge of building codes and standards. This means that the culture of shelter safety is lacking and that there is a lack of knowledge of the type of houses that they can build to resist floods and any other type of natural hazards. These could be attributed to dynamic pressures influencing households’ vulnerability to floods. That’s to say, people do have enough resources, decision-making, and societal skills to access housing materials that can help them build strong houses. In this situation, the programming of flood risk management and in general DRM mitigation, preparedness and recovery measures should focus on reducing the pressures by strengthening households’ knowledge and building standards. This can be achieved through designing mitigation measures that address the root causes that contribute to increased vulnerabilities in the pre-flood and post-flood phases rather than focusing too much on the trans-flooding phase. In terms of social-susceptibility vulnerability, the results found that the SSFs that contribute to generating vulnerability both in T/A Kilupula of KD and Mtandire Ward of LC are lack of access to health services, human rights, limited institutional capacities and lack of awareness. However, the binomial logistical regression of the SFFs generated a vulnerability value (0.61) for people living in the studied area of KD compared to a low vulnerability value (0.2) of people living in the studied area of LC. This finding differs from the findings of Munyai et al. (2019) in Muungamunwe Village in South Africa, which found that the value of FVI social was 0.80 higher than all the factors assessed. However, it is noted that the later study did not comprehensively link various factors between UVFs and VCs to determine the degree of contribution to vulnerability. The results further imply that the socio-susceptibility factors contribute to higher vulnerability in rural areas than in urban areas. This finding is supported by the study of Mwale (2014) in which social susceptibility was categorised from “high to very high vulnerability” among the communities in rural Lowershire of Chikwawa and Nsanje Districts of Malawi.
The ERFs contribute to “very high vulnerability” in Karonga (0.8) and “high vulnerability” in Mtandire Ward of Lilongwe City (0.6). The high vulnerability is linked to factors such as poverty, lack of alternative livelihoods, and lack of income-generating activities. Similar to these results, the study of Mwale (2014) also established a predominantly very high economic susceptibility based on causes such as a lack of economic resources, an undiversified economy and a lack of employment opportunities among communities in the lower Shire Valley of Malawi. Despite the results revealing the same outcome, the earlier study linked economics with susceptibility measures while this study agglomerated economics with resilience measures. The existing variation placed some causes in different association order. For example, poverty in the study of Mwale (2014) was categorised as a social susceptibility indicator, while in this study it was used as the eco-resilience measure. The understanding of this study is that poverty is a measure of the income level of a household. That is to say, a household with enough income will be less poor thereby becoming more resilient and vice versa. Therefore, poverty was classified as a cause of “high vulnerability” both in Mtandire Ward of LC with a value of 0.73 and T/A Kilupula of KD with a value of 0.68. On the other hand, the lack of alternative livelihoods contributes to “vulnerability” in Mtandire Ward with a value of 0.54 while ‘high vulnerability” in T/A Kilupula with a value of 0.71). These findings point out the notion that programming current and future flood disaster mitigation plans and vulnerability reduction measures requires the formulation of relevant financial and economic measures which may contribute to poverty alleviation in the community and society.
The EEFs revealed “very high vulnerability” in both Mtandire Ward of LC (0.8) and T/A Kilupula of KD (0.9). The EEFs revealed “very high vulnerability” of EEFs (0.8) in Mtandire Ward and (0.9) in T/A Kilupula. Except for the pressure on cultivated land in Mtandire Ward, all underlying environmental vulnerability factors (UEVFs) contribute to vulnerability in both rural and urban areas. This result points out that pressure on land is an environmental indicator that predicts households’ vulnerability to floods in rural areas (T/A Kilupula) and not in urban areas (Mtandire Ward). The high vulnerability depicted by the EEFs is a total indication that households are more vulnerable due to the built environment. This could be attributed to the fact that people have allowed development in areas where danger exists due to the lack of policy and legal systems to help and guide government and enterprises in disaster risk management. This argument is supported by literature that development in dangerous areas increases peoples’ exposure to danger (Birkmann et al. 2013; Nazeer and Bork 2021). Barbier et al. (2012) support that environmental damage affects the well-being of the local people since it leads to soil degradation which eventually causes low food production. To this end, laws and policies to regulate development and habitation in risk areas should be seamlessly programmed into the current and future flood mitigation and preparedness plans at all levels.
Finally, the CSFs revealed a low vulnerability in both Mtandire Ward of LC (0.34) and T/A Kilupula of KD (0.39) (Fig. 6). In the FVI scale, the SSFs and CSFs contribute to low vulnerability in Mtandire Ward of LC while only the CSFs contribute to low vulnerability in T/A Kilupula of KD (Fig. 3). The CSFs show a value of 0.34 in Mtandire Ward and 0.39 in T/A Kilupula, indicating that it contributes to low vulnerability in both areas. However, it was established that household flood vulnerability in T/A Kilupula is high due to other factors such as cultural beliefs of conserving their ancestors’ graveyards and land ownership issues. In support of this result, Iloka (2017) found that a system of beliefs regarding hazards and disasters contributes to vulnerability. The findings of the author further established that cultural issues do not assist households to be resilient to floods. In Mtandire Ward of LC, it was observed that land use and human occupancy in risk areas contribute to household flood vulnerability. Furthermore, it was reported that rich people have occupied places which are not habitable thereby changing the course of the Lingadzi River. Further to this, youths have resorted to destroying the banks of the river due to a lack of economic activities and high unemployment. It was noted that people do not fear or abide by city regulations because there is no punishment that they receive from city councils.
4.1 FVA indicators for rural and urban informal settlements
Based on the results, and to provide proper flood mitigation and programming of current and future challenges in flood management, this study constructed the FVA framework as a combination of variables from the UVFs and VCs (Fig. 11). On the one hand, the physio-exposure indicators (PEIs) relate to the housing and infrastructure in the physical vulnerability factors (PVFs). These should be evaluated based on exposure with its operator house material and type to understand how they contribute to vulnerability (Eq. 13). In Fig. 11, those that intersect (housing typology (HT), poor construction of standards (PCS), lack of building materials (LBM) and loss of physical assets (LPA) and infrastructural standards) are the PEIs for both rural and urban areas. While location (LC) and growth of informal settlement (GIS) are PEIs for rural and urban areas respectively. On the other hand, the enviro-exposure indicators (EEIs) relate to environmental causes such as land use planning and management. These were quantified based on exposure variables, specifically location (Eq. 15). In the Fig. 11, environmental mismanagement (EM), proximity to rivers (PR), poor land management (PLM), inappropriate use of resources (IUR) and siltation of rivers (SR), river catchment morphology (RCM) flooding risk location (FRL) intersect, implying that they are the EEIs for both rural and urban informal areas. Those outside the intersection apply specifically as EEIs conforming either in Lilongwe including waste management (WM), land use planning (LUP) or in Karonga, cultivated land (CL) and topography (TP).

FVA framework
This study derived the physio-exposure indicators (PEIs) and enviro-exposure indicators (EEIs) by agglomerating them with the exposure factors (housing material and geography respectively). This demonstrates the notion that flood risk is a product of exposure to the hazard (flood) and vulnerability. Literature reveals that exposure entails the probability of flooding affecting physical objects-buildings and people (Mwalwimba 2024; Balica et al. 2012; Nazeer and Bork 2021) due to location. Since location is an exposure variable, defined by the geographical position to which the assessment was done (Nazeer et al. 2022), this study relates the physical causes to that location/geography to predict household vulnerability and thereby all the significant indicators were grouped as physio-exposure factors (PEFs) to give rise to the PEI. Also, significant indicators were grouped as enviro-exposure factors (EEFs) and referred to as the EEIs in Fig. 11. The PEIs and EEIs correlate with the indicators propagated in the hazard of place model (Joakim 2008), which relates the vulnerability determinates to biophysical vulnerability i.e. geography, location and proximity.
The amount of social risk experienced by the household was understood by agglomerating socio-susceptibility indicators (SSIs). The SSIs relate to the linkage of social causes with access to communication as a susceptibility variable (Eq. 12). Susceptibility deals with elements that influence an individual or household to respond to the hazard itself. In Fig. 11, the SSIs, lack of access to health services (LHS), communication accessibility (CA), access to training and advocacy (ATA) and level of sanitation (LS) are indicators that intersect, implying they apply to both rural and urban informal areas. However, lack of human rights (LHR) and level of waste management and drainage systems (LWDS) are SSIs in rural and urban respectively. Relatedly, cultural-susceptibility indicators (CSIs) link cultural causes with access to communication in the susceptibility category. Susceptibility deals with elements that influence an individual or household to respond to the hazard itself. In Fig. 11, lack of personal responsibility, lack of adherence to regulations, lack of institutional support and flood perception are indicators that intersect, implying that they are the CSIs for both rural and urban areas. However, cultural beliefs and myths about floods should be indicators to be evaluated specifically in rural areas, while power conflicts, limited DRR strategies and lack of cooperation should be used to assess vulnerability in urban areas, though they can apply to rural areas too. So, access to communication is a susceptibility condition which may result in making households vulnerable to floods because they cannot anticipate the impending flooding. Hence this study related social and cultural causes with access to communication to develop a combination of socio-susceptibility factors (SSFs) and cultural-susceptibility factors (CSFs). Qasim et al. (2016) stated that certain beliefs and poverty play a role in the lack of resilience among communities. Birkmann et al. (2013) and Kablan et al. (2017) stated that susceptibility relates to the predisposition of the elements at risk in social and ecological spheres. Hence, most of the susceptibility factors relate to social and cultural causes because they are all an integral part of humanity's suffering if conditions do not support them to withstand and resist the natural hazard impacts.
The eco-resilience indicators (ERIs) should put much emphasis on economic causes of vulnerability. Economic indicators such as limited access to alternative livelihoods and poverty contribute to generating vulnerability. These indicators may or may not be affected by the resilience of households to the shock. As such, resilience is measured based on the ability of the households to cope with the event. As such, key factors to measure resilience include access to resources, improved livelihoods and access to income among others. The framework therefore strongly overlaps economic causes with resilience factors to assess the vulnerability of households to floods. In Fig. 11, poverty (PO), limited livelihoods (LVs), lack of income of household head (LIHH), and loss of economic assets (LEA) are indicators that intersect, implying that they are eco-resilience indicators (ERIs) that can be used for vulnerability assessment in both rural and urban areas. The ERIs for only rural lack of markets (LM), limited credit unions (LCU) and reduction in agricultural land (RAL) while in urban informal settlements, they include lack of employment opportunities (LEO). Birkmann et al. (2013) stipulated that resilience comprises pre-event risk reduction, time-coping, and post-event response actions. Therefore, this study relates the economic causes of resilience to give rise to the eco-resilience indicators (ERIs) (Fig. 11).
The adaptive capacity provides key adaptive measures that can be incorporated to deal with vulnerability conditions generated from each intersected category. The adaptive measures relating to housing strategies can be utilised to minimised flood impact on households under the physio-exposure factors in the category of the PEIs are strengthening the availability of building materials (SULBM), enforcement of building codes and standards (EBCS) and empowering locals on flood resilient structures (ELFRS). Similarly, social organisational measures can be utilised to minimise socio-susceptibility factors relating to SSIs. The adaptive capacities that can contribute to reducing vulnerability in the category are the ability to make decisions (AMD), the ability to organise and coordinate (AOC) and communal strategic grains for resilient buildings (CSGRB). In addition, the economic measures can be utilised to minimise flood impacts relating to eco-resilience factors for the category of ERIs and they include saving agricultural produce (SAP), strengthening diversification (SD) strengthening livelihoods opportunities (SLO) can be used as adaptive capacity under this category. In terms of exposure, households to adapt to flood impact can use land management measures. These practices include: elevating house location (EHL), afforestation and re-afforestation (AR) and building dykes and embankments (BDE) can be used as adaptive capacity under this category. Finally, households can minimise the cultural-susceptibility factors that generate their vulnerability through the application of warning systems for impending flooding (WS) and the use of indigenous and scientific knowledge (ISK). This is contrary to the PAR model (Wisner et al., 2004) and Urban Flood Vulnerability Assessment (Salami et al. 2017), which did not elaborate the adaptive strategies. However, the FVA relates well with the ISDR framework (2004) on adaptive capacity because the ISDR (2004) emphasizes disaster risk reduction through adaptive responses such as awareness knowledge, development of public commitment, application of risk reduction measures, early warning and preparedness (Mwale 2014).
5 Assumptions of the FVA framework
Assumptions are key to the realisation of the results. They are critical for achieving the successful implementation of an intervention. In this regard, the fact that the FVA framework provides the indicators which can be used to assess flood vulnerability in rural and urban informal settlements, the following eleven assumptions are vital to achieving the results:
-
1.
The UFV should be constituted by physical, social, economic, environmental and cultural factors while the VC is composed of exposure, susceptibility and resilience to determine flood vulnerability. The selection of variables for these key components should consider vulnerability in a combination of physical and social sciences.
-
2.
The UVFs and VCs should be linked to generate Physio-Exposure Factors (PEF), Socio-Susceptibility Factors (SSF), Eco-Resilience Factors (ERF), Enviro-Exposure Factors (EEF) and Cultural-Susceptibility Factors (CSF) to determine flood vulnerability or any particular hazard.
-
3.
The generated indicators in the PEF, SSF, ERF, EEF and CSF should lead to the production of physio-exposure indicators (PEIs), social susceptibility indicators (SSIs), eco-resilience indicators (ERIs), enviro-exposure indicators (EEIs) and cultural-susceptibility indicators (CSIs), which in turn should capture indicators for FVA framework (Fig. 11).
-
4.
A comprehensive flood vulnerability assessment framework that can give rise to multi-hazard vulnerability assessment should deviate from the common systematisations of vulnerability by using one set of variables. A combination of UVFs and VCs should be used to generate a wide range of issues and variables.
-
5.
The linkage between the factors that amplify vulnerability and those that can enhance vulnerability reduction should be demonstrated through adaptive capacity and disaster risk reduction measures and incorporated in the framework. Those that cannot be quantified should be supported by qualitative methods.
-
6.
The linkage of the UVFs and VCs as a key explanation of the generation of vulnerability should be emphasised and the conceptual framework for FVA should provide clear connectivity of the variables of the UVFs and VCs.
-
7.
The variables for UVFs (physical, social, economic, environmental and cultural) should be measured as the absolute proportion value of household participants involved during the survey. The percentage values should be generated using a scale range with operators of “less important”; “important” and “very important” to contribute to flood vulnerability”. However, for flood vulnerability determination, a cut-off point should be placed at greater or equal to 0.5 (50%) for each indicator from the operator of the scale range of “important” and “very important”. In this case, all the values generated in the scale of “less important” as responded by the participants should be left out during determination of flood vulnerability.
-
8.
The selected variables UVFs indicators (at 50%) should be tested using the variables of VCs (exposure, susceptibility and resilience) in the order stipulated in 2 and 3 through statistical tests using P-values or correlation (r) or simply any statistical test applicable by the researcher. The values that are significant at a certain confidence level (i.e. 0.05 in this study) should be selected to be included in the framework for specific combinations like PEFs, SSFs, ERFs, EEFs and CSFs (Fig. 11). Furthermore, those values significant at an appropriate confidence level should be considered as factors generating flood vulnerability.
-
9.
Household vulnerability to floods should be predicted based on logistical regression test between the UVFs for all the operators of less important, important and very important and the VCs indicators (in exposure, susceptibility and resilience). The selection of the VC indicators should be based on those that were significant during the statistical test. Furthermore, variance independent factor (VIF) should be used to check the multicollinearity of the indicators for computation in the regression model.
-
10.
Demographic characteristics should be statistically tested to determine their significant level of P-value 0.05 with the underlying vulnerability factors (UVFs) to explain who is vulnerable to what. However, because other explanations might be hidden in a quantitative assessment, a qualitative –in-depth assessment must be done to understand those hidden issues per se. In so doing, the assessment would be informative in identifying the factors that give rise to the pressures that generate vulnerable conditions in society for different groups.
-
11.
Adaptive capacity should be assessed both quantitatively and qualitatively since it is a component of vulnerability reduction. This entails that if adaptive capacity is sufficient, it is likely that households' response to floods would be high and vulnerability is also likely to reduce and vice versa.
5.1 FVA application and comparability
The FVA should be applied as a pre-hazard, trans-hazard and post-hazard (flood) tool. In the pre-hazard category, all the proposed indicators should be used to determine vulnerable conditions which may (or may not) put some households at risk of flood disaster in the event of a flood occurrence. In the trans-hazard, the FVA indicators should be used to determine the vulnerabilities of households to identify the households that have been affected by floods as part of the disaster response and recovery process. In so doing, the FVA indicators should be used as a means of establishing strategies for disaster response and recovery as part of building back better. As a post-hazard tool, indicators should be used to determine the vulnerabilities that contributed to a disaster situation. Users should prioritize these indicators as a means of building DRR for disaster rehabilitation and reconstruction. In this case, the FVA framework contrasts itself to available tools such as the Unified Beneficiary Register (UBR) and Hazard Rapid Assessment (HRA) which largely are implemented only after the hazard in Malawi. Furthermore, it separates indicators that generate vulnerability in subsectors, but most available frameworks do not portray this separation. Therefore, participating enterprises can implement the FVA framework based on the needs of the assessment. The FVA framework can be implemented through hydrological assessment, flood modelling, quantitative, qualitative, GIS and remote sensing methodologies, giving opportunity to multiple users. The framework emphasizes UVFs (physical, social, economic, environmental and cultural) and VCs (exposure, susceptibility and resilience) as intersection constructs of flood vulnerability in urban and rural areas of Malawi and other places where it can be applied. It provides very simplified indicators of assessing flood vulnerability at local and national levels, deviating from the generalised frameworks that look at a wider scale like the PAR model (Wisner et al., 2004). More importantly, the framework provides tailor-made indicators thereby localizing the assessment of flood vulnerability in Malawi. This framework gives indicators that can be easily measured and evaluated at any level using different tools (statistical applications) thereby giving empirical scientific data on floods. The framework is coined strategically for researchers to utilise it in measuring the vulnerability of a single underlying factor of interest (i.e., physical vulnerability or social vulnerability etc.). It also gives simplified indicators that can be utilised by policy and decision-makers for planning interventions. The framework provides a good alignment of adaptive capacity to underlying vulnerability factors and components. In this case, the framework integrates DRR into vulnerability reduction strategies. Unlike the PAR model (Wisner et al., 2004) which does not explain exactly the measures of vulnerability reduction, this framework, through the integration of adaptive capacity, has filled up this gap. Finally, the framework intersects the significant factors of vulnerability in a set theory analysis giving new thinking in outlining FVA indicators in Malawi and beyond. The framework goes beyond the Community-Based Disaster Risk Index (CBDRI) by Bollin et al. (2003) which provides a proper link of indicators between vulnerability factors and components. For example, the CBDRI considers vulnerability components as structure, population, economy, environmental and capacity measures (Mwale et al. 2015) yet alone these could be grouped as conditions that generate flood vulnerability as tested in the FVA framework.
From the findings of this study, the FVA is comparable with various contemporary disaster management frameworks such as the PAR Model (Wisner et al. 2014), the Hazard of Place Framework (Cutter 1996), the Sustainable Livelihood Model (2004), the Community-based Disaster Risk Management Model (Kelman 2010), Turner et al. (2003) framework and the International Disaster Risk Reduction Framework (ISDR 2004). Therefore, based on the indicators intersected in Fig. 11 (such as housing conditions, access to information, access to resources, poor land use, social networks, and location), the FVA framework correlates well with most of the indicators stipulated in Hazard of place model (Cutter 1996), PAR model (Winser et al. 2014), Urban Flood Vulnerability Assessment Framework (Salami et al. 2017), ISDR framework (2004). However, the FVA framework has provided simplified indicators of flood vulnerability assessment because the indicators are simple to be used by experts and non-experts whether they are in urban or rural areas. They can be easily understood by ordinary users and policymakers. Furthermore, the indicators can be used for multi-hazards vulnerability assessment, since the H and F in the constituted equation can be changed based on hazard. In this case, the FVA Framework is widening vulnerability assessment beyond a focus on floods. The FVA, therefore, eliminates the gaps that most studies in literature mainly focus on, single hazards, ignoring the multi-hazard assessment (Kamanga et al. 2020). The FVA includes variables that can be measurable through quantitative and ANN (machine learning platform) thereby expanding the process of vulnerability analysis.
The FVA separated the indicators that generate vulnerability in different subsectors of UVFs and VCs. This separation deviates from most of the contemporary frameworks. Joakim (2008) noted that most contemporary frameworks fail to portray the linkages and networks that exist with the layers or sections leading to the vulnerability. For example, the PAR (Wisner et al. 2014) model provides a generalised causation of vulnerability. It portrays the progression of vulnerability from root causes to unsafe conditions, but it fails to explicitly acknowledge the linkages that exist within each progression (Joakim 2008). The FVA has provided a straightforward linkage of indicators by systematizing and assessing vulnerability in different subsectors. Similarly, the International Strategy for Disaster Reduction (ISDR) (2004) framework, the Hazard of Place Framework (HOP) (Cutter 1996), Borgardi, Birkmann and Cadona (BCC) (2004) and the Turner et al. (2003) framework, all have methodological difficulty of translation of some concepts into practice (Mwale 2014). This methodological variation, further makes the contemporary frameworks to be difficult to incorporate different links that exist between vulnerability factors. Mwale (2014) argues that the HOP framework does not provide a causal explanation of the vulnerability, instead variables are selected the way they are. Joakim (2008) further noted that the applicability of the HOP framework is a Canadian context, giving an impression that some indicators might manifest themselves differently in small political, economic and social processes. However, the HOP framework in some instances, relates very well with FVA, particularly the inclusion of perceptions, emphasis on understanding the underlying vulnerability factors, and inclusion of mitigation and adaptive capacity in the analysis of vulnerability. It is also highlighted that Turner II et al.’s (2003) framework is too theoretical and lacks specificity (Mwale 2014). This means that the framework is not simple and easy to use. The ISDR (2004) does not link the preparedness response system and thereby not explicit on how vulnerability can be reduced. Also, the use of one-dimensional indicators is demonstrated in the Turner II et al. (2003) framework which defines vulnerability in terms of exposure, susceptibility and responses. For this part, the ISDR (2004) defines vulnerability in the realms of social, economic, environmental and physical (Mwale 2014), missing the aspects of exposure, susceptibility and resilience. Above all, most of these frameworks have neglected to agglomerate the UVFs and VCs in their analysis and development of vulnerability frameworks. These FVA have attempted to fill these gaps, giving vulnerability assessment a new direction. In Malawi and SSA in general, Mwale et al. (2015) in a study of contemporary disaster management framework quantification of flood risk in rural lower Shire Valley, Malawi found medium, high and very high flood vulnerability in the same construct of indicators of the FVA framework. This implies that the FVA indicators are locally comparable and can be used for the decision-making process. The FVA indicators are more practical and can ably enhance community and household resilience. These indicators can thus be applied in promoting the resilience of communities to mitigate flood risks and key components for planning and decision-making processes.
6 Conclusion
This study carried out flood vulnerability assessment (FVA) using quantitative methods by utilising MCA, ANN (machine learning) and multiple logistical regression. The high flood vulnerability and lack of adaptive capacity among the households and communities in rural and urban informal settlements is an indication that catchment management in most areas remains a challenge to the water sector, disaster professionals and other players. This study highlights place settlement (proximity to catchments), low-risk knowledge, limited access to communication, poor sanitation, limited institutional capacity, and lack of alternative livelihoods as key drivers of flood vulnerability. These, among others, prevent households near the catchments from living in harmony and at peace with their water resources catchments. As the FVA framework specifies the indicators that contribute to flood vulnerability in rural and urban informal settlements, it is important to consider shifting towards investing in the adaptive capacity of communities along the catchments for better resilience building. The FVA framework considered adaptive capacity to mean actions taken by households to manage their catchments and livelihoods before, during and after floods. The adaptive measures entail the level of resilience households would be (or would not be) to floods. This study considered it crucial to constitute this framework in this manner to provide a roadmap for identifying the underlying causes of household levels of vulnerability to floods. This flood vulnerability assessment framework is applicable for both rural and urban and could be fit for purpose in sectors such as climate change, water resources management, disaster risk management, disaster risk reduction, integrated water management, food security, health, environmental management, engineering etc. The government might find the framework significant to establish clear regulations and accountability mechanisms to ensure that their involvement genuinely contributes to sustainable and equitable outcomes. Enterprises would find the framework useful for mapping vulnerability to natural hazards to address current and future risks in communities, including building community resilience and a line of separation with government.
7 Recommendations
The FVA framework is the first attempt to agglomerate operators in the UVFs and VCs through a multicollinearity analysis in a logit multiple regression to give rise to indicators in the PEIs, SSIs, ERIs, EEIs and CSIs for flood vulnerability assessment. The framework emphasises both understanding the conditions that generate vulnerability and those that can reduce vulnerability. Therefore, the study emphasises that the Malawi government through the Department of Disaster Management Affairs (DODMA) should strengthen disaster risk reduction by maintaining (1) political responsibility through the formulation of public policies with a clear understanding of people’s vulnerabilities (2) Legal responsibility through incorporating the framework as a way of perfecting the legal system, enforce the laws and establish laws that are not a centric symbol of disaster enterprise (3) Social responsibility through applying the framework to harmonise systems to be fair and just, without treating others in a sense of societal leniency, greenwashing practices and prioritisation of profit over environmental and social responsibility (4) Economic responsibility through utilising the framework to formulate relevant financial and economic measures i.e. disaster risk funds, to make disaster funds not to base on the declaration of a disaster.
Similarly, mapping vulnerability to natural hazards in urban areas should be enhanced to provide data necessary for developing disaster risk awareness and communication strategies vital to strengthening urban risk knowledge of natural hazards. The framework should be applied in promoting the resilience of communities to mitigate flood risks and can be a key component for planning and decision-making processes both in rural and urban areas. Finally, this study focused on one rural area and one urban informal area, so there is a need for district-wide or city-wide study and/or there is a need for study in urban between planned settlement and unplanned traditional housing areas (UTHA).
References
Abass K (2018) Household vulnerability and adaptation to floods: a comparative study of rural and urban Ghana (PhD thesis). Kwame Nkrumah University of Science and Technology, Kumasi, Ghana
Ahmadi H (2015) Bangladesh coastal zone management status and future trends. J Coast Zone Manag 22(1):1– 7
Alam I, Khan SM, Salam R (2022) Vulnerability assessment based on household views from the Dammar Char in Southeastern Bangladesh. Nat Hazards 113(1):329–334
Anwana EO, Oluwatobi MO (2023) Analysis of flooding vulnerability in informal settlements literature: mapping and research agenda. Social Sci 12:40. https://doi.org/10.3390/socsci12010040
Balica SF, Wright NG, Van Der Meulen F (2012) A flood vulnerability index for coastal cities and its use in assessing climate change impacts. Nat Hazards 64(1):73–105
Birkmann J, Cardona OD, Carreño ML, Barbat AH, Pelling M, Schneiderbauer S, Welle T (2013) Framing vulnerability, risk and societal responses: the MOVE framework. Nat Hazards 67(2):193–211. https://doi.org/10.1007/s11069-013-0558-5
Chawawa NE (2018) Why do smallholder farmers insist on living in flood prone areas? Understanding self-perceived vulnerability and dynamics of local adaptation in Malawi. Ph.D. Thesis, School of Geosciences University of Edinburgh
Cutter SL (1996) Vulnerability to environmental hazards. Prog Hum Geogr 20(4):529–539
De Risi R, Jalayer F, De Paola F et al (2013) Flood risk assessment for informal settlements. Nat Hazards 69:1003–1032. https://doi.org/10.1007/s11069-013-0749-0
Fisher A, Laing J, Stoeckel J (2010) Handbook for family planning operation research design. Population Council
Hodgkins GA, Whitfield PH, Burn DH, Hannaford J, Renard B, Stahl K, Fleig AK, Madsen H, Mediero L, Korhonen J et al (2017) Climate-driven variability in the occurrence of major floods across North America and Europe. J Hydrol 552:704–717
Iloka NG (2017) Perception of ethnicity, local knowledge and sustainable livelihoods in relation to DRR. The Case of Nsukka in South-East Nigeria. Ph.d. thesis, University of Northumbria, Newcastle
Informal Settlements Literature: Mapping and Research Agenda. Soc Sci 12(1):40. https://doi.org/10.3390/socsci12010040
Joakim E (2008) Assessing the hazard of place model of vulnerability. A case study of Waterloo Region. MSc., thesis. Retrieved from https://www.researchgate.net/publication/254728595
Kablan MK, Dongo K, Coulibaly M (2017) Assessment of social vulnerability to flood in urban coted’ivoire using the move framework. Water 9(292):1–19. https://doi.org/10.3390/w9040292
Kamanga T, Tantanee S, Mwale FD, Buranajararukorn P (2020) A multi-hazard perspective in flood and drought vulnerability: a case study of Malawi. Geogr Tech 15(1):132–142
Karagiorgos K, Thaler T, Hubi J, Fuchs S (2016) Multi-vulnerability analysis for flash flood risk management. Retrieved from https://doi.org/10.1007/s11069-016-2296-y
Kelman I (2010) Climate change and the sendai framework for disaster risk reduction. Int J Disaster Risk Sci 6(2):117–127
Kissi AE, Abbey GA, Agboka A, Egbendewe A (2015) Quantitative assessment of vulnerability to flood hazards in downstream area of Mono Basin, South-Eastern Togo: Yoto district. J Geogr Inf Syst 7(6):607–619
Kundzewicz ZW, Su B, Wang YJ, Wang GJ, Wang GF, Huang JL, Jiang T (2019) Flood risk in a range of spatial perspectives—from global to local scales. Nat Hazards Earth Syst 19:1319–1328
Manda MZ, Wanda E (2017) Understanding the nature and scale of risks in Karonga Town, Malawi. Environ Urban 29(1). http://journals.sagepub.com/home/eau
Moreira LL, De Brito MM, Kobiyama M (2021) Review article: a systematic review and future prospects of flood vulnerability indices. Nat Hazard 21(5):1513–1530
Munyai RB, Musyoki A, Nethengwe NS (2019) An Assessment of flood vulnerability and adaptation: a case study of Hamutsha Muungamunwe village, Makhado municipality. Jàmbá J Disaster Risk Stud 11(2):a692. https://doi.org/10.4102/jamba.v11i2.692
Mwale F (2014) Contemporary disaster management framework quantification of flood risk in rural lower Shire Valley, Malawi. Ph.d. thesis, Heriot-Watt University, Scotland
Mwale FD, Adeloye AJ, Beevers L (2015) Quantifying vulnerability of rural communities to flooding in SSA. Int J Disaster Risk Reduct 12:172–187
Mwalwimba IK (2020) Assessing vulnerability trends and magnitudes in light of human responses to floods in Karonga District, Malawi. Int JSci Res 9(4)
Mwalwimba IK (2024) Measuring vulnerability to assess households resilience to flood risks in Karonga District, Malawi. Nat Hazards. https://doi.org/10.1007/s11069-06416-4
Nazeer M, Bork H-R (2019) Flood vulnerability assessment through different methodological approaches in the context of North-West Khyber Pakhtunkhwa, Pakistan. Sustainability 11(23):6695. https://doi.org/10.3390/su11236695
Nazeer M, Bork HR (2021) A local scale flood vulnerability assessment in the flood prone areas of Khyber Pakhtunkhwa. Pak Nat Hazards 105(1):755–781. https://doi.org/10.1007/s11069-020-04336-7
Nong D, Sathyna AR (2020) Vulnerability assessment of households to floods and landslides in the upper region of Vietam
Oyedele P, Kola E, Olorunfemi F, Walz Y (2022) Understanding food vulnerability in local communities of Kogi State, Nigeria, using an index-based approach. Water (switzerland) 14(17):234. https://doi.org/10.3390/w14172746
Parvin F, Ali SA, Calka B, Bielecka E, Linh NTT, Pham QB (2022) Urban flood vulnerability assessment in a densely urbanized city using multi-factor analysis and machine learning algorithms. Theoret Appl Climatol 149(1–2):639–659
PDNA (2015) Post disaster need assessment
PDNA (2019) Post disaster need assessment
Qasim S, Qasim M, Shrestha RP, Khan AN, TunK AM (2016) Community resilience to flood hazards in Khyber Pakhtunkhwa province of Pakistan. Int J Disaster Risk Reduct 18:100–106. https://doi.org/10.1016/j.ijdrr.2016.03.009
SEP (2017) District Social Economic Profile (SEP-2017). Lilongwe
UNISDR (2017) United Nation International Strategy for Disaster Risk
Wisner B, Blaikie P, Cannon T, Davis I (2004) At risk: natural hazards, people’s vulnerability and disasters. Routledge, London
Wisner B, Blaikie P, Cannon T, Ian D (2014) The challenge of disasters and our approach. In: At risk: natural hazards, people’s vulnerability, and disasters. Routledge
Wright G, Adeloye A, Duncan M, Mwale F (2017) Community based-flood risk management: experiences and challenges in Malawi. Int Water Resour Assoc (IWRA)
Funding
The publication of this research received financial support from the NORHED Project on Climate Change and Ecosystem Management in Malawi and Tanzania (#63826) and the Centre for Resilient Agri-Food Systems (CRAFS) under the Africa Centres of Excellence (ACE2) programme.
Author information
Authors and Affiliations
Corresponding author
Ethics declarations
Conflict of interest
The authors declare that they have no known conflict of interest or any kind of influence and relationships that could jeopardize the work reported in this article.
Ethical issues
Ethical approval was sought from the Mzuzu University Research Ethics Committee (MZUNIREC). The MZUNIREC Permission was submitted to the Karonga District Council (KDC) and Lilongwe City Council (LCC). Participants were assured of confidentiality.
Additional information
Publisher's Note
Springer Nature remains neutral with regard to jurisdictional claims in published maps and institutional affiliations.
Rights and permissions
Open Access This article is licensed under a Creative Commons Attribution 4.0 International License, which permits use, sharing, adaptation, distribution and reproduction in any medium or format, as long as you give appropriate credit to the original author(s) and the source, provide a link to the Creative Commons licence, and indicate if changes were made. The images or other third party material in this article are included in the article's Creative Commons licence, unless indicated otherwise in a credit line to the material. If material is not included in the article's Creative Commons licence and your intended use is not permitted by statutory regulation or exceeds the permitted use, you will need to obtain permission directly from the copyright holder. To view a copy of this licence, visit http://creativecommons.org/licenses/by/4.0/.
About this article

Cite this article
Mwalwimba, I.K., Manda, M. & Ngongondo, C. Flood vulnerability assessment in rural and urban informal settlements: case study of Karonga District and Lilongwe City in Malawi. Nat Hazards 120, 10141–10184 (2024). https://doi.org/10.1007/s11069-024-06601-5
Received:
Accepted:
Published:
Issue Date:
DOI: https://doi.org/10.1007/s11069-024-06601-5