
Abstract
GIS-based multicriteria evaluation (MCE) provides a framework for analysing complex decision problems by quantifying variables of interest to score potential locations according to their suitability. In the context of earthquake preparedness and post-disaster response, MCE has relied mainly on uninformed or non-expert stakeholders to identify high-risk zones, prioritise areas for response, or highlight vulnerable populations. In this study, we compare uninformed, informed non-expert, and expert stakeholders’ responses in MCE modelling for earthquake response planning in Vancouver, Canada. Using medium- to low-complexity MCE models, we highlight similarities and differences in the importance of infrastructural and socioeconomic variables, emergency services, and liquefaction potential between a non-weighted MCE, a medium-complexity informed non-expert MCE, and a low-complexity MCE informed by 35 local earthquake planning and response experts from governmental and non-governmental organisations. Differences in the observed results underscore the importance of accessible, expert-informed approaches for prioritising locations for earthquake response planning and for the efficient and geographically precise allocation of resources.
1 Introduction
Between 1980 and 2018, there were 1397 deadly earthquakes on Earth, causing an estimated 822,499 deaths and economic losses of US$ 935bn (Münchener Rückversicherungs-Gersellschaft 2019). Of those events, 115 (8%) were classified as catastrophic, accounting for 98% of the total deaths and 94.6% of the total economic loss in this time period (ibid).
Given the high loss of life and damage in catastrophic events, many governmental organisations in high-risk areas have sought to develop, improve, and implement major earthquake preparedness and response plans. Priorities of response efforts in the event of a major earthquake are to rapidly address injuries, conduct evacuations, and assess, contain, and repair damage to critical infrastructure. As such, an understanding of the geographical distribution of vulnerable populations (e.g., elderly persons), emergency services, and key economic infrastructure is vital to informing rapid and efficient dispatch of available resources (City of Vancouver 2013).
1.1 Tectonic context
This study focusses on the City of Vancouver, home to approximately 631 000 residents with a total of 2.8 million residents in the metropolitan region (Statistics Canada 2016). The city is located in south-western British Columbia, approximately 200 km from the Cascadia Subduction Zone, where the oceanic Juan de Fuca plate is moving down beneath the continental North America plate.
The two plates are “locked” over a width of several tens of kilometres along the east-dipping fault that separates them, storing elastic energy that will eventually be released when the fault slips, producing a giant earthquake (magnitude ≥ 9). Geological studies have shown that such earthquakes occur at intervals of approximately 300–800 years (Atwater and Hemphill-Haley 1997; Atwater et al. 2004; Goldfinger et al. 2012) and affect an area of about 100,000 km2, extending northward from coastal California to south-western British Columbia. The most recent of these earthquakes happened on 26 January 1700 (Atwater et al. 2005; Ludwin et al. 2005). It equalled or exceeded in size the strongest earthquakes in recorded history (including the giant earthquake in Chile in 1960 and the 2011 Tōhoku earthquake in Japan, which triggered a tsunami that killed over 16,000 people and resulted in the Fukushima nuclear reactor meltdown).
Although by far the largest, subduction earthquakes are just one of three types of earthquakes that occur in this region. Some of the numerous faults within the crust of the North America plate are “active” that is they have been the source of earthquakes with magnitudes up to about 7.5 during the postglacial period (Clague 2002). A few of these faults are near enough to Vancouver that should one of them generate a large earthquake, it would be damaging and likely deadly. Earthquakes also occur within the subducting Juan de Fuca plate as it arches downwards into Earth’s mantle. These earthquakes, which have a maximum magnitude of about 7, are deeper than those in the North American crust, and thus produce less severe ground motions than crustal earthquakes. However, they are more common than crustal earthquakes and far more common than subduction events–three larger than magnitude 6.5 have occurred beneath Puget Sound in the past 75 y, all of them damaging (Clague 2002).
By weighting current knowledge of the frequency and likely hypocentres of the three types of earthquakes that occur in the Pacific Northwest, researchers estimate that there is a 10–20% probability that Vancouver will be impacted by a damaging earthquake before the middle of the century (Onur et al. 2004, 2006; Ventura et al. 2005). Data published by the Natural Resources Canada (Halchuk et al. 2015, 2016) indicate that Vancouver could experience ground motions during a subduction or nearby crustal of slab earthquake that are strong enough to cause considerable damage to buildings, including some designed to be earthquake resistant. Details of future seismic events and their potential damage to the built environment in the Vancouver metropolitan area are uncertain, but the aforementioned findings underscore the necessity for preparedness and response planning in the Pacific Northwest.
1.2 Socioeconomic context
Research efforts seeking to identify priority response areas have placed considerable focus on physical vulnerability, using soil stability and architectural data to map earthquake damage risk. In our previous study of earthquake vulnerability in the neighbouring city of Victoria (Walker et al. 2014), we argued for the necessity of accounting for social and economic vulnerability, as certain subpopulations may require more assistance due to limited material or social capital, health-related barriers to recovery, or a greater risk of injury following a major seismic event. This consideration has since been implemented in several more recent analyses, including Fallah et al. (2015), Bahadori et al. (2017), Banica et al. (2017), Armaş et al. (2017), and Jihye and Jinsoo (2019), all of whom used multiple social and/or socioeconomic variables or indices in modelling vulnerability to seismic events.
The City of Vancouver comprises a dense inner city surrounded by medium- and low-density suburban neighbourhoods and features a mean population density of 5.4 thousand persons per square kilometre (Statistics Canada 2016). Its age distribution is similar to the Canadian average, although a disproportionately high proportion of the population lives alone (nearly 40% of all household; ibid). Although colloquially recognised as a wealthy city, in the year 2015, 3.8% of households had a post-tax annual income of less than CAD $5000, and the proportion of Vancouver residents in the low-income range (17.2%) is nearly double the Canada-wide rate (9.2%); among persons 65 years of age or older, this is nearly triple (14.6% in Vancouver, compared to 5.1% Canada-wide; ibid). Additionally, a comparatively high proportion of persons with no knowledge of an official language (6.8%, compared to the national average of 1.9%) may represent barriers for many to social and economic support. Nearly a quarter (23.3%) of all dwellings in Vancouver was built before 1960, and 48.4% before 1980 (Statistics Canada 2016), which may also constitute a high risk of structural damage in the event of a major earthquake in the region.
In order to deploy professionals and volunteers efficiently and effectively, locations in the Vancouver metropolitan region must be prioritised, for example, to set up disaster staging areas and emergency shelters near vulnerable populations, such as those whose socioeconomic characteristics are outlined above. However, a significant challenge is posed by the prioritisation of various attributes representing vulnerability/importance, necessitating a formal framework for comparison and analysis.
1.3 Multicriteria evaluation
In the context of disaster response, multicriteria evaluation (MCE) frameworks have been used in both scientific and governmental/planning spheres due their relative ease of implementation (Rashed and Weeks 2003; Akgun and Türk 2010; Martins et al. 2012; Walker et al. 2014). Decision makers can select and assign arithmetic weights to decision variables by their perceived or measured importance. The quantified variable scores are then arithmetically combined to produce suitability/priority scores for potential decision scenarios and alternatives (Malczewski 1999, 2006).
With the GIS-based MCE methodology, a decision problem is initially defined, typically taking the form of “where are the most suitable locations for X” (Malczewski 2006). A set of decision criteria deemed relevant to X are then selected. The simplest form of MCE requires that each candidate location be individually rated along a suitability scale, separately for each location in the study area. When conducted for all candidate locations, this results in a suitability map for each criterion (Rinner 2007). The assigned suitability scores are then arithmetically combined accordingly to a selected decision rule to compute a final suitability score for each candidate location. This process is shown in Fig. 1.
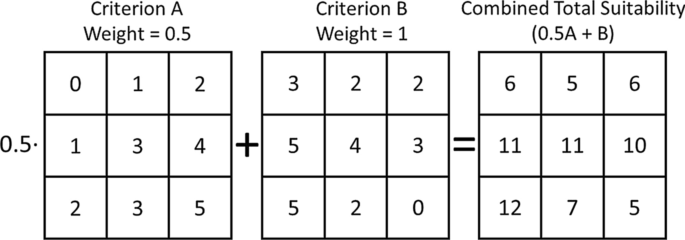
Example of a multicriteria evaluation of nine candidate locations, with two decision criteria combined using a weighted linear combination decision rule. Criterion A is weighted to be half as important as Criterion B
1.4 Decision weights
Despite significant progress in recent years, studies found in the literature rely almost exclusively on factors being weighted by researchers or the semi-informed/non-expert public, such that the weights assigned to decision variables/risk factors reflect their potentially limited knowledge and fail to incorporate more thoroughly informed expert knowledge from applied disaster planning domains. Several notable exceptions appear in the literature, including Sinha et al. (2016), who involved seven non-academic experts in conducting pairwise comparisons of selected risk factors to derive factor weights for an earthquake risk assessment in Delhi, India. These authors selected an intermediate-complexity multicriteria decision model, which while resulting in stable factor weights, required a MCE expert to facilitate the pairwise comparison and computation process. Delavar et al. (2015) asked five experts to directly rate hospitals’ seismic vulnerability on a single numerical scale, using the results to predict vulnerability for out-of-sample hospitals in Tehran. Neither of these studies describe the selected experts (e.g., their professional domains or levels of experience), so it is unclear to what degree their professional knowledge was sufficient for holistically informing the decision problems analysed. While these two studies made important progress by underscoring the importance of expert opinion, we argue that the elicitation of knowledge from a greater number of experts from a variety of related professional spheres is crucial to implementing a reliable MCE for disaster planning and management.
A significant challenge arises in the need to strike a balance between several considerations when designing multicriteria decision processes for disaster vulnerability and response. In addition to the need for expert knowledge, the algorithmic or statistical sophistication of a model, which might result in more quantitatively stable results, must be balanced against usability, such that a selected MCE tool or process should be usable in decision making circles without the need for a trained MCE expert facilitator. In their comprehensive review of decision making approaches to natural hazard management and planning problems, Simpson et al. (2016) highlight recent advances in advanced statistical MCE approaches such as Bayesian decision modelling, but underscore that expert judgement remains crucial for managing uncertainty. In this study, we argue that an easily replicable, expert-driven methodology, is crucial if it is to be used in real-world planning. Accordingly, we explore the use of a statistically simple approach to map earthquake experts’ knowledge about population vulnerability and critical infrastructure in Vancouver, Canada, in order to identify zones of elevated importance should a major earthquake occur. This knowledge is especially useful for optimising the placement of staging areas and emergency shelters, targeting initial post-earthquake reconnaissance missions, and mobilising professional and volunteer first responders and support teams.
1.5 Data and methods
Based on previous published studies, the City of Vancouver’s Earthquake Preparedness Strategy (2013), and preliminary telephone discussions with eight non-academic earthquake experts from government and private enterprise, we selected 26 geographical features and population characteristics relevant to earthquake response planning and grouped them into seven categories. The categories and their contingent features are shown in Table 1. Rather than using rates, we mapped the total population and the total number of persons in vulnerable categories, as the absolute number of individuals provide a better representation of total potential demand for emergency services.
Two groups of respondents were selected: A non-expert group and an expert group. These groups were contacted in early October 2015, and all surveys were completed between 14 and 29 October 2015.
1.6 Expert survey
For the expert group, we compiled a list of 35 professionals in earthquake planning and response from private and governmental organisations in the Metro Vancouver area. We contacted each person by telephone or e-mail and asked them to participate in an anonymous online survey. They were first provided a brief description of the study and asked to provide feedback on the features and categories included prior to receiving the survey. The survey was updated based on their initial feedback, resulting in the categories and features shown in Table 1.
Each respondent was then asked to independently rate each of the 26 features on a Likert scale ranging from 0 to 5, where 0 indicates that the given feature has no importance to post-earthquake response and 5 indicates the highest importance. The respondents were then asked to independently rate each category as a whole, according to the same Likert scale. This scale was selected for ease-of-use and interpretation and to assess if a simple survey instrument is sufficient for capturing expert opinion. Following a visual evaluation of the resulting frequency distributions, the median Likert scores for each category and for each feature were captured and used in the final analysis.
1.7 Non-expert survey
The non-expert group comprised five undergraduate geography students in a multicriteria evaluation course in Metro Vancouver. The students first conducted a review of the academic and non-academic literature on earthquake response and multicriteria evaluation for disaster response planning. This literature review included all articles cited herein and was, followed by group discussions facilitated by the lead author of this paper. The students were neither given any additional information, nor did they have contact with the expert group or see the expert survey results. We can therefore define this group as an informed, non-expert group of local resident stakeholders.
The non-expert group was asked to use an Analytic Hierarchy Process, facilitated using the AHP toolset in the geographical information systems software IDRISI Selva (v. 17.2). The AHP method, which is described in greater detail by Saaty (1990), was chosen because its use of pairwise comparisons simplifies the selection of factor weights for non-experts, despite its relatively complex calculation. AHP has been used in similar studies of population vulnerability to earthquakes (e.g., Han and Kim 2019). The non-expert group rated every pairwise combination of features within each category, based on their perceived relative importance (e.g., how important are fire halls compared to hospitals?). The non-expert group thereafter rated the categories, again using the pairwise comparison procedure. For each pairwise comparison, the group conducted deliberations in order to select a consensus-based pairwise weight. The lead author observed this process during their deliberations, but did not provide any input or feedback to the group.
1.8 Multicriteria weight derivation
To assess differences in approaches to MCE for disaster planning, three separate MCEs were conducted: (a) one using equal factor weights; (b) a second using AHP-derived factor weights from non-experts consensus, and (c) a third using median-based factor weights derived from experts:
-
MCE-Uninformed assumes that all factors are of equal importance, resulting in category weights proportional to the number of factors selected for a given category. This model represents the most simple and easy-to-implement method, but should be interpreted as an uninformed approach to the multicriteria decision problem.
-
MCE-Non-Expert is based on informed consensus among non-experts, i.e., the factor weights derived from the non-expert AHP. This is the most arithmetically complex method of the three used in this study and requires MCE expert facilitation.
-
MCE-Expert is based on informed expert opinion, i.e., the survey results completed by disaster response and planning professionals. This MCE used the simple Likert scale, easily administrable online and requiring no facilitation.
We tabulated the survey results and visually examined the resulting response distributions for normality. As the Likert scale responses did not exhibit normal distributions, the use of mean and standard deviation as measures of central tendency was precluded (Sullivan and Artino 2013). Therefore, we calculated the median for each feature and each category, and computed the Fleiss' kappa score (exact method) to assess the level of agreement between respondents.
1.9 Spatial data processing
We downloaded infrastructure data from Vancouver Open Data, BC Hydro, and DMTI Geospatial. Soil liquefaction risk data were acquired from the British Columbia Geological Survey.
We downloaded socioeconomic data for every census dissemination area (DA) in the study area for 2016, which is the most recent census year in Canada. A DA comprises a geographical area with 400–700 residents, the borders of which are selected to maximise within-DA demographic/socioeconomic heterogeneity, while adhering to administrative boundaries and street networks.
For all features except the census variables, their values were standardised on a scale from zero to one using a linear transformation (i.e., minimum value = 0; maximum value/2 = 0.5; maximum value = 1). For the census variables, we used a base 10 log-transformation to improve normality of their respective distributions, which were heuristically and statistically assessed prior to modelling. Values with an anticipated positive effect on response priority (e.g., social vulnerability represented by persons ages 65 +) were scaled positively, while those representing an inverse importance (e.g., income, such that high-income populations are assumed to have greater economic resilience in the event of an earthquake) were scaled negatively.
In order to map the geographical distributions of the features and MCE results, we generated a hexagonal base grid over the study area, with a spatial resolution of 50 m (i.e., each hexagonal cell of the grid has a radius and side length of 50 m). All features were mapped using this grid. A hexagonal structure was selected because it provides a more accurate spatial representation of both discrete features and continuous surfaces when mapped, compared to the traditional square-cell raster grid (de Sousa and Leitão 2018). All point features were assigned to the hexagon in which they were contained, and all polygon features were assigned to the hexagon containing the highest proportion of their total area.
To produce the final three MCE maps, we overlaid all hexagonal feature grids and arithmetically weighted and combined them as shown in Fig. 1. All map preparation was completed using ESRI ArcGIS (v. 13).
2 Results
As observed by the lead author, the non-expert group reached consensus for all pairwise combinations of features, resulting in the factor weights shown in Table 2. However, the group decided after extended discussion that all categories had equal importance, acknowledging that they lacked sufficient expertise in disaster response planning and management necessary to prioritise one category over any other.
Twenty-seven expert surveys were completed, for a total of 866 data points. There were 12 instances of a missing response. Missing responses were randomly distributed across respondents, categories, and features. Missing values were therefore individually excluded from the analysis. The resulting Fleiss’ kappa score of 0.144 (27 expert rating on 33 subjects) indicates mild agreement of ratings among respondents. The resulting category and factor weights are shown in Table 2.
The resulting maps display some similarities corresponding to the locations of features selected for the study. As shown in Fig. 2, the uninformed (equally weighted) model indicates several high priority locations in the downtown area and along the primary north–south and east–west traffic corridors. This model resulted in comparatively high importance assigned to many areas dispersed throughout the study area, including along arterial roads and secondary commercial zones along the eastern periphery of the study area, e.g., bordering the neighbouring city of Burnaby. The main bridges connecting the downtown area with central Vancouver were not highlighted, although these are likely to be crucial for earthquake response efforts.

Unweighted MCE results (equal weights for all features and categories, representing an uninformed decision model)
The map displaying the informed non-expert MCE results show distributions of priority areas (Fig. 3) similar to those on the unweighted map. The large high-priority region bordering the Salish Sea and Richmond in the south-west corner of the study area reflects the disproportionately high risk associated with liquefaction potential assigned by the non-expert group. Priority areas are more geographically dispersed in the non-expert results than in the unweighted results. Some areas featuring higher importance scores are observed in the eastern half of the study area, where more low-income neighbourhoods are located.

Non-expert-weighted MCE results derived from the informed non-expert group using AHP methodology
The expert-weighted MCE results are shown in Fig. 4. As in the unweighted and non-expert MCE results, the downtown area contains several high-priority locations, as well as the major north–south and east–west traffic corridors. Fewer areas exhibit high priority than in the previous two MCE models, indicating a more precise definition and focus on zones where disaster response teams might be deployed. For example, the expert results highlight high-density traffic and economic centroids in the central business district (e.g., the central train station and the stadium), without the immediate surroundings (primarily high-density residential towers and office towers) being identified as priority zones.

Expert-weighted MCE results derived from informed expert group responses to the Likert scale questionnaire
Figure 5 displays the differences between the non-expert and the expert MCE results. Blue (negative values) indicate that expert scores are higher than non-expert scores, whereas yellow (positive values) indicate that the non-expert scores are higher. The results indicate that non-experts rated liquefaction risk as a relatively important variable, while experts indicated higher importance for evacuation centres, which appear as blue hexagons dispersed throughout the study area. There are also small differences corresponding to a relatively lower importance given by experts to socioeconomic vulnerability. However, the predominantly residential areas across the study area (appearing as a green background intersected by the light-green road grid) do not appear to differ in importance between the two. The perimeter of Stanley Park, the northernmost prominence in the study area, featured a noticeable difference of importance scores, although this area features a low-capacity two-lane road and very few points of economic interest.

Difference map obtained by subtracting expert scores from non-expert scores
3 Discussion
There are similarities among the three MCE models, in that all three highlighted priority zones in the easternmost section of False Creek, an area comprising the high-capacity Cambie Bridge, an arena and football stadium, and many utilities and points of economic importance. Main north–south transportation routes and economic cores also featured prominently in the results, and both the expert and non-expert participant groups produced similarly criterion weights for senior populations and total populations.
However, several geographical differences are notable and may indicate significant implications for resource allocation in post-disaster response scenarios. Relative to the non-experts, the experts tended to prioritise immediate response measures (e.g., evacuation shelters and emergency services) over socioeconomic vulnerability. As a result, the expert-derived map indicates more precise locations for response priority, which is likely to be of greater value for planning purposes, such that distinct zones can be identified in advance and response staging areas established.
In the case of emergency services, we see more variation among the non-expert group, which was also observed as uncertainty during that part of their deliberation process. The ways in which emergency services are utilised and potential barriers to their deployment during a major earthquake were areas of significant uncertainty, and the non-expert group consensus was characterised by a low degree of confidence in their ability to select accurate weights. High uncertainty was also observed, while they sought to specify an appropriate weight for bridges.
The non-expert group’s knowledge stemmed mainly from a brief review of the relevant academic literature, resulting in a degree of distance from the practise of disaster management. As such, more abstract variables, such as socioeconomic status, were given relatively high priority. This was clearly evident during the deliberation process, in which members of the non-expert group routinely referred to academic articles. The nature of scientific publishing and its focus on methodological and theoretical advancement may therefore have disproportionately preconditioned the non-expert group to assign higher weights to more abstract variables. Similarly, this non-expert group, comprising university students, exhibited strong interest in the methodological sophistication of AHP compared to the expert group, who indicated that the use of a Likert scale and the mapping of median values was sufficient for capturing expert knowledge and opinion.
However, several similarities in the results (e.g., shelters and utilities) indicate that the importance of certain features was accurately assessed by the non-expert group. Additionally, several clusters of priority are common between both maps, particularly around the downtown and primary north–south traffic corridors. These similar results may indicate that the use of informed non-expert knowledge also may be valid for planning and response purposes, although we nevertheless underscore the necessity of experiential, professional knowledge and opinion in this process.
An important consideration in the interpretation of our results is the concept of trade-off, wherein the diminishing effect of a relatively low category score can be overridden by relatively high weights assigned to its constituent variables. For example, compared to non-experts, the expert group assigned a lower category weight to evacuation shelters, but a higher weight to its individual variables.
3.1 Study limitations
Weighted linear combination is conceptually simple and easy to implement, making this an attractive methodology for non-experts. However, the use of the simplest variant, the unweighted (uninformed) WLC model, induces a high degree of sensitivity to the number of factors in each category, i.e., a category with more factors will be disproportionately weighted against a category with fewer factors. The selection and categorisation of factors therefore constitutes an important consideration in the model-building process. Furthermore, the WLC decision rule assumes that all criteria can be traded-off for another; a high suitability according to criterion A can compensate for a low suitability according to criterion B. A significant barrier in the use of MCE is that this approach brings an implicit assumption that features/factors can be reasonably measured against one another, and that degrees of trade-off between factors are logical. However, in the context of disaster response planning, the features and categories used in this study cannot necessarily compensate for one another; i.e., an ambulance cannot function as a fire rescue vehicle. As such, detailed qualitative consideration of each feature’s purpose and means of use in the event of an earthquake is essential to planning. Alternatively, the implementation of quantitative trade-off decision rules (e.g., Ordered Weighted Averaging) may improve model accuracy, although the correct use of such tools requires close expert facilitation, because they are arithmetically and conceptually complex.
It has long been understood that the definition of criteria and categories constitutes a vital step in the MCE model design process, in which data availability often plays a central role (Malczewski 2000). The necessity for decision criteria to be comprehensive, operationalizable, mutually independent for the purposes of modelling, and non-redundant poses further challenges in light of the need for MCE models to be utilisable, e.g., with a minimal number of decision criteria (Keeney 1980). The spatial units for analysis also impact MCE results, due to both the size and configuration of, for example, census areas or the hexagonal grid used in this analysis; this issue is more widely recognised in geographic information science as the modifiable areal unit problem. The use of small-area census data induces several sources of potential error. The modifiable areal unit problem formalises the ecological fallacy in this context, such that absolute boundaries between census dissemination areas fail to represent gradients and within-unit heterogeneity, for example, in areas that feature mixed-density housing and greenspace. Given these limitations, Malczewski (2000) argues that MCE is more suitable for exploratory decision analysis than prescriptive assignment of optimal locations for a given decision problem.
The use of separate methods to derive factor weights from non-expert and expert respondents limits their comparability and prevents any quantifiable or robust inference addressing potential differences in prioritisation between the participant groups. However, this approach enabled us to explore consensus building among informed laypersons and contrast the results against those generated by experts. Due to our emphasis on anonymity and participants’ time constraints, we were not able to hold focus groups or ask experts to develop consensus in groups. Future research should focus on deriving more qualitative and contextual information from expert participants, and engagement of relevant policymakers may be a valuable element of future study.
In order to improve the accuracy of spatial multicriteria models and the degree of nuance with which they represent human decision making, further analysis should implement more nuanced weighting functions (e.g., implementing non-linear standardisation functions to better approximate the importance of a given feature/category) and trade-off capabilities (e.g., Ordered Weighted Averaging). The core challenge in employing these more sophisticated methods is that they greatly increase model complexity, requiring close facilitation when working with disaster planning and response experts. For example, in order to implement a logistic function to model the importance of socioeconomic vulnerability, the steepness and thresholds of the function require careful consideration and discussion in order to correctly parameterise the function. These values are best generated from a combination of statistical analysis and qualitative heuristics, for which expert experience and opinion are vital.
The selection of decision criteria was significantly impacted by data availability, for example, the capacity of emergency services and earthquake response teams and their respective spatial distributions, which may play a significant role in the allocation of resources immediately following a major seismic event.
Another important opportunity for model improvement lies in the development of local factor weights, which enable certain geographical areas to be weighted according to local factors, such as cultural or economic importance (Malczewski 2011; Malczewski and Liu 2014). Similarly, however, the implementation of local weights is more statistically complex than the methods used in this study and may significantly limit the usability of an MCE approach for applied disaster response planning.
4 Conclusions
In this paper, we present an expert-driven and replicable methodology for conducting GIS-based multicriteria evaluation (MCE) to support earthquake planning and response operations. The tools and methods can be easily replicated with free open-source data and software, and do not require MCE expert facilitation or complex arithmetic/statistical calculations.
By contrasting equally weighted, non-expert-weighted, and expert-weighted MCE results, we observed differences in the locations and scores that are highlighted on their respective maps and that indicate the need to leverage expert opinion in the spatial decision process. While the inclusion of expert opinion necessitates additional time and effort, the differences between uninformed, non-expert, and expert models highlighted in our results demonstrate that expert input may significantly impact the results and their implementation in planning and response. Highlighting geographical zones of increased importance can play an important role in the spatial allocation of resources (e.g., seismic upgrades to existing structures, location allocation for emergency services and volunteer brigades, information campaigns for particularly vulnerable populations, soil stability testing), while also serving as a potential tool for citizen engagement and education (e.g., emphasising the need for household/business evacuation plans and response kits in vulnerable areas).
We assert that GIS-based MCE can provide a useful means of identifying priority zones, and furthermore, may be a useful tool for urban planning and location analysis of emergency services in earthquake risk areas. However, a balance between ease-of-use, comprehensiveness of decision criteria, and validity of factor weights is crucial for correctly informing spatial decisions in the context of natural hazard planning and response, and call for further research to improve the application and usability of expert-driven MCE, particularly in low-resource, high-risk settings.
Availability of data and material
All data used in this study are freely available through open data portals online, except for those data acquired at cost from DMTI Spatial.
References
Akgun A, Türk N (2010) Landslide susceptibility mapping for Ayvalik (Western Turkey) and its vicinity by multicriteria decision analysis. Environ Earth Sci 61:595–611
Armaş I, Toma-Danila D, Ionescu R, Gavriş A (2017) Vulnerability to earthquake hazard: bucharest case study, Romania. Int J Disaster Risk Sci 8:182–195. https://doi.org/10.1007/s13753-017-0132-y
Atwater BF, Hemphill-Haley E (1997) Recurrence intervals for great earthquakes of the past 3500 years at northeastern Willapa Bay, Washington. US Geol Surv Prof Pap 1576, 108 pp
Atwater BF, Musumi-Tokkaku S, Satake K, Tsugi Y, Ueda K, Yamaguchi DK (2005) The orphan tsunami of 1700: Japanese clues to a parent earthquake in North America. US Geol Surv Prof Pap 1707, 133 pp
Atwater BF, Tuttle MP, Schweig ES, Rubin CM, Yamaguchi DK, Hemphill-Haley E (2004) Earthquake recurrence inferred from paleoseismology. In: Gillespie AR, Porter SC, Atwater BF (eds) The Quaternary Period in the United States, vol 1. Elsevier, Amsterdam, pp 331–350
Bahadori H, Hasheminezhad A, Karimi A (2017) Development of an integrated model for seismic vulnerability assessment of residential buildings: Application to Mahabad City Iran. J Build Eng 12:118–131. https://doi.org/10.1016/j.jobe.2017.05.014
Banica A, Rosu L, Muntele I, Grozavu A (2017) Towards urban resilience: a multi-criteria analysis of seismic vulnerability in Iasi City (Romania). Sustainability 9:270–287
City of Vancouver (2013) Earthquake Preparedness Strategy. Vancouver, British Columbia, Canada
Clague JJ (2002) The earthquake threat in southwestern British Columbia: a geological perspective. Nat Hazards 26:7–34
de Sousa LM, Leitão JP (2018) HexASCII: a file format for cartographical hexagonal rasters. Trans GIS 22:217–232. https://doi.org/10.1111/tgis.12304
Delavar MR, Moradi M, Moshiri B (2015) Earthquake vulnerability assessment for hospital buildings using a GIS-based group multi criteria decision making approach: A case study of Tehran Iran. ISPRS-Intern Arch Photogramm Remote Sens Spat Inf Sci 40(1):153–157
Fallah S, Sarsangi A, Modiri E (2015) The social and physical vulnerability assessment of old texture against earthquake (case study: Fahadan district in Yazd City). Arab J Geosci 8:10775–10787. https://doi.org/10.1007/s12517-015-1939-8
Goldfinger C, Nelson CH, Morey AE, Johnson JE, Patton JR, Karabanov E, Gutiérrez-Pastor J, Eriksson AT, Gràcia E, Dunhill G, Enkin R, Dallimore A, Vallier T (2012) Turbidite event history: Methods and implications for Holocene paleoseismicity of the Cascadia subduction zone. US Geol Surv Prof Pap 1661-F, 170 pp
Halchuk SC, Adams JE, Allen TI (2015) Fifth generation seismic hazard model for Canada: grid values of mean hazard to be used with the 2015 national building code of Canada. Geol Surv Can Open File 7893:26
Halchuk SC, Adams JE, Allen TI (2016) Fifth Generation seismic hazard model for Canada: crustal, in-slab, and interface hazard values for southwestern Canada. Geol Surv Can Open File 8090:19
Han J, Kim J (2019) GIS-based seismic vulnerability mapping and assessment using AHP: a case study of Gyeongju Korea. Korean J Remote Sens 35(2):217–228. https://doi.org/10.7780/KJRS.2019.35.2.2
Keeney RL (1980) Siting energy facilities. Academic Press, New York
Ludwin RS, Dennis R, Carver D et al (2005) Dating the 1700 Cascadia earthquake: great coastal earthquakes in native stories. Seismol Res Lett 76:140–148. https://doi.org/10.1785/gssrl.76.2.140
Malczewski J (1999) Spatial multicriteria decision making. In: Thill JC (ed) Spatial Multicriteria Decision Making and Analysis: A Geographic Information Sciences Approach. Ashgate, Brookfield, USA, pp 11–48
Malczewski J (2000) On the use of weighted linear combination method in GIS: common and best practice approaches. Trans GIS 4(1):5–22
Malczewski J (2006) GIS-based multicriteria decision analysis: a survey of the literature. Int J Geogr Inf Sci 20:703–726. https://doi.org/10.1080/13658810600661508
Malczewski J (2011) Local weighted linear combination. Trans GIS 15:439–455
Malczewski J, Liu X (2014) Local ordered weighted averaging in GIS-based multicriteria analysis. Ann GIS 20:117–129
Martins VN, Sousa e Silva D, Cabral P (2012) Social vulnerability assessment to seismic risk using multicriteria analysis: the case study of Vila Franca do Campo. Nat Hazards 62:385–404
Münchener Rückversicherungs-Gersellschaft (2019) NatCat Service. https://natcatservice.munichre.com/. Accessed 11 Oct 2019
Onur T, Ventura CE, Liam Finn WD (2006) A comparison of two regional seismic damage estimation methodologies. Can J Civ Eng 33:1401–1409
Rashed T, Weeks J (2003) Assessing vulnerability to earthquake hazards through spatial multicriteria analysis of urban areas. Int J Geogr Inf Sci 17:547–576
Rinner C (2007) A geographic visualization approach to multi-criteria evaluation of urban quality of life. Int J Geogr Inf Sci 21(8):907–919
Simpson M, James R, Hall JW et al (2016) Decision analysis for management of natural hazards. Annu Rev Environ Resour 41:489–516. https://doi.org/10.1146/annurev-environ-110615-090011
Sinha N, Priyanka N, Joshi PK (2016) Using spatial multi-criteria analysis and ranking tool (smart) in earthquake risk assessment: a case study of Delhi region India. Geomatics Nat Hazards Risk 7:680–701. https://doi.org/10.1080/19475705.2014.945100
Statistics Canada (2016) 2016 Census of Population. Ontario Canada, Ottawa
Sullivan GM, Artino AR (2013) Analyzing and interpreting data from likert-type scales. J Grad Med Educ 5:541–542. https://doi.org/10.4300/jgme-5-4-18
Ventura CE, Liam Finn WD, Onur T et al (2005) Regional seismic risk in British Columbia: classification of buildings and development of damage probability functions. Can J Civ Eng 32:372–387
Walker BB, Taylor-Noonan C, Tabbernor A et al (2014) A multi-criteria evaluation model of earthquake vulnerability in Victoria, British Columbia. Nat Hazards 74:1209–1222
Acknowledgements
The authors wish first and foremost to thank all survey participants for their valuable input and feedback. Many thanks to the reviewers, whose feedback and recommendations were crucial in improving upon the original manuscript. We wish also to thank the undergraduate students who participated in this study, whose interpretations of the literature and deliberations during the consensus-building process made important contributions to this study. BBW is supported by the German Federal Ministry for Education and Research (Bundesministerium für Bildung und Forschung).
Funding
Open Access funding enabled and organized by Projekt DEAL.. No project-specific funding was acquired nor used for this study.
Author information
Authors and Affiliations
Contributions
BBW, NS, and JC conceptualised the study. BBW and DS conducted the data acquisition, preparation, and analysis. All authors contributed to the interpretation of results and manuscript preparation.
Corresponding author
Ethics declarations
Conflict of interest
The authors declare that we have no competing interests.
Ethical approval
Ethics approval for this study was obtained from the Simon Fraser University Office of Research Ethics (Certificate Number 2015s0266).
Consent to publication
All study participants were provided with the standard consent guidelines for non-medical research from Simon Fraser University, and participant consent for participation and publication was confirmed in writing via e-mail. All study participants were also required to review consent guidelines prior to participation in the online survey, and confirmed consent to participate and consent for anonymous publication of study results by proceeding with the questionnaire.
Additional information
Publisher's Note
Springer Nature remains neutral with regard to jurisdictional claims in published maps and institutional affiliations.
Rights and permissions
Open Access This article is licensed under a Creative Commons Attribution 4.0 International License, which permits use, sharing, adaptation, distribution and reproduction in any medium or format, as long as you give appropriate credit to the original author(s) and the source, provide a link to the Creative Commons licence, and indicate if changes were made. The images or other third party material in this article are included in the article's Creative Commons licence, unless indicated otherwise in a credit line to the material. If material is not included in the article's Creative Commons licence and your intended use is not permitted by statutory regulation or exceeds the permitted use, you will need to obtain permission directly from the copyright holder. To view a copy of this licence, visit http://creativecommons.org/licenses/by/4.0/.
About this article

Cite this article
Walker, B.B., Schuurman, N., Swanlund, D. et al. GIS-based multicriteria evaluation for earthquake response: a case study of expert opinion in Vancouver, Canada. Nat Hazards 105, 2075–2091 (2021). https://doi.org/10.1007/s11069-020-04390-1
Received:
Accepted:
Published:
Issue Date:
DOI: https://doi.org/10.1007/s11069-020-04390-1