
Abstract
Saffron is one of the costlier spices that are cultivated in specific regions of the world. Due to its restricted accessibility and more popularity, eventually saffron adulteration is one of the concerning issues in the recent times. It becomes difficult for human vision to discriminate between real and adulterated saffron samples. With the emergence of visual computing and data-driven algorithms, the saffron adulteration prediction systems (SAPS) are designed to predict the original and adulterated saffron samples. However, the majority of the techniques exhibit promising performance but the problem of generalization capabilities (unseen – samples) and scarcity of the saffron databases are still open research challenges. In this work, to overcome these issues, we propose a novel ensemble-based saffron prediction model (SaffNet) using statistical image features for the detection of contamination in the Kashmiri saffron. As data-driven approaches mainly rely on the representative samples, but to the best of our knowledge the standard benchmark datasets for Kashmiri saffron is not available. Therefore, we have created our novel Saffron dataset (Saff-Kash) collected afresh from different parts of Kashmir valley that includes the samples of both the authentic and adulterated saffron classes. The primary aim of the work is to anticipate the adulteration in saffron samples. Thereafter, these images are pre-processed and the dataset is prepared for the proposed SaffNet model. The SaffNet architecture designed using gradient boosting ensemble evaluated on Saff-Kash outperforms the outcomes of individual classifiers i.e., Support vector machine (SVM), decision tree, and K-Nearest neighbor (KNN) with an overall accuracy of 98%. Moreover, the execution time taken by the SaffNet model for training the SVM classifier is 8.56 milliseconds whereas for gradient boosting classifier it is 7.7 milliseconds.
1 Introduction
The Saffron (Kesar) is an expensive spice and it is cultivated in different countries of the world, similar to Iran, India, Spain, Greece, Italy, and Morocco [10]. Among all, Iran is the leading saffron producer. Since last few decades, 90% of the world’s saffron is cultivated in Iran that is simply approximately 300 tons per annum. As per a recent published in 2021 report by the council of scientific and industrial research (CSIR-IIIM), the overall world production of saffron is around 500 tons per annum. The cultivation of saffron in the world uncover that Iran include the biggest space of 43,408 ha followed by India where saffron is cultivated at 3715 ha in Kashmir. The majority of it is 3200 ha that include Pampore and Pulwama districts of Jammu and Kashmir’s. The year 2020 indicates an overall yield of saffron is 13.2 metric tons from these two districts of Kashmir valley. It is the best production during last ten years in this region from Kashmir valley [20]. Saffron (Kesar) is a flavor taken from the bloom Crocus sativus typically known as “saffron crocus”. The word saffron found its name from the Arabic vocabulary “azaffron” that means yellow stemless triploid herb. The saffron also has few other names i.e., Zaffran, Kang, Kang rich and in Sanskrit it is known as ‘Kum-kum’ whereas ‘Koung’ in Kashmiri language. The Kashmir valley of India is the second largest producer of saffron after Iran [26, 28]. The key properties of Kashmiri saffron include more broadened and thicker stigmas, customary deep red color, and different flavour as compared to Iranian Saffron, A few samples of Kashmiri Saffron are shown in Fig. 1.

Kashmiri saffron sample images (a) The saffrron flower and (b), (c) dark red-color stigmas of the saffron
In the recent times, the cases of saffron adultration has been observed as it is very costly as well as rarely avaialble spice. Figure 2 shows images of a few adulterated saffron samples [14]. Several conventional methods are used to detect the purity of origial saffron but these methods sometimes fails to perform well. It can to decline in sale of Kashmiri saffron in global market as well as putting the lives of several consumers in danger with the menace of saffron adulteration [18, 19].

Adulterants used in the kashmiri saffron. (a) Saffron male part as adultrant, (b) Sunflower as adultrant (b) Maze as adultrant and (c) adulterants in saffron. (d), (e), (f) adulterated samples with three different adultrants
The existing approaches in the literature have focussed on the automatic prediction aulteration prediction of Iranian saffron. Moreover, maority of the methods in the existing studies have used the hardware-based mechanisms that demostrates limited prediction perforamance. It is also obeserved no intelligen as well models has been developed for the adultration prediction for kashmiri saffron. To address these issues, the current work aims to develop a computer vision-based intellgent approach for descrimnating a given sample as fake or pure.Therefore,one of viable solution for adultration prediction in Saffron is to make use of data-driven approaches, where a machine learnning model is build on the samples of both the classes including pure and adultrarted ones. Moreover, to overcome the problem of adultration prediction in Kashmir saffron with machine leaning, it necciciate the adequate nunber of samples from each class. Our analysis from the literature, also clearly indicate the non-availability of bechmark dataset for Kashmiri saffron.
With these issues, the main motivation behind this researh work is to design an automatic saffron prediction system(SaffNet) via ensemble-based learning to achieve state-of-the-art perforamance. Besides that, we also created our own primary dataset for Kashmiri saffron(Saff-Kash) with appropraite number of samples collected from various parts of Kashmir valley. To escalate the size of our dataset, we also employ data augmentation method via various image processing operations such as fliping, rotation, scaling and ect.
The key contributions of this work are summarised as follows:
-
i.
We build our own dataset Saff-Kash for Kashmiri saffron including both the classes i.e., pure and adulterated.
-
ii.
We present a novel framework (SaffNet) for saffron adulteration prediction using ensemble-based on nine statistical image features.
-
iii.
The SaffNet is trained and evaluated on self-created novel Saff-Kash dataset.
-
iv.
Our SaffNet approach exhibits superior performance with Gradient boosting (GB) ensemble as compared to other individual counterparts such as SVM, KNN, and DT.
-
v.
The SaffNet outperforms other similar machine learning-based approaches in terms of performance.
The remainder of the article is organised as folows. Section 2 presents the related of saffron adultraction mechanisms. Section 3 illustrates the process of creating our novel Saff-Kash dataset. The proposed frameowrk and algorithms for SaffNet are explained in the Section 4. The performance evaulation of our SaffNet through a series experimets and comparative analsyis is presented in Section 5. Finally, Section 6 highlights conclusions and future scope of the proposed method. The symbols and acronyms used in this article are listed in Table 8 under Appendix section.
2 Related work
A brief review of related saffron adulteration prediction techniques is presented in this section [2]. Initially the existing literature has focussed on the prediction of adulteration in Iranian saffron samples and majority of the methods have used the hardware-based techniques.
The limited research work has been carried out on the Kashmiri saffron samples by using the software-based technique such as, A. R Gohari et al. [5] proposed a hardware-based microscopic technique named as HPLC (high pressure liquid chromatography) and TLC (Thin layer chromatography) in which the samples are immersed inside water to check the smell and the color reaction of the stigmas of saffron. Moreover, it differentiates that the stigmas that belong to saffron, safflower, arnica or marigold. Whereas, the other work presented by A. Jafari et al. [13] is related to software-based technique where the images of saffron are captured from the Istahban saffron fields of Iran, in which the twenty pictures are used for the image analysis and fifty pictures are used to assess the algorithmic rule. Artificial neural network (ANN) is used to predict the adulteration or to differentiate the authentic saffron samples from that of adulterated one and these are processed with special techniques, that lead to satisfactory performance.
Another work on software-based technique is proposed by K. Heidarbeigi et al. [6], where the prediction of adulteration in saffron is identified using an electric nose. The principal component analysis (PCA) and backpropagation artificial neural network (B-ANN) is used to predict the adulterated samples and the performance reveals that the technique detects the adulteration with limited accuracy. Moreover, it is found that the E-Nose correctly identifies and differentiates the authentic and the adulterated samples with a 86. 87% success rate (i.e., classification accuracy).
Some research works on saffron adulteration prediction are related to the quality check-based via the presence of certain chemical compounds such as crocin, picrocrocin and safranal. In which S. K. Shukla et al. [25] proposed the theoretical examination of the saffron samples (i.e., genuine, or fake) that involves several chemical tests to check the primary authenticity of the saffron. However, the reaction of the saffron compounds (such as, crocin, crocetin, picrocrocin) with acids like vitriol, and it results in indigo blue color that forms a fast credibility check. Moreover, a work related to quality check or authenticity check of saffron samples is done by W.J.Huang et al. [7]. In this method the stigmas of saffron are put inside the compound i.e., cryogen or crumpled into the powder for the separation of genomic polymer from the stigmas. For polymer extraction a plant ordination kit is applied and the quality of this polymer is crushed by gel activity. The adulteration rate of saffron in Chinese markets touched 33.33%. The samples of saffron have a singular polymer barcode or a mixture of multiple polymer barcodes. This method offers the reliable and efficient suggestions for differentiating the real and adulterated saffron.
The authors have used the software-based techniques along with microscopic techniques for the prediction of adulteration such as, S.Varliklioz et al. [27] designed a spectroscopic technique for determining the adulteration in saffron and also specify the type of adulterants (i.e., sunflower, marigold, or safflower). This technique consists of three methods such as, FRQS (Fourier remodel qualitative analysis), RQAS (Raman qualitative analysis), and laser-induced qualitative analysis (LIQS), and therefore the supremacy of the techniques is checked by using principal component analysis (PCA) and the best distinction among real and adulterated saffron samples are obtained with LIQS using PCA results. Whereas, Dowlatabadi et al. [4] developed the H-Proton magnetic resonance method alongside chemometric variable knowledge analysis for the saffron adulteration detection. The original saffron samples are well separated from that of adulterated one using the PCA (Principal Component Analysis) and PLS-DA (Partial method of least squares Discriminant Analysis) methods. The affectability of the PLS-DA model is high in separating the genuine from fake samples. Moreover, the authentic saffron samples are clustered based on their cultivation site. In addition, N. Azarabadi et al. [3] presented an approach to visualize crocin elements and volatile ingredients of saffron for checking the quality. The standard classes of tests contradict in red marks of disgrace (for example “Sargol-I and Sargol-II”) and strings with plans of yellow tone. The full amount of the crocin is referred with HPLC as most prominent inside the Sargol-I test (66.67 mg/g) and least with the bundle saffron test (51.66 mg/g). The SPME followed by GC-MS is like the screen unstable piece of saffron and due to the examination, 40 mixtures are seen by three unmistakable strands (PDMS, Dad, and Vehicle/PDMS). The GC-MS the most unmistakable composite of saffron is accessible inside the Pushal-I, Pushal-II, Sargol-I, Sargol-II, and Bundle class tests as 57.02%, 61.31%, 49.64%, 50.29% and, 50.42%, individually.
Xiaohui Lui et al. [17] presented a method called hyper-spectral imaging and variable spectral analysis to check the credibility, authenticity, origin, and quality, of saffron samples. The coefficient of reflection spectra is extracted from these hyper-spectral images of saffron. Then the typical wavelengths are chosen by using the algorithms like, consecutive projection algorithmic rule, genetic algorithmic rule, and competitive reweighted sampling. For the supported and selective wavelength, back propagation neural network (BPNN) model is designed, and the results shows that the model combining back propagation neural network with competitive adaptive reweighted sampling achieved higher performance and therefore the prediction accuracy of the one-adulterated, 3 domestic, and 2 foreign saffron is 99%, 95%, 94%, 100%, 83%, and 96%.
Additionally, Moghadam et al. [21], developed a Saffron classification-based model using machine vision techniques for detecting the authenticity of saffron. The experts of Iran categorize saffron into 3 classes such as, Sargol, Pushal and, Negin,. The 440 color images of saffron from the above-mentioned categories are non-inheritable, and these pictures are captured via a portable camera. By using image processing technique, 21 color features and 99 textural features were extracted, and the 22 classifiers are used for the classification of real and fake saffron samples with the features. The SVM classifiers are superior to that of remaining classifiers and the performance evaluation reveals that the accuracy is up to 89.9% with the Quadratic SVM and mathematical space discriminant classifier.
In a recent study, Near-infrared (NIR) spectroscopy is a quick and non-destructive technology created by Parastar et al. [23] that has gained a lot of popularity. In which NIR allows for preliminary food monitoring of various food types and provides both qualitative and quantitative data on complex samples. A current investigation on the detection of adulterants in saffron samples, conducted by Shawky et al. [29], is also provided. In order to improve the quality of the saffron, NIR spectroscopy and various chemometric techniques have been utilised to identify various plant adulterants. The medicinal benefits of saffron’s bioactive components for conditions like bronchitis, diabetes, fever, colds, asthma, diabetes-related ailments, and coronary artery disease are enormous and are depicted in article by Ahmed and Husaini [1]. It has the potential to assist in addressing issues related to individuals with severe acute respiratory syndrome (COVID-19) and post-COVID-19 issues. Additionally, it can support the management of tension and anxiety during lockdowns, quarantines, and isolation (Husaini et al., [11]). Saffron extracts may be included to some medicine formulations in the future because of all these advantageous qualities and act as an immunity booster [12]. It is expensive and hence vulnerable to adulterations because of these qualities and their significance in many societies’ religious rites. To secure the availability of pure saffron for household usage, some have even pushed for its growth in kitchen gardens [9].
3 Our novel SAFF-KASH dataset
The key aim of this work is to predict an adulteration in saffron samples and the novelty includes in data collection part, we collected the saffron images from the different regions of Kashmir valley and named it as Saff-Kash. A few images of random samples are shown in Fig. 3, which includes both real and adulterated ones. Then images are pre-processed to prepare these as per the requirement of machine learning model. For the preparation and data acquisition of Saff-Kash dataset the steps are discussed in succeeding subsections.

A few samples images of Saff-kash dataset (a) authentic (b) adulterated
3.1 Identification of saffron producing regions of Kashmir
The first step includes the identification of the various saffron producing regions of Kashmir valley such as, Budgam, Srinagar (i.e., Pampore) and Pulwama that yields more production of saffron compared to other. As due to the covid-(19) pandemic, it becomes difficult for the authors to collect samples from each saffron producing region in Kashmir valley. Hence, the samples were collected from Advanced Research Station of saffron and seed species (SKUAST-K) situated in Dussu, Pampore. A total 201 image samples were collected from the SKUAST-K and various cities of Pampore such as, Dussu, Lethpora-A, Lethpora-B and Nambal bal. as depicted in Table 1.
3.2 Image acquisition
The image acquisition step was done with Sony Alpha ILCE-5100 L camera and Samsung Galaxy S10 SM-G973F Dual SIM 128GB android Phone, which was placed at 15 cm from the sample. The shutter speed was 1/2400th and 10 seconds without employing flash and the aperture lies in between the range of f/1.5 and f/2.4 whereas, lens focal length is 26 mm and ISO is 50 and 800. The samples were captured at their maximum resolution (i.e., 3024 × 3024 pixels) and were saved in “JPG” format. In addition, for further processing the saffron images were transferred to the laptop, which was equipped with Anaconda software.
3.3 Distribution of saffron samples
The complete distribution of saffron samples includes a total of 201 images captured from various regions of the Pampore district in which 111 samples are real and 90 samples are adulterated ones. The various forms of adulterants such as, saffron male part, outer covering of maize, stigmas of safflower and sunflower were presented in the samples. In Table 1, the collection of samples from the different regions of Kashmir valley is shown along with the collection and distribution of fake and real ones.
3.4 Dataset preparation
Initially the data is split into training and testing phase and that mainly depends on the total number of acquired samples. The train-test split is used to estimate the performance and accuracy of our proposed SaffNet model. The first step includes data pre-processing in which the samples acquired from various saffron producing regions are pre-processed and then to be applied to model and it is an essential step before implementing any model. It consists of algorithms that can be used for image enhancement and noise removal process and it is compulsory that trivial information of the data needs to be eliminated to obtain better results from the models. During this phase, changes are applied to Saff-Kash data before feeding to the model for better accuracy. The lesser number of acquired saffron images are inadequate to train a machine learning model hence to counter this a notion of data augmentation is applied by using various operations such as, flipping, scaling, and rotation operations. Once the augmentation is done, the number of images is increased with their enhanced resolutions and are saved in “JPG” format. For training a SaffNet model, 111 samples as real and 90 images as fake, whereas for testing 64 real and 50 fake samples are chosen. The SaffKash dataset images are also processed for region of interest via an image segmentation method [22].
4 Our saffron adulteration prediction system (SaffNet)
This section describes the framework of our proposed SaffNet model designed to predict the class of saffron images as real or adulterated using ensemble learning. The literature witnessed that majority of saffron prediction techniques are designed for Iranian saffron whereas, limited work has been done on Kashmir-based saffron using data-driven approaches. Hence, to address this challenge we designed a SaffNet model that extracts statistical image features from the saffron image samples and an ensemble is trained for predicting the class as adulterated or real. Furthermore, the model is trained and tested on self-created dataset comprising of authentic and fake saffron samples from Kashmir valley.
4.1 The SaffNet framework
The proposed framework of SaffNet adulteration prediction model is shown in Fig. 4. It consists of two phases i.e., the training and testing phase. The model initially splits the dataset into training and testing set and then performs saffron adulteration on both to identify real and fake images. Then, the images are pre-processed, and statistical features are extracted from these images to train different machine learning (ML) models such as, Random Forest (RF), Support Vector Machine (SVM) [8], Decision Tree (DT) [15] and KNN. At last, the majority voting scheme is used to predict the final class of saffron sample [16]. After the completion of training phase, the model gets ready for usage, and accordingly, it is utilized for testing purposes by providing testing set as input. The steps of the proposed SaffNet model are explained in the following subsections.
-
i.
Data pre-processing: In this step the pre-processing of saffron images is done as it is an essential step before implementing any model. During this phase, the changes are applied to the dataset before feeding it to the algorithm, whenever the images are captured from various sources and making the database more accurate and consistent, this phase removes the trivial information of the dataset to obtain the better results. Pre-processing consists of algorithms that can be used for image enhancement and noise removal. By capturing images, data is not too much to train the model we further use some augmentation techniques i.e., flipping, scaling, and rotating to enlarge the size of the dataset. Once the augmentation is done a greater number of images are found and also change their resolution pixels and were saved in the same “JPG” format. For training the model, 111 images as real and 90 images as fake and for the testing phase, 64 images as real and 50 images as fake are given to the model.
Fig. 4 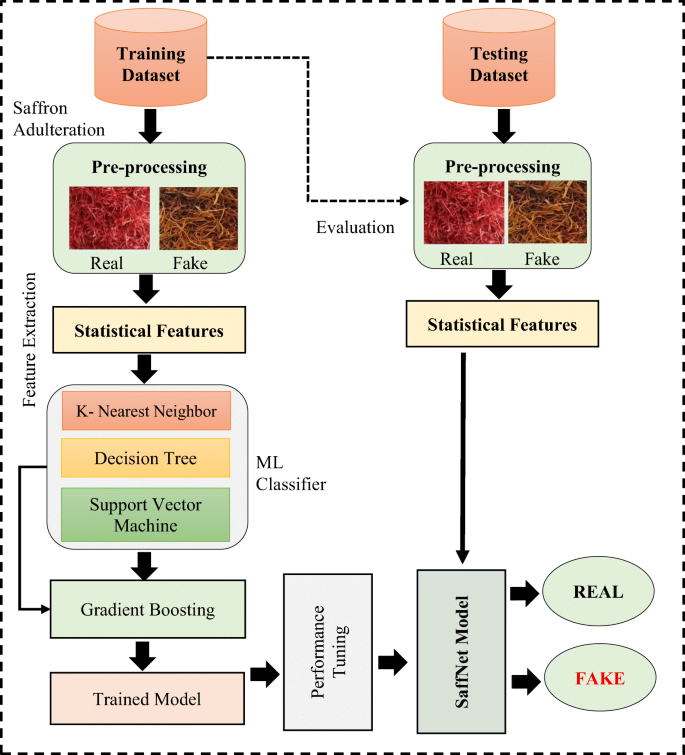
A proposed framework for SaffNet
-
ii.
Statistical Feature extraction: After the preprocessing phase, this step deals with feature extraction process to quantify the surface of the saffron samples through different parameters. In this proposed work, the statistical features are extracted from the Saff-Kash dataset for analyzing the texture of an image. It aims to reduce the number of training features in a dataset by creating new features from existing ones thus increasing the model accuracy. The Statistical-based feature mostly involve in evaluating the link between every input variable and target variable using statistics by choosing those input variables that have a robust relationship with the target variable. The nine statistical features that are used in our proposed model are shown below along with their equations.
-
A.
Inertia_tensor: It gives us an idea about how mass is distributed in a rigid body as shown in Fig. 5. Analogously, we can define the inertia of tensor at a point O, by writing in mathematical form as depicted in eq. 1.
Fig. 5 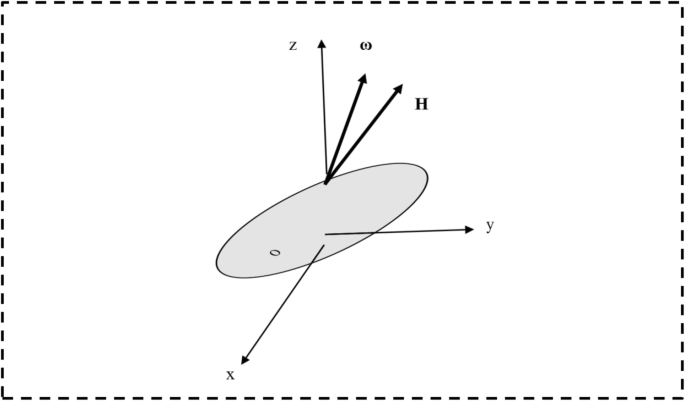
The graphical representation of inertia of tensor
$$ {\mathrm{H}}_{\mathrm{O}}=\left[{\mathrm{I}}_{\mathrm{O}}\right]\boldsymbol{\omega} $$(1)Where [IO] are the moments and products of inertia of tensor about point O. It follows the definition of products of inertia, that the tensors of inertia are always symmetric. The angular momentum vector \( \underset{\mathrm{H}}{\to } \) and Angular velocity vector \( \underset{\omega }{\to } \) are not parallel.
-
B.
Solidity: It is defined as the ratio of pixels in the region to the convex closure of an image. Mathematically it is represented as in eq. 2,
$$ \mathrm{S}=\frac{\boldsymbol{Area}}{\boldsymbol{Convex}\ \boldsymbol{Area}} $$(2) -
C.
Minor Axis Length: Minor axis of an image are separated where two focuses were recognized consequently by ascertaining the most extreme distance between given points in the object vector. It represents the maximum width which is perpendicular to the major axis. It defines the shape of the saffron.
-
D.
Eccentricity: It is the ratio between major axis length and foci of an eclipse. The values lie between 0 and 1 and mathematically it is illustrated in eq. 3.
$$ \boldsymbol{e}=\sqrt{\mathbf{1}}-\frac{{\boldsymbol{b}}^{\mathbf{2}}}{{\boldsymbol{a}}^{\mathbf{2}}} $$(3)Where:
e = eccentricity, b = minor axis and c = major axis
-
E.
We also derive some properties from the grayscale raw image segments. Here, all the features mentioned are just statistics of the grayscale values of images. The inter-quartile range (IQR) is the contrast between the 75th percentile (0.75 quantile) and the 25th percentile (0.25 quantiles). The IQR can be used to detect outliers in the data. These features are computed via 25th Percentile, 75th Percentile, mean intensity, and standard intensity of the image.
-
A.
-
iii.
Classification: The features extracted from the saffron images are used to the train the classification models such RF, SVM, KNN and DT. In this proposed work the various classifiers are used for the correct classification of real and adulterated saffron images. The Decision Tree is used to create a complete dataset, using all the features and variables. In addition to the ensemble classifier i.e., Random Forest is used to selects observations and specific features and variables to build multiple decision trees. The SVM uses nonlinear equation build from the training data for partitioning the dataset. The classification process is halved into training phase and testing phase. Known data is given to training set and unknown is given to testing set. Firstly, the images of saffron dataset are used as an input to the model as shown in Fig. 4. In which the statistical features are extracted from the saffron images and then applied to ML classifiers i.e., KNN. RF, SVM [8] and DT [15]. After that the ensemble classifier [24] namely, Gradient boosting is used, that can predict the value from each of the classifier and select that classifier having the highest vote. This ensemble classifier combines the predictions for each label from the multiple models and the label with the highest majority vote is predicted. This can achieve the better performance of the model compared to another single ensemble classifier. Finally, the binary classification of the images is done, in which the SAPS model correctly predicts and classify the fake and real saffron images.


4.2 Proposed SaffNet algorithms
The proposed algorithms for the training and testing of SAPS model are explained below along with their description:

Training the SaffNet
The algorithm for the training of the SaffNet model is shown above, in which the input given to the model is Ds i.e., training dataset and it returns the output as SaffNet model. Initially, for the training of the proposed framework, there is ‘n’ number of images in the training dataset Ds. For all the n images in the dataset, the preprocessing is done which performs the augmentation like, flipping, rotating, and scaling of images. Then a new augmented dataset is created named ADs, which contains the L number of images. For all the L images in the ADs, perform feature extraction steps like the extraction of statistical features which are total nine in number like, the inertia of tensor, minor axis length, solidity, eccentricity, 25th percentile, 75th percentile, mean intensity, standard deviation intensity, and IQR. These statistically selected features are extracted and stored in the Feature vector FV[k]. After the completion of the feature extraction step, applying a machine learning classifier such as SVM and Random Forest and named as c1 and c2 simultaneously. And the ensemble classifier Gradient boost is used for the deployment, which returns the SaffNet model as output.

Testing of the SaffNet model
After the completion of the training process, next is the testing of the SaffNet model. In which the input given to the model is testing dataset i.e., Tn and SaffNet model (which has been already trained in the above training algorithm). And the output we got from the testing of the SaffNet model is the two classes i.e., pure and adulterated. The testing dataset consists of ‘m’ number of images. For all the ‘m’ images in the dataset apply the preprocessing step which performs the augmentation by flipping, rotating, and scaling the images in the dataset. After that apply the feature extraction step, which can extract the statistical features from the dataset and then SaffNet model can be used for the prediction of the labels of all the images present in the testing dataset and calculate the performance evaluation like accuracy, score, etc. The accuracy of a model is calculated by comparing the actual labels with that of predicted labels and in the last it returns accuracy of the model.
5 Results and analysis
To evaluate the performance of SaffNet model, the experimental results are accomplished on the self-created dataset i.e., Saff-Kash. In this section the experimental analysis of the SaffNet model is shown such as the results and analysis from the image processing operations and the experiments of the various ML classifier on distinct dataset ratios. Finally, the comparative analysis is done and the results are compared with the existing techniques using the Saff-Kash dataset. The SaffKash model is implemented on Nvidia K80 / T4 GPU server with a RAM of 12GB / 16GB. The SaffNet model is implemented in Python Jupyter notepad environment via various packages such as computer vision (cv2), pandas, scikit learn, matplotlib, and numpy.
5.1 Image preprocessing operations
After the data collection part, now preprocessing of data takes place, in which processing of saffron images takes place like, colored images converted to grayscale after that, preprocess the image by binarizing it by using the otsu threshold method, and after that cleaned it using the closing morphological operations. Figure 6 shows the preprocessing of images, where the rgb saffron images are converted into grayscale image by using function rgb2gray.

Pre-processing of Saff-Kash dataset images, a) RGB image and b) grayscale image
5.1.1 RGB to grayscale saffron image
5.1.2 Finding various regions in the binary saffron images
The Fig. 7 shows the binary image having different regions that scale from 0 to 1000 color values. The conversion of grayscale to the binary image is by applying the OTSU threshold method, which converts the grayscale image to binary images and that separates the pixels of images into two classes (one is foreground and another one is background). The OTSU threshold method involves iterating through all the possible threshold values and then select the optimal threshold value for the input image. The different regions of the images are shown using the function region_props. It shows the various properties of the images.

Preprocessing of saffron images a) binary image and b) different regions of binary image
5.1.3 The distribution of the categories (real and fake)
The distribution of two categories of saffron i.e., real and fake is shown in Fig. 8a. In which the total number of fake images present in Saff-Kash dataset are 140 i.e., (90 + 40 = 140), where in 90 are the fake images present in the training set and 40 are the fake images of testing set. As for the real images, the total samples are 175 i.e., (111 + 64 = 175). In which the 111 images are the real images that are present in the training set and 64 are the saffron real images present in the testing set. Whereas, Fig. 8b shows the distribuition of Saff-Kash datatset.

A graphical distribution of Saff-Kash dataset a) real and fake saffron images b) region-based distribution of samples
5.2 Experimental analysis
This section discusses the various experiments performed on Saff-Kash dataset such as the hyper tuning of SaffNet model to find the optimal parameters in order to increase the accuracy of proposed approach. In addition, performance on known and unknown samples is evaluated based on distinct dataset ratios such as 80:20, 70:30 and 60:40. Finally, the comparative analysis of SaffNet model is performed with existing state-of-the-art techniques.
5.2.1 Hyper tuning of SaffNet model
The hyper tuning of SaffNet model is done to increase the performance of model in terms of accuracy and loss by choosing the optimal parameters. The proposed model is trained on each hyper-parameter to achieve satisfactory performance. The various parameters that are used for performance evaluation are value of k in KNN, max_depth and criterion in DT, n_estimators and max-depth in Gradient Boosting, n_estimators, criterion, and max-depth in RF and value of c and Kernel in SVM. The various search space that are used to tune the performance of model is depicted in Table 2
5.2.2 Optimal parameters of SaffNet model
The selection of optimal parameters after hyper-tuning of model is depicted in Table 3 in which the performance of SaffNet model is evaluated in terms of accuracy and loss. The inference from Table 3 shows that SaffNet model achieves better performance on search space such as k, n_estimators, max_depth, value of c and kernel. These selected optimal parameters were used for testing the performance of SaffNet model on unknown samples.
5.2.3 Experiments on different dataset ratios
The three experiments are conducted on SaffNet model with different dataset ratios as shown in Tables 2, 3, 4. In which the various parameters are used like dataset ratio, accuracy, precision, recall, F1 score, and, execution time. Based on those parameters the performance comparison of all the experiments is performed. These below are the detailed description of the experiments conducted on the SaffNet model.
-
Experiment 1:
Dataset ratio (80:20)
In experiment 1, the dataset ratio is 80:20, where the dataset used for training is 80% and for testing its 20%. From Table 4, it is shown that the highest accuracy i.e., 0.98 obtained by the gradient boosting classifier. On the other hand, for the SVM, decision tree, and random forest, the accuracy is 0.86, 0.70, and 0.734. But for the execution time, random forest requires less time i.e., 4.8 milliseconds for execution, whereas, SVM takes more time for execution i.e., 8.56 m-seconds compared to random forest and KNN.
Table 4 SaffNet evaluation on Saff-Kash dataset ratio (80:20) -
Experiment 2:
Dataset ratio (70:30)
In experiment 2, the dataset ratio is 70:30, where the dataset used for training is 70% and for testing its 30%. From Table 5, it is shown that the highest accuracy i.e., 0.85 obtained by the Support vector machine classifier. In the case of the combination of gradient boosting, decision tree, and random forest, the accuracy is 0.75, 0.610, and 0.611. But for the execution time, random forest requires less time i.e., 8.14 mseconds for execution, whereas, SVM takes more time for execution i.e., 9.4 m-seconds compared to random forest and KNN.
Table 5 SaffNet evaluation on Saff-Kash dataset ratio (70:30) -
Experiment 3:
Dataset ratio (60:40)
In experiment 3 the dataset ratio is 60:40, where the dataset used for training is 60% and for testing its 40%. From Table 6, it is shown that the highest accuracy i.e., 0.86 obtained by the Support vector machine classifier. In the case of gradient boosting, decision tree, and random forest, the accuracy is 0.66, 0.547, and 0.71. But for the execution time, random forest requires less time i.e., 5.54 milliseconds for execution, whereas, SVM takes more time for execution i.e., 9.4 milli-seconds compared to random forest and KNN.
Table 6 SaffNet evaluation on Saff-Kash dataset ratio (60:40) At last, from all the three experiments the highest accuracy obtained in the ratio 80:20, i.e., 0.87 for SVM, 0.714 for Random Forest, 0.62 for KNN, 0.70 for Decision Tree and 0.82 for Gradient boosting. But for the execution time, the Random Forest classifier requires very less amount of time for the execution compared to other three classifiers.
The ROC curve as shown in Fig. 9a depicts that SVM has higher area under curve than KNN. Therefore, the support vector machine did a better task of classifying the positive class in the saffron dataset and for Fig. 9b, the roc curve between gradient boosting and Random Forest shows that for Random Forest the ROC curve is higher than the Gradient boosting curve. Therefore, the Random Forest did a better task of classifying the positive class in the saffron dataset.
Fig. 9 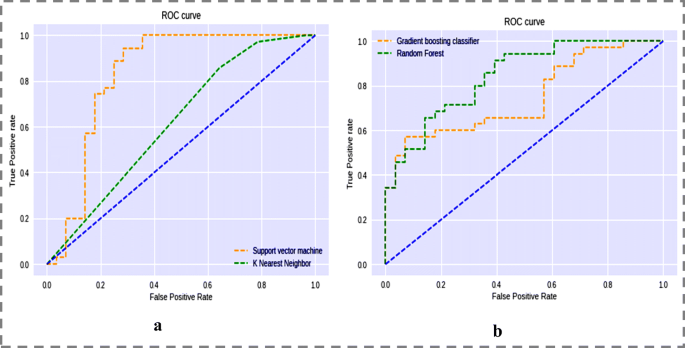
The ROC curve a) SVM versus KNN for SaffNet and b) gradient boosting classifier versus Random Forest for SaffNet

5.3 Comparative analysis
The comparative analysis of existing techniques with our proposed work is shown in Table 7. The classifiers used in the existing techniques show less accuracy except for the KNN as compared to our proposed SaffNet model. The table indicates that the SVM and Gradient Boosting is the best model among all other models in the proposed system. It has better accuracy, recall, F1, precision and takes less execution time. But for the execution time, the Random Forest classifier requires a very little amount of time for the execution compared to the other three classifiers. We can conclude that gradient boosting is showing the best classification accuracy of 98% and SVM shows 87%.
6 Conclusion and future directions
In this research work, we developed a novel Saffnet model for discriminating the adulterated and real saffron threads. The SaffNet is evaluated on a newly created saffron dataset namely; Saff-Kash in different experimental setup. Our model employs statistical features from the saffron images to learn various classifiers such as RF, DT, SVM, GB and KNN. The trained SaffNet model is tested on the unseen saffron samples and the experimental results reveals that the model can accurately classifies the saffron images as authentic (real) and adulterated (fake) class. Besides, the results demonstrate that the SaffNet model achieves better performance on SVM and gradient boosting classifier with dataset ratio of 80:20 compared to other classifiers. The accuracy for gradient boosting ensemble-based model is 98% and for the SVM, it is 87%. The performance of SaffNet is better as compared to the existing techniques and the results exhibit that the area under curve for SVM and gradient boosting is higher than the other classifiers (i.e., KNN, and decision tree, random forest). Moreover, the execution time taken by the SaffNet model for training the SVM classifier is 8.56 milliseconds whereas 7.7 milliseconds for the gradient boosting ensemble. The future work will focus on the expansion of Saff-Kash dataset for training more robust deep learning models. We may also use the latest notion of transformers for classification of the saffron images as authentic or adulterated. Moreover, the concept of transfer learning or incremental learning may be explored in future for the development of a hybrid model. Additionally, a real-time application of the SaffNet will be developed so that it can be used as a mobile application.
Data availability
The datasets used/generated during and/or analyzed during the current study are available from the corresponding author on reasonable request.
References
Ahmed SA, Husaini AM (2021) Investigating binding potential of carotenoid pathway bioactive molecules for ACE2 receptor of SARS-CoV-2: possibility of a saffron based remedy for novel coronavirus! J. Hort. Postharvest res. 4, 69–78. https://doi.org/10.22077/jhpr.2021.4462.12
Amin J, Selwal A Sabha A (2021) SAPS: Automatic Saffron Adulteration Prediction Systems, research issues, and prospective solutions. 2021 Fourth International Conference on Computational Intelligence and Communication Technologies (CCICT). pp. 64–71 https://doi.org/10.1109/CCICT53244.2021.00024
Azarabadi N, Özdemir F (2018) Determination of Crocin Content and Volatile Components in Different Qualities of Iranian Saffron. Gida / J. Food, no. May, pp. 476–489. https://doi.org/10.15237/gida.gd18018
Dowlatabadi R, Farshidfar F, Zare Z, Pirali M, Rabiei M, Khoshayand MR, Vogel HJ (2017) Detection of adulteration in Iranian saffron samples by 1H NMR spectroscopy and multivariate data analysis techniques. Metabolomics 13(2):1–11. https://doi.org/10.1007/s11306-016-1155-x
Gohari AR, Saeidnia S, Mahmoodabadi MK (2013) An overview on saffron, phytochemicals, and medicinal properties. Pharmacogn Rev 7(13):61–66. https://doi.org/10.4103/0973-7847.112850
Heidarbeigi K, Mohtasebi SS, Foroughirad A, Ghasemi-Varnamkhasti M, Rafiee S, Rezaei K (2015) Detection of adulteration in saffron samples using electronic nose. Int J Food Prop 18(7):1391–1401. https://doi.org/10.1080/10942912.2014.915850
Huang WJ, Li FF, Liu YJ, Long CL (2015) Identification of Crocus sativus and its adulterants from Chinese markets by using DNA barcoding technique. Iran J Biotechnol 13(1):36–42. https://doi.org/10.15171/ijb.1034
Huang X, Maier A, Hornegger J, Suykens JAK (2017) Indefinite kernels in least squares support vector machines and principal component analysis. Appl Comput Harmon Anal 43(1):162–172. https://doi.org/10.1016/j.acha.2016.09.001
Husaini AM, Wani AB (2020) Prospects of organic saffron kitchen gardens as a source of phytochemicals for boosting immunity in common households of semi-arid regions: a case study of trans-Himalayan Kashmir valley. J. Pharmacogn. Phytochem. 9, 237–243. https://doi.org/10.22271/phyto.2020.v9.i6d.12889
Husaini AM et al (2009) Bioinformatics for saffron (Crocus sativus L.) improvement. Commun Biometry Crop Sci 4(1):3–8
Husaini AM, Jan KN, Wani GA (2021) Saffron: a potential drug-supplement for severe acute respiratory syndrome coronavirus (COVID) management. Heliyon 7:e07068. https://doi.org/10.1016/j.heliyon.2021
Husaini AM, Ul Haq SA, Jiménez AJL (2022) Understanding saffron biology using omics- and bioinformatics tools: stepping towards a better Crocus phenome. Mol Biol Rep 49:5325–5340. https://doi.org/10.1007/s11033-021-07053-x
Jafari A, Bakhshipour A, Hemmatian R (2014) Integration of Color Features and Artificial Neural Networks for In-field Recognition of Saffron Flower. Iran Agric Res 33(1):1–14. https://doi.org/10.22099/iar.2014.2376
Javanmardi N, Bagheri A, Moshtaghi N, Sharifi A, and Kakhki AH (2011) Identification of Safflower as a fraud in commercial Saffron using RAPD / SCAR marker. vol. 3, no. February 2015. pp. 31–37
Kamiński B, Jakubczyk M, Szufel P (2018) A framework for sensitivity analysis of decision trees. Cent Eur J Oper Res 26(1):135–159. https://doi.org/10.1007/s10100-017-0479-6
M. Kuhn and K. Johnson (2013) Applied predictive modeling with applications in R
Lu X, Xia Z, Qu F, Zhu Z, Li S (2019) Identification of authenticity, quality and origin of saffron using hyperspectral imaging and multivariate spectral analysis. Spectrosc Lett 53:1–10. https://doi.org/10.1080/00387010.2019.1693403
Maggi L, Carmona M, del Campo CP, Kanakis CD, Anastasaki E, Tarantilis PA, Polissiou MG, Alonso GL (2009) Worldwide market screening of saffron volatile composition. J Sci Food Agric 89(11):1950–1954. https://doi.org/10.1002/jsfa.3679
Minaei S, Kiani S, Ayyari M, Ghasemi-Varnamkhasti M (2017) A portable computer-vision-based expert system for saffron color quality characterization. J Appl Res Med Aromat Plants 7(October):124–130. https://doi.org/10.1016/j.jarmap.2017.07.004
Mohamad I, Shukla SK, Shakeel W Rapid Detection of Adulteration in Indigenous Saffron of Kashmir Valley, India. Res J Forensic Sci Res J Forensic Sci 3(3):232
Mohamadzadeh Moghadam M, Taghizadeh M, Sadrnia H, Pourreza HR (2020) Nondestructive classification of saffron using color and textural analysis. Food Sci Nutr 8(4):1923–1932. https://doi.org/10.1002/fsn3.1478
Naga Srinivasu P, Ahmed S, Alhumam A, Bhoi Kumar A, Fazal Ijaz M (2021) An aw-haris based automated segmentation of human liver using ct images. Comput, Mater Continua 69(3):3303–3319
Parastar H, van Kollenburg G, Weesepoel Y, van den Doel A, Buydens L, Jansen J (2020) Integration of handheld NIR and machine learning to “measure & monitor” chicken meat authenticity. Food control, 112, article 107149
Polikar R (2006) Ensemble based systems in decision making. IEEE Circuits Syst Mag 6(3):21–44. https://doi.org/10.1109/MCAS.2006.1688199
Shukla SK, Iqbal M(2015) Orensic Analysis of the Saffron : Rapid vol. 3, no. Iv
Singh SP, Kumar C, Kachroo J, Singh H, Hamid N, Kumar N (2016) An Economic Analysis of Mushroom Marketing in Jammu and Kashmir. Indian J Econ Dev 12(3):587. https://doi.org/10.5958/2322-0430.2016.00180.3
Varliklioz Er S, Eksi-Kocak H, Yetim H, Boyaci IH (2017) Novel spectroscopic method for determination and quantification of saffron adulteration. Food Anal Methods 10(5):1547–1555. https://doi.org/10.1007/s12161-016-0710-4
Zhou L, Zhang C, Liu F, Qiu Z, He Y (2019) Application of deep learning in food: a review. Compr Rev Food Sci Food Saf 18(6):1793–1811. https://doi.org/10.1111/1541-4337.12492
Shawky E, Abu El-Khair RA, Selim DA (2020) NIR spectroscopy-multivariate analysis for rapid authentication, detection and quantification of common plant adulterants in saffron (Crocus sativus L.) stigmas. LWT, 122, 109032.
Author information
Authors and Affiliations
Corresponding author
Ethics declarations
Competing interest
All the authors declare that they do not have any conflict of interest.
Additional information
Publisher’s note
Springer Nature remains neutral with regard to jurisdictional claims in published maps and institutional affiliations.
Appendix
Appendix
Rights and permissions
Springer Nature or its licensor (e.g. a society or other partner) holds exclusive rights to this article under a publishing agreement with the author(s) or other rightsholder(s); author self-archiving of the accepted manuscript version of this article is solely governed by the terms of such publishing agreement and applicable law.
About this article

Cite this article
Amin, J., Selwal, A. & Sabha, A. SaffNet: an ensemble-based approach for saffron adulteration prediction using statistical image features. Multimed Tools Appl 82, 31445–31465 (2023). https://doi.org/10.1007/s11042-023-14934-9
Received:
Revised:
Accepted:
Published:
Issue Date:
DOI: https://doi.org/10.1007/s11042-023-14934-9