
Abstract
The distance education system was widely adopted during the Covid-19 pandemic by many institutions of learning. To measure the effectiveness of this system, it is essential to evaluate the performance of the lecturers. To this end, an automated speech emotion recognition model is a solution. This research aims to develop an accurate speech emotion recognition model that will check the lecturers/instructors’ emotional state during lecture presentations. A new speech emotion dataset is collected, and an automated speech emotion recognition (SER) model is proposed to achieve this aim. The presented SER model contains three main phases, which are (i) feature extraction using multi-level discrete wavelet transform (DWT) and one-dimensional orbital local binary pattern (1D-OLBP), (ii) feature selection using neighborhood component analysis (NCA), (iii) classification using support vector machine (SVM) with ten-fold cross-validation. The proposed 1D-OLBP and NCA-based model is tested on the collected dataset, containing three emotional states with 7101 sound segments. The presented 1D-OLBP and NCA-based technique achieved a 93.40% classification accuracy using the proposed model on the new dataset. Moreover, the proposed architecture has been tested on the three publicly available speech emotion recognition datasets to highlight the general classification ability of this self-organized model. We reached over 70% classification accuracies for all three public datasets, and these results demonstrated the success of this model.
1 Introduction
The Covid-19 outbreak has been spreading rapidly around the globe since December 2019. It has changed many things, including how people had to live their lives [39, 41]. One of the areas where these changes are seen the most is in the educational system, where the face-to-face learning system has been replaced with distance learning or the e-learning system [34]. Learning in distance education is carried out via different digital platforms. Through these platforms, the lecturer could deliver his lectures to students in an audio and/or video manner [2, 9]. Hence, a human-computer interaction (HCI)-based system can be essential in making the e-learning system very effective. Speech emotion recognition (SER) is widely used in the literature to evaluate the interaction of people through HCI systems [35, 37]. SER provides information about the emotional state of a speaker. This is why it is widely employed in HCI systems to enhance human-like interactions between humans and systems. SER systems have wide applications such as call centers, the medical field, forensic sciences, and intelligent systems [22, 24, 46].
Paralinguistic features of speech can be obtained in speech-based systems and used as features to classify emotions embedded in those speeches. Paralinguistic features essential for SER systems include speech properties like the accent, pitch, speech rate, modulation, volume, etc. Paralinguistic information such as emotion, body language, mood, facial expressions is non-verbal [14, 46]. SER-based systems in most literature focused mainly on verbal paralinguistic information to achieve a more effective and helpful SER system [19].
In this study, a new dataset is collected as sound samples from lecturers while giving lectures in an e-learning platform from a digital forensics lecture notes we prepared. The primary purpose of this study is to recognize the emotions displayed by the lecturers from their speech and use it to determine the quality of the lecture delivered. In addition, this system can be used for the evaluation of the lecturer’s performance. Details of the proposed SER system are presented in subsections.
While the basic human emotions are happy, sad, fear, disgust, surprise, anger, calm, and neutral, to tailor the application of the SER system to a distance education system, we narrowed the emotions down to 3 different emotions which are (i) Positive (ii) Negative (iii) Neutral. These emotions are used to classify a lecture as either interesting, boring, and neutral, respectively. To attain our aim, we proposed two novel methods. These are 1D-OLBP and smart, multiple filters based on multi-level wavelet transform. The proposed 1D-OLBP and smart wavelet transform-based SER model achieved 93.40% accuracy. This research contributes to knowledge in the following ways:
-
SER is one of the hot topics of research issues for machine learning, especially in its application to distance learning which is gaining attention nowadays. For this purpose, a new dataset is collected, which further increases the available speech emotion recognition database.
-
DWT [21, 40] has often been the preferred signal decomposition method for feature generation. In DWT, it is required to choose a filter and the number of levels from which features are extracted. However, This is blind feature extraction. Therefore, our research employed a novel smart multiple filters-based multi-level wavelets transform method to improve the DWT method. It is a suitable wavelet coefficient selection technique. In addition, a 1D-OLBP is proposed as the primary feature generation function. An effective feature generator is produced by deploying this wavelet coefficient selector and 1D-OLBP.
2 Related works
Many different studies have been carried out on SER. Fayek et al. [13] proposed a method for SER based on a multi-layered neural network. The IEMOCAP dataset was used in this study. An accuracy of 64.78% was achieved, and an unweighted average recall ratio of 60.89% was obtained. Pan et al. [32] suggested a system for automatic emotion recognition. This study used energy, Mel-frequency spectrum coefficients, linear predictive spectrum coding, and Mel-energy spectrum dynamic coefficients to classify three emotional states (sad, happy, and neutral) from EMO-DB and Chinese emotional datasets. The accuracy achieved for EMO-DB and Chinese emotional database is 95.10% and 91.30, respectively. Mirsamadi et al. [30] presented a speech emotion recognition model based on deep recurrent neural networks. They tested the model with the IEMOCAP dataset to classify four emotions: neutral, happy, angry, and sad. Unweighted and weighted accuracies of the model are 58.80%, and 63.50%, respectively. In a different study, Mao et al. [27] came up with an automatic technique for SER that is built on a convolutional neural network (CNN). The primary purpose of this study is to obtain salient features for SER. In this study, SAVEE, EMO-DB, Danish Emotional, and Mandarin Emotional Speech datasets were used. The accuracy rate was evaluated for these datasets as 71.80%, 57.20%, 60.40%, and 57.80%. Ramakrishnan and Emary [35] presented a study to examine the acoustic characteristics of audio signals for SER. EMO-DB and Danish Emotional datasets were used for the evaluation of this model. EMO-DB contains seven emotions, while the Danish Emotional dataset has five emotions. Recall, recognition rate, precision, F-measure parameters were analyzed and recorded. Zhao et al. [49] suggested a method that uses a 1D-2D convolutional neural network with a long short-term memory and deep belief network methods for SER. The study utilizes the IEMOCAP dataset. An Accuracy rate was calculated for a speaker-independent and speaker-dependent dataset when used with the proposed method and were found to be 89.16% and 52.14%. Tzirakis et al. [43] proposed a model using deep neural networks for SER. The baseline of the network is a Convolutional Neural Network architecture and a Long Short-Term Memory method to obtain the contextual information in the data. Using the RECOLA dataset, the results are presented comparatively. Bastanfard et al. [5] used the Gaussian Mixture model and universal background model for speaker age detection. For this purpose, NIST 2004–2005-2008 datasets were utilized. They calculated a mean absolute error of 5.14 and a Pearson correlation of 0.8. Kalhor and Bakhtiari [20] presented a multitask approach for SER. The aim of this study is speaker-independent feature selection. For this purpose, ENTERFACE (43 English speakers) and EMO-DB (10 German speakers) datasets were used. They attained accuracy values of 78.62% and 76.68% for ENTERFACE and EMO-DB datasets. Pawar and Kokate [33] used Mel-frequency Cepstrum coefficients and a Convolution neural network for automatic SER. They collected 500 utterances from 51 males and 60 females. The accuracy value was calculated as 93.89%. Agarwal and Om [1] suggested a SER method. Their method was based on deep learning techniques. They achieved accuracy values of 97.85%, 97.14% and 93.75% for TESS, RAVDESS and IITKGP-SEHSC datasets. Seo and Lee [38] proposed a conformer based model for SER. For this purpose, the IEMOCAP dataset was used. Unweighted accuracy was calculated as 70.0% for arousal.
3 Speech emotion dataset
In this work, a new SER dataset is collected. The dataset is segmented into 7101 sounds with a length of five seconds per segment. The sounds are collected using different mobile phones with a single channel. The speeches are collected from 18 lecturers (8 females and 10 males) and stored in acc, m4a, mp3, mp4, Ogg, and AMR audio formats. The mean age of the lecturers was 32.8 ± 4.20. The dataset was collected in three different categories: negative (−1), positive (+1), and neutral (0). We used a prepared lecture note for the collection of this dataset. The speakers gave the lectures in the Turkish language for a minimum of 10 minutes. The collected speeches were divided into five-second segments, with each segment properly labeled with its embedded emotion. There are 2473 negative (−1) emotions, 2231 neutral (0) emotions, and 2397 positive (+1) speech emotions. The distribution of the collected dataset per the categories is shown in Fig. 1 below.

Distribution of the collected dataset according to emotions
4 The proposed method
The baseline model in this research work is a 1D-OLBP and NCA-based model used in feature generation. The model generates a multi-level feature. The following steps extract the most informative features in this multi-level feature extraction phase.
-
Step 1: Create multi-level wavelet sub-bands from three primary wavelet functions,
-
Step 2: Generate 512 features using 1D-OLBP from the generated wavelet subbands and raw speech signal.
-
Step 3: Calculate the accuracy of each sub-band and raw speech signal.
-
Step 4: Select the eight most valuable sub-bands.
-
Step 5: Extract features from the eight (8) selected sub-bands.
-
Step 6: Concatenate the extracted features.
After following these six steps, 512 × 8 = 4096 features are generated from the speech signals. NCA was employed as a feature selection technique to select the 512 most informative/discriminative features in the feature selection phase. A classification technique of support vector machine (SVM) [44] is then employed to classify the emotions based on the selected 512 features. In the classification phase, the optimal hyperparameters of the SVM classifier are tuned using optimizable SVM. The idea behind the proposed model is to;
-
Develop an effective feature generator technique,
-
Come up with an intelligent DWT technique that will select the best performing sub-band,
-
Selecting the most valuable features from the generated features,
-
Using the most appropriate classifier to solve the SER problem.
Below is the schematic diagram that explains the model presented in this work (Fig. 2).

Schematic expression of the presented automatic SER model for a distance education platform
Each speech (lecture) is divided into segments with a length of five seconds per segment. Nine-level wavelet filters were deployed using Daubechies 4 (db4), symlet 4 (sym4), and haar mother wavelet function to create a total of 9 × 3 = 27 wavelet sub-bands. The sub-bands were evaluated in the sub-band selection phase, and the best eight out of 28 sub-bands were selected. The 1D-OLBP method was then applied to extract 512 features from each chosen signal. The extracted features from each signal are merged in the feature merging phase to give 4096 features. NCA was now employed to select the most 512 informative/relevant features out of the 4096 features. The selected 512 features were then classified using an SVM classifier.
4.1 Feature extraction
Our proposed feature generation model has two main stages. Stage one involves the selection of the eight most relevant signals from the generated 28 signals from the sub-bands. The second stage consists of the generation of features from the selected eight signals. Both steps are implemented using a feature generation function known as 1D-OLBP.
4.1.1 One-dimensional orbital local binary pattern
1D-OLBP is an improved version of the one-dimensional local binary pattern technique. It generates 512 features from each speech signal or wavelet coefficient of the used speech signal. The steps for the implementation of the 1D-OLBP are given below.
-
1: Create L − 24 25 sized windows from a one-dimensional signal (S) with a length of L.
$${w}^i(j)=S\left(i+j-1\right),j\in \left\{1,2,\dots, 25\right\},i\in \left\{1,2,\dots, L-24\right\}$$(1)
where wi defines ith overlapping block with a length of 25.
-
2: Apply vector to matrix transformation to each wi to achieve the orbital LBP pattern.
$$m{t}^i\left(f,g\right)={w}^i(j),f\in \left\{1,2,\dots, 5\right\},g\in \left\{1,2,\dots, 5\right\}$$(2)
where mti defines ith matrix 5 × 5 sized, and Eq. 2 explains vector to matrix transformation. The presented pattern is shown in Fig. 3.

The pattern of the orbital LBP. Herein, p and Q denote first and second orbit values, respectively. C is the center value
-
3: Generate binary features by deploying the orbital pattern (see Fig. 3) and signum function.
$$bp(k)= sg\left({p}_k,C\right),k\in \left\{1,2,\dots, 8\right\}$$(3)$$bQ(k)= sg\left({Q}_k,C\right)$$(4)$$sg\left(x,C\right)=\left\{\begin{array}{c}0,x-C\le 0\\ {}1,x-C>0\end{array}\right.$$(5)
Where, bp, bQ and sg(., .) are bits of first orbits, bits of the second orbit, and signum function.
-
4: Create two map signals using the extracted binary features. By using signum function, the binary features have been extracted from p and Q values.
$$mp(i)={\sum}_{k=1}^8 bp(k)\times {2}^{k-1}$$(6)$$mQ(i)=\sum \limits_{k=1}^8 bQ(k)\times {2}^{k-1}$$(7)
Equations 6–7 define binary to decimal conversion. By using binary to decimal transformation, two map signals (mp, mQ) have been generated.
-
5: Extract histograms of the generated two feature signals.
-
$$hp=\gamma (mp)$$(8)
-
$$hQ=\gamma (mQ)$$(9)
Herein, hp and hQ are histograms of mp and mQ signals and γ(.) is histogram extraction function. The length of each histogram is equal to 256 (=28).
-
6: Merge these histograms extracted to obtain feature vector.
$$ft(j)= hp(j),j\in \left\{1,2,\dots, 256\right\}c$$(10)$$ft\left(j+256\right)= hQ(j)$$(11)
where ft is the feature vector with a length of 512 (=256 × 2).
The main objective this feature extraction function is to extract textural features from a speech signal since textural features are valuable for classification noises. As stated from literature, hand-crafted features are valuable for speeches [36]. Therefore, we want to demonstrate textural features effect on the speech emotion classification. Moreover, we collected a new dataset for speech emotion classification.
The six steps above defined the 1D-OLBP function, which extracts 512 features from the one-dimensional speech signal.
4.1.2 Sub-band signal selection for feature generation
The main aim of this stage is to select the appropriate wavelet coefficients or speech signals for feature extraction. It is an intelligent implementation of DWT to choose the best performing sub-bands. The implementation steps for this phase are:
-
Step 1: Generate 27 wavelet sub-bands using three mother wavelet functions with nine leveled wavelet filters for signal decomposition.
-
Step 2: Extract 512 features by applying 1D-OLBP to each wavelet sub-band and raw speech signal.
-
Step 3: Calculate misclassification rates of the generated 28 feature vectors (with a size of 7101 × 512) using an SVM classifier with five-fold cross-validation.
A plot of the misclassification rate per feature vector is shown in Fig. 4.
Fig. 4 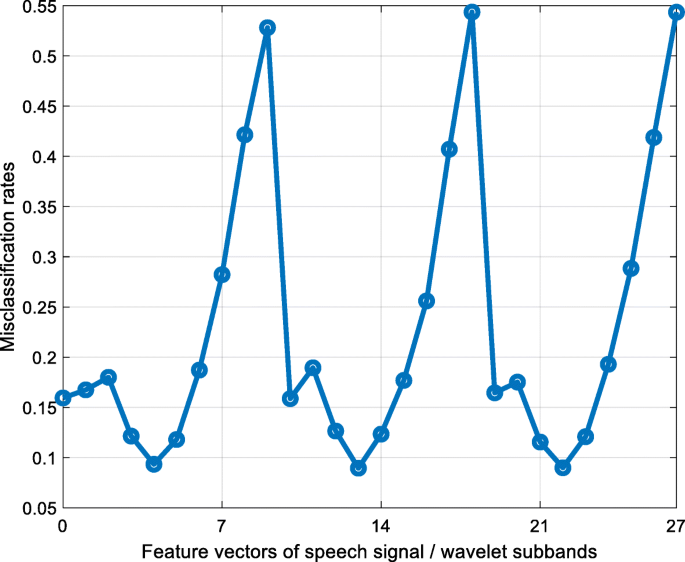
The calculated misclassification rates using the generated 28 feature vectors. 0th feature vector is generated features from the speech signal, and others are generated feature vectors from wavelet sub-bands
-
Step 4: Select the eight best sub-bands with the best feature vectors according to the results (see Fig. 3). The selected sub-bands feature vectors are the 13th, 22nd, 4th, 21st, 5th, 23rd, 3rd, and 14th wavelet sub-bands.
-
Step 5: Apply 1D-OLBP to selected wavelet sub-bands and generate 512 sized eight feature vectors per sub-band.
-
Step 6: Concatenate these feature vectors and obtain the final feature vector with a length of 4096.
-
Step 7: Apply NCA to the generated features to select the best 512 features for classification.
The NCA method is explained below.

4.2 Feature selection
NCA [15] is applied to select the most discriminative/relevant features from the generated 4096 features. NCA is a feature selection model that utilizes the nearest neighbor relationship. It uses a fitness function (distance-based fitness function), an optimization function (stochastic gradient/mini-batch stochastic gradient), and an iterative weight determination. NCA generates positive weights based on a set threshold value. The lower/minimal weights are considered the redundant features, and higher weights are considered the most informative features. Therefore, they are sorted in descending order. Based on the index, the top 512 weights are selected as the informative and relevant features for the classification.
4.3 Classification
To demonstrate the success of the presented smart wavelet decomposition and 1D-OLBP NCA-based feature generation and selection techniques, a shallow classifier is utilized. This classifier is SVM [44, 45]. The selected hyperparameters of the optimizable SVM and Gaussian kernel SVM gave the best result. The tuned hyperparameters are;
-
Kernel: Gaussian,
-
Kernel scale: 2.94,
-
Box constraint level: 581.90,
-
Standardize: False,
-
Validation: 10-fold cross-validation.
The classification stage is the last step in the proposed model. After choosing the classifier and setting or tunning the parameters, we use the classifier to classify the 512 selected features into their embedded emotional classes.
5 Experimental results
5.1 Results of our dataset
Results of the presented 1D-OLBP and NCA-based SER model are given in this section. After applying this model to the dataset, the results are fed to the SVM classifier with 10-fold cross-validation for classification. The overall and class-wise results are given in this section. Accuracy, recall, precision, and F1-score metrics are used to evaluate the performance of our 1D-OLBP and NCA-based SER model. The confusion matrix of the result of the proposed model is shown in Table 1, and the performance evaluation metrics are calculated using the given confusion matrix.
From Table 1, the overall accuracy, unweighted average recall, average precision, and overall F1-score are calculated and recorded in Table 2. below.
In addition, fold-wise accuracies are calculated, and the calculated fold-wise results are shown in Fig. 5.

Fold by fold accuracies of the presented model
As shown in Fig. 5, the best accuracy rate is calculated in the 7th fold, and the computed accuracy rate of the 7th fold is equal to 97.89%. On the other hand, the worst accurate folds are the 1st and 5th folds, and their accuracies are the same (89.86%).
Our proposal is a self-organized feature engineering method that can select the best feature vectors to generate the final feature vector (see Fig. 4 and Table 4). Therefore, this model attained high classification accuracy. Moreover, we applied this model to three publicly available SER datasets, and the results of these datasets have been given below.
5.2 Results of commonly used datasets
To investigate classification performance of our proposed hand-crafted features based model, three publicly available SER datasets have been used, and these datasets are EMO-DB [6], TESS [12], and ShEMO [31]. These datasets have been used to demonstrate the high classification ability of the proposed model. EMO-DB contains 535 speeches in German with seven classes, TESS contains 2800 speeches in English with seven classes, and ShEMO contains 3000 speeches in Persian with 6 emotions. The calculated confusion matrices of these datasets have been given in Fig. 6.

Confusion matrices of the EMO-DB and TESS datasets. Enumerated emotions for a 1: Anger, 2: Boredom, 3: Disgust, 4: Fear, 5: Happy, 6: Neutral, 7: Sadness, b 1: Angry, 2: Disgust, 3:Fear, 4: Happy, 5: Neutral, 6: Sad, 7: Suprise
By using these confusion matrices, the performance evaluation metrics have been calculated and these metrics have been tabulated in Table 3.
Moreover, we have tested our model on the Persian SER (ShEMO) dataset. Our calculated confusion matrix is given below (Fig. 7).

Confusion matrix of the ShEMO dataset. Herein, 1: Angry, 2: Happy, 3: Fear, 4: Neutral, 5: Sadness, 6: Surprise
Table 3 highlights that our proposal achieved high classification performance on three publicly available datasets. Table 3 depicts that our proposal attained the best classification performance on the TESS dataset and the worst classification accuracy was calculated on the ShEMO dataset. The ShEMO dataset is an unbalanced dataset, and there are variable-sized speeches. Therefore, the classification of this dataset is hard. Also, our proposal attained 55.76% UAR – UAR is very important to evaluate the unbalanced dataset. Liu et al. [25] presented a formant characteristic-based SER model and they attained 52.08% UAR and 70.53% accuracy. While our proposal attained 55.76% UAR and 73.60% classification accuracy.
6 Discussions
The model presented here for feature generation is novel and, at the same time, simple. It is built on existing frameworks of DWT and an LBP-like feature extractor. However, we introduced smart DWT and the 1D-OLBP-based speech classification method in this work. This model is a self-organized model since it can select the most suitable wavelet bands to extract features. We collected a new speech emotion dataset and this dataset was collected from lecturers. This dataset was labeled as high arousal/valance (positive), low arousal/valance (negative), and neutral. Therefore, it is a polarization dataset. The presented 1D-OLBP is a hand-modeled feature generator that can extract only low-level features like other hand-modeled feature generators. To generate a high-level feature, We used a signal decomposition method. DWT has been a commonly used decomposer to extract both high and low-level features. The whole sub-bands of the DWT have often been used for the feature generators. We introduced a sub-band selection model that selects the best sub-bands for feature generation to use DWT cognitively. The 1D-OLBP is an improved version of the one-dimensional local binary pattern (1D-LBP). We applied three channeled mother filters in DWT to decompose the signals into 27 sub-bands, 28 feature vectors were evaluated using the 1D-OLBP and SVM methods. The best eight bands are selected for feature generation. NCA is employed to choose the most relevant 512 features. To demonstrate the classification capability of the presented model, we calculated accuracies from each sub-band and the raw speech signal. The accuracies of the proposed model are listed in Table 4.
In Table 4, the accuracy rates of each channel and the presented model are shown. Herein, three wavelet filters were used to generate wavelet sub-bands. These filters (mother wavelet functions) are haar, db4, and sym4. The fourth bands of the haar filter, db4 filter, and sym4 filters are the best sub-bands, and they are shown using the bold font in Table 3. The best-resulted sub-band is the 13th sub-band (4th level wavelet coefficient using db4 mother wavelet function). It reached 91.06% accuracy. The worst accurate sub-band is the 18th sub-band (9th level wavelet coefficients using db4 filter) with 45.63% accuracy on the collected dataset. 84.06% accuracy was achieved using raw speech signals. The eight top-performing sub-bands are selected, and their features are extracted using our proposed model. After merging the features from the eight sub-bands, we achieved a 93.40% classification accuracy on the collected dataset. These results (see Table 4) indicate that the used smart DWT-based model increases classification capability/accuracy.
The proposed method and other SER classification models are compared in Table 5.
Table 5 presented the results for different databases and different models and compared against our model and dataset with an accuracy of 93.40%. Moreover, we tested EMO-DB, TESS and ShEMO datasets by using our proposal. Our proposal attained 86.14% classification accuracy on the EMO-DB, 99.82% classification accuracy on the TESS datasets and 73.60% overall accuracy on the ShEMO dataset. These results clearly demonstrated that our proposal is a successful and basic SER model.
7 Conclusions
This research presents a novel method of feature generation. It also uses a new speech dataset collected from lecturers while they were giving lectures. These lecturers/Instructors, during their lecture presentations, either exhibit positive, neutral, or negative emotions. Moreover, their lectures are classified as either interesting, neutral, or boring based on the exhibited emotion during the lesson. Our proposed feature generation model performed well to extract the best features from the collected speech dataset to give an accuracy of 93.40% upon classification with SVM. This model uses simple methods of smart DWT, 1D-OLBP, NCA, and SVM.
We hope to collect a more extensive speech dataset from different distance learning platforms to build a more robust model for evaluating lecturers’ performance on these platforms. In addition, layer selection methods, like our proposed sub-band selection method, can be used with deep learning models to increase classification capabilities.
Data availability
Data will be made available on reasonable request to the corresponding authors.
References
Agarwal G, Om H (2021) Performance of deer hunting optimization based deep learning algorithm for speech emotion recognition. Multimed Tools Appl 80:9961-9992
Aini Q, Budiarto M, Putra POH, Rahardja U (2020) Exploring E-learning challenges during the global COVID-19 pandemic: a review. Jurnal Sistem Informasi 16:57-65
Ancilin J, Milton A (2021) Improved speech emotion recognition with Mel frequency magnitude coefficient. Appl Acoust 179:108046
Bandela SR, Kumar TK (2021) Unsupervised feature selection and NMF de-noising for robust Speech Emotion Recognition. Appl Acoust 172:107645
Bastanfard A, Amirkhani D, Hasani M (n.d.) Increasing the accuracy of automatic speaker age estimation by using multiple UBMs. In: 2019 5th conference on knowledge based engineering and innovation (KBEI). IEEE, pp 592–598
Burkhardt F, Paeschke A, Rolfes M, Sendlmeier WF, Weiss B (2005a) A database of German emotional speech. In: Interspeech. pp 1517–1520
Burkhardt F, Paeschke A, Rolfes M, Sendlmeier WF, Weiss B (2005b) A database of German emotional speech. In: ninth European conference on speech communication and technology,Lissabon,Portugal, pp 1517–1520
Busso C et al (2008) IEMOCAP: Interactive emotional dyadic motion capture database. Language resources and evaluation 42:335
Cahyadi A (2020) Covid-19 outbreak and new normal teaching in higher education: empirical resolve from Islamic Universities in Indonesia. Dinamika Ilmu 20:255-266
Chauhan K, Sharma KK, Varma T (2021) Speech emotion recognition using convolution neural networks. In: 2021 international conference on artificial intelligence and smart systems (ICAIS). IEEE, pp 1176–1181
Costantini G, Iaderola I, Paoloni A, Todisco M (2014) EMOVO corpus: an Italian emotional speech database. In: International conference on language resources and evaluation (LREC 2014). European Language Resources Association (ELRA), pp 3501–3504
Dupuis K, Pichora-Fuller MK (2011) Recognition of emotional speech for younger and older talkers: Behavioural findings from the toronto emotional speech set. Can Acoust 39:182–183
Fayek HM, Lech M, Cavedon L (2017) Evaluating deep learning architectures for Speech Emotion Recognition. Neural Netw 92:60–68
Fonnegra RD, Díaz GM (2018) Speech emotion recognition integrating paralinguistic features and auto-encoders in a deep learning model. In: International conference on human-computer interaction. Springer, pp 385–396
Goldberger J, Hinton GE, Roweis S, Salakhutdinov RR (2004) Neighbourhood components analysis Advances in neural information processing systems 17:513–520
Haq S, Jackson PJ (2010) In: Machine audition: principles, algorithms and systems. In: Multimodal Emotion Recognition. IGI Global ch., Hershey PA, pp 398–423
Ilyas O (2021) Pseudo-colored rate map representation for speech emotion recognition. Biomed Signal Process Control 66:102502
Issa D, Demirci MF, Yazici A (2020) Speech emotion recognition with deep convolutional neural networks. Biomed Signal Process Control 59:101894
Jing S, Mao X, Chen L (2018) Prominence features: Effective emotional features for speech emotion recognition. Digit Signal Proc 72:216–231
Kalhor E, Bakhtiari B (2021) Speaker independent feature selection for speech emotion recognition: a multitask approach. Multimed Tools Appl 80:8127–8146
Kambalimath S, Deka PC (2021) Performance enhancement of SVM model using discrete wavelet transform for daily streamflow forecasting. Environ Earth Sci 80:1–16
Kwon S (2021) MLT-DNet: Speech emotion recognition using 1D dilated CNN based on multi-learning trick approach. Expert Syst Appl 167:114177
Latif S, Qayyum A, Usman M, Qadir J (2018) Cross lingual speech emotion recognition: Urdu vs. western languages. In: 2018 international conference on frontiers of information technology (FIT). IEEE, pp 88–93
Li M et al (2021) Contrastive unsupervised learning for speech emotion recognition arXiv preprint arXiv:210206357
Liu Z-T, Rehman A, Wu M, Cao W-H, Hao M (2021) Speech emotion recognition based on formant characteristics feature extraction and phoneme type convergence. Inf Sci 563:309–325
Livingstone SR, Russo FA (2018) The Ryerson audio-visual database of emotional speech and song (RAVDESS): a dynamic, multimodal set of facial and vocal expressions in north American English. PLoS ONE 13:e0196391
Mao Q, Dong M, Huang Z, Zhan Y (2014) Learning salient features for speech emotion recognition using convolutional neural networks. IEEE Trans Multimed 16:2203–2213
Martin O, Kotsia I, Macq B, Pitas I (2006) The eNTERFACE'05 audio-visual emotion database. In: 22nd International Conference on Data Engineering Workshops (ICDEW'06). IEEE, pp 8–8
Meyer P, Xu Z, Fingscheidt T (2021) Improving Convolutional Recurrent Neural Networks for Speech Emotion Recognition. In: 2021 IEEE spoken language technology workshop (SLT). IEEE, pp 365–372
Mirsamadi S, Barsoum E, Zhang C (2017) Automatic speech emotion recognition using recurrent neural networks with local attention. In: 2017 IEEE international conference on acoustics, speech and signal processing (ICASSP). IEEE, pp 2227–2231
Mohamad Nezami O, Jamshid Lou P, Karami M (2019) ShEMO: a large-scale validated database for Persian speech emotion detection. Lang Resour Eval 53:1–16
Pan Y, Shen P, Shen L (2012) Speech emotion recognition using support vector machine. Int J Smart Home 6:101–108
Pawar MD, Kokate RD (2021) Convolution neural network based automatic speech emotion recognition using Mel-frequency Cepstrum coefficients. Multimed Tools Appl 80:15563–15587
Pham H-H, Ho T-T-H (2020) Toward a ‘new normal’with e-learning in Vietnamese higher education during the post COVID-19 pandemic. High Educ Res Dev 39:1327-1331
Ramakrishnan S, El Emary IM (2013) Speech emotion recognition approaches in human computer interaction. Telecommun Syst 52:1467–1478
Savargiv M, Bastanfard A (2014) Study on unit-selection and statistical parametric speech synthesis techniques. J Comput Robot 7:19–25
Savargiv M, Bastanfard A (2016) Real-time speech emotion recognition by minimum number of features. In: 2016 Artificial intelligence and robotics (IRANOPEN). IEEE, pp 72–76
Seo J, Lee B (2022) Multi-task conformer with multi-feature combination for speech emotion recognition. Symmetry 14:1428
Sun P, Lu X, Xu C, Sun W, Pan B (2020) Understanding of COVID-19 based on current evidence. J Med. Virol 92:548-551
Torrence C, Compo GP (1998) A practical guide to wavelet analysis. Bull Amer Meteor Soc 79:61–78
Triyason T, Tassanaviboon A, Kanthamanon P (2020) Hybrid classroom: designing for the new normal after COVID-19 pandemic. In: Proceedings of the 11th international conference on advances in information technology, pp 1–8
Tuncer T, Dogan S, Acharya UR (2021) Automated accurate speech emotion recognition system using twine shuffle pattern and iterative neighborhood component analysis techniques. Knowl Based Syst 211:106547
Tzirakis P, Zhang J, Schuller BW (2018) End-to-end speech emotion recognition using deep neural networks. In: 2018 IEEE international conference on acoustics, speech and signal processing (ICASSP), IEEE, pp 5089–5093
Vapnik V (1998) The support vector method of function estimation. In: Nonlinear modeling. Springer, pp 55–85
Vapnik V (2013) The nature of statistical learning theory. Springer Science & Business Media
Wani TM, Gunawan TS, Qadri SAA, Kartiwi M, Ambikairajah E (2021) A comprehensive review of speech emotion recognition systems. IEEE Access 9:47795–47814
Yildirim S, Kaya Y, Kılıç F (2021) A modified feature selection method based on metaheuristic algorithms for speech emotion recognition. Appl Acoust 173:107721
Zhang H, Gou R, Shang J, Shen F, Wu Y, Dai G (2021) Pre-trained deep convolution neural network model with attention for speech emotion recognition. Front Physiol 12
Zhao J, Mao X, Chen L (2019) Speech emotion recognition using deep 1D & 2D CNN LSTM networks. Biomed Signal Process Control 47:312-323
Author information
Authors and Affiliations
Corresponding author
Ethics declarations
Conflict of interest
The authors of this manuscript declare no conflicts of interest.
Additional information
Publisher’s note
Springer Nature remains neutral with regard to jurisdictional claims in published maps and institutional affiliations.
Rights and permissions
Springer Nature or its licensor (e.g. a society or other partner) holds exclusive rights to this article under a publishing agreement with the author(s) or other rightsholder(s); author self-archiving of the accepted manuscript version of this article is solely governed by the terms of such publishing agreement and applicable law.
About this article

Cite this article
Tanko, D., Demir, F.B., Dogan, S. et al. Automated speech emotion polarization for a distance education system based on orbital local binary pattern and an appropriate sub-band selection technique. Multimed Tools Appl 82, 40839–40856 (2023). https://doi.org/10.1007/s11042-023-14648-y
Received:
Revised:
Accepted:
Published:
Issue Date:
DOI: https://doi.org/10.1007/s11042-023-14648-y