
Abstract
Since 2008, a variety of systems have been designed to detect events in security cameras. There are also more than a hundred journal articles and conference papers published in this field. However, no survey has focused on recognizing events in the surveillance system. Thus, motivated us to provide a comprehensive review of the different developed event detection systems. We start our discussion with the pioneering methods that used the TRECVid-SED dataset and then developed methods using VIRAT dataset in TRECVid evaluation. To better understand the designed systems, we describe the components of each method and the modifications of the existing method separately. We have outlined the significant challenges related to untrimmed security video action detection. Suitable metrics are also presented for assessing the performance of the proposed models. Our study indicated that the majority of researchers classified events into two groups on the basis of the number of participants and the duration of the event for the TRECVid-SED Dataset. Depending on the group of events, one or more models to identify all the events were used. For the VIRAT dataset, object detection models to localize the first stage activities were used throughout the work. Except one study, a 3D convolutional neural network (3D-CNN) to extract Spatio-temporal features or classifying different activities were used. From the review that has been carried, it is possible to conclude that developing an automatic surveillance event detection system requires three factors: accurate and fast object detection in the first stage to localize the activities, and classification model to draw some conclusion from the input values.
1 Introduction
Nowadays, crowded scenes with normal and abnormal activities are common due to the rise of the human population and its diverse activities. It does not matter if the crowd gathers to protest or watch a football game; it may turn to be disastrous at any moment. Sometimes this may lead to dangerous or deadly accidents. Identifying suspicious human activities through video surveillance can be one way to prevent the fatal disasters. To that purpose, cameras and other surveillance equipment have been installed in different places during the last few years to monitor human activities for the public safety. Identifying human activities is one of the major challenges of video surveillance systems, which has been widely applied to different practical applications, including surveillance event detection (SED). Event detection concentrates on human action, human-object interactions, and in some cases, on group activities. Event detection in dynamic video surveillance involves several challenges, such as heavy occlusions between pedestrians, cluttered background, low image resolution, and uncontrolled scene conditions [72, 89]. The level of crowd density is one of the factors that may cause difficulties in identifying events. The population density in real-world surveillance systems varies between cameras and over time. For example, a camera view crowded at peak hours at a train station may become sparse at non-peak hours; a camera that supervises a platform will detect a higher crowd density relative to that installed in the ticket office [102]. These problems increase the need to develop an efficient and flexible system.
A video event can be defined as an observable action or state change in a video stream that may be important to the security team. The length of events can vary significantly, starting from two frames to longer-term events that can exceed the limits of the excerpt [99]. Events mostly involve several pedestrians and cover a vast region, which required crowded scene analysis and pedestrian detection. The problems to solve in crowded scene analysis are motion detection and tracking, behavior analysis, density estimation, and crowd management. Each sub-topic has been one of the most active subjects in computer vision. Pedestrian detection also is a fundamental module for event detection and a challenging task in surveillance videos in public places such as the airport gatehouse [72]. In short, SED is a combination of pedestrian detection and multi-object tracking, motion detection, and etcetera. Compared to certain unitary surveillance tasks such as pedestrian detection, action recognition, and person re-identification, there is a vast amount of literature exists while the work of SED is quite a few. As an integration of the above activities, SED relies not only on the collection of spatial information but also on the fusion of motion, temporal relations, and contexts. These properties intensify the difficulties of SED [89].
A challenge in this domain is: which technique is more applicable to the classification of the event in a surveillance system? Many algorithms have been suggested for the detection of various events. Most of event detection methods rely on sophisticated hand-crafted features to reflect the motion and presence of the crowd. The use of hand-crafted features is an explicit limitation because it implies task-specific a priori knowledge, which can be very difficult to define in the case of a sophisticated video surveillance scene. Recently, deep convolutional neural networks (CNN) has resurfaced as an effective method for learning from big data and providing models with outstanding representational capabilities [65]. Although methods utilizing deep convolution neural networks (CNNs) have significantly improved performance on the classification of activity, they are still struggling to achieve the precise position of Spatio-temporal activity in challenging security videos. There are some significant challenges associated with untrimmed security video activity detection. First, the activity usually takes place in a small spatial area compared to the whole video frame, making it difficult to detect the actors/objects involved in the activity. Second, the duration of the activity may vary considerably, ranging from a few seconds to a few minutes, which indicates that the detection technique must be robust to temporal variability. Existing publicly available datasets for action or activity detection, such as KTH [70], UCF101 [74], HMDB [47], THUMOS [39], and AVA [27] do not pose these challenges [25].
The primary purpose of this review is to collect categories and recognize the most efficient methods that can be used in event detection. In this regards, we analyze the available research in SED and ActEV by using TRECVID dataset. This paper presents a detailed literature survey on different frameworks and classification methods designed for events detection between 2016 to 2020. The evaluation systems are described for both TRECVID-SED and TRECVID- ActEV Challenge. Various experts and researchers in this field can gain more knowledge about different methods in the area of object detection, tracking and classification, and existing system evaluation in video surveillance.
1.1 Event dataset
Commonly, the recognition of human activities in the video requires five steps: pre-processing, segmentation, feature extraction, dimension reduction, and classification. Having a sufficient volume of data sets plays a vital role in each of the steps. In this field, there are generally three types of data sets: constrained, consumer-generated, and surveillance datasets. The constrained datasets are collected with a constant background under controlled environments or conditions like Weizmann [14], KTH [70], Activity of Daily Living (ADL) [57], TUM kitchen dataset [82]. The category of the dataset produced by consumers is called the consumer-generated dataset. This category usually is collected through the Internet, movies, or personal film collections. Examples of these datasets are: University of Central Florida (UCF) series, Hollywood series, Stanford 40 action datasets, and Human Motion Database (HMDB). The set of data that is recorded in the real-world with a fixed view under surveillance conditions belongs to the surveillance category. This dataset contains specific properties like image sequences with a complex background, aerial view, and crowded unconstrained environment. The UCF Aerial Action, UCF-ARG, iLIDS, and TRECVid-SED are the most popular surveillance datasets [49].
There is a limited number of datasets available in event detection — most of the researchers using KTH, UCF101, and HMDB51 to detect human action or activity [80]. KTH action datasets consist of 25 actors and each actor performing six different activities with changing illumination conditions in four different scenarios. This dataset is designed based on single-person activity, which rarely happens in surveillance videos. The most popular action-recognition databases are the HMDB51 and UCF101. However, the latest consensus says those two databases are not large-scale databases. It is hard to train good models using these databases without overfitting. More recently, large datasets are being introduced, such as Sports-1M [40] and YouTube-8M [5]. These datasets are sufficiently large, while their annotations are noisy, and only video-level labels are included. These noise and unrelated frames may hinder proper training of the models. Recently, The Google DeepMind released the Kinetics human action video dataset [42] to create an efficient pre-trained model like 2D CNNs trained on ImageNet. The action class list covers: 1) Person Actions (e.g., drinking, laughing, punching); 2) Person-Person Actions (e.g., hugging, kissing, shaking hands); and, Person-Object Actions (e.g., mowing the lawn, washing dishes). This dataset contained 300,000 or more videos and 400 categories that have been trimmed. The Kinetics dataset size was smaller than YouTube-8M and Sports-1M, while the annotation quality is exceptionally high [29]. Despite the many advantages, this dataset relies on human actions rather than activities or events [16].
Although many datasets contain many hours of video or thousands of frames, the number of security events is still minimal. In 2008, TRECVID provided the SED task to evaluate event detection in airport surveillance videos. The evaluation track aimed to promote technology development to detect visual events in a large video data set. They selected ten events based on the difficulty of detection [67]. The goal of the proposed event detection system was to determine the start and end times of these events and their classes. From the definitions of events listed in Table 3, it can be understood that detecting an event is quite complicated and requires recognizing a different level of human activities. For example, the action between people and objects such as CellToEar, ObjectPut, and TakePicture needs interaction recognition, which is a hot research topic in the recent years; the events like PeopleMeet, PeopleSplitUp, and OpposingFlow include a group of individuals gathered in a single place at a particular need to recognize group activities. In 2018 the SED task was continued by a new task, Activities in Extended Video (ActEV), by adding a large collection of multi-camera video data with different domains (not airport aria) and activities (see Table 4). ActEV task activity is defined as “one or more persons performing a specified action or interacting with an object or group of objects”. Twelve activates from the VIRAT dataset are used for activity-level and seven more activities for leaderboard evaluation. The detailed definition of each activity is described in Table 4. The purpose of ActEV was to evaluate video analytic technology performance that automatically detects a target activity and identifies and tracks artifacts associated with the activity via a task-driven assessment.
1.2 Related surveys
In the field of intelligent visual surveillance, a large number of publications have been published to identify an object and recognize the human activity. However, there is a limited number of literature reviews in the field of visual surveillance that have been presented to report the progress of human activity [11]. As shown in Table 1, many studies focused mainly on recognizing human activity, and only a few numbers considered to the recognition of human action and crowded scene analysis. Event detection can include action and activity recognition, abandoned object detection, and crowded scene analysis. This section reviews past survey studies in intelligent visual surveillance and categorized them into the fowling categories.
- Action recognition: :
-
Motion and action analysis has a long history and is attractive to a variety of disciplines, including psychology, neuroscience, and computer science. In recent years, several survey papers on human action recognition have been published. The most notable of them are the following: A study by Turaga et al. [81] discussed various human action recognition methods depending on their ability to handle varying degrees of complexity of actions and activities. In 2010, Poppe [59] discussed different challenges and characteristics of feature extraction and classification, such as intra- and inter-class variations, environment and recording settings, temporal variations, and obtaining and labeling training data. A survey by Weinland et al. [87] focused on methods that aim to classify full-body actions such as jumping, punching, and flipping. The authors categorized them according to how they: reflect the spatial and temporal structure of acts, separate actions from the input stream of visual data, and learn to the see-invariant representation of actions.
Metaxas and Zhang [51] described the Nonverbal Communication Computing concept and applications. Also, they reviewed some of the motion analysis methods used in this field, including face detection, gesture recognition, body reconstruction, and group activity analysis. In another study, Vishwakarma et al. [84] presented a systematic review of human action recognition methods developed between 2008 and 2012. In this review, human action recognition methods have been divided into three different levels: low-level (human detection), intermediate-level (human tracking), and high-level (behavior understanding methods). The same strategy was used by Subetha et al. [76] to summarize different ways of action recognition from 2013 to 2016. Herath et al. [33] investigated several aspects of the proposed approaches to recognize actions in 2017. They first reviewed methods based on handcrafted representations, then concentrated on strategies that benefit from deep architectures. Kong et al. [46] provided a survey in different techniques in action recognition and prediction from videos by defined action recognition as the “recognize a human action from a video containing complete action execution” and action prediction as to the “reason a human action from temporally incomplete video data”. More recently, Zhang et al. [97] presented a survey on human action recognition methods and provided a comprehensive overview of recent approaches in this field, including action feature representation methods, interaction recognition methods, and action detection methods. They summarized different human action recognition methods, which include both handcrafted feature-based and feature learning methods.
- Limitations::
-
The majority of the previous reviews have focused on actions and do not explicitly consider contexts such as the environment, interactions between persons or objects. A limited number of them consider only full-body movements, which excludes the work on gesture recognition.
- Activity recognition: :
-
Aggarwal and Ryoo [3] discuss various approaches designed to recognize different activities. The survey by Popoola et al. [58] presented an update extending previous related surveys and focused on contextual abnormal human behavior detection. In 2012. Sodemann et al. [73] reviewed the recent anomaly detection approaches in automated surveillance with five factors: target, anomaly definitions, learning, modeling algorithms, types of sensors used, and the feature extraction processes. Interestingly, the usage of a number of sensors, the field of view, and resolution outside the range of scales and algorithms relevant to a wide range of different targets is not discussed. In 2014, a survey reviewed several computer vision-based techniques to recognize simple activities performed by a single person, such as running and walking [31]. Ziaeefard [103] presented a survey focused mainly on semantic features to recognize activities from still images and video data. The review identifies different semantic features such as pose, poselet (a specific part of the human pose), objects, scene, and attributes. They mostly discuss how such features can be derived and used to recognize various human activities. Onofri et al. [53] provided a comprehensive survey of human action recognition methods. They categorized human action recognition methods in three categories: statistical, syntactic, and description-based approaches, and discussed published articles corresponding to each category. In another study, Bux et al. [15] gave a comprehensive survey of different human activity recognition phases. They reviewed techniques relative to the three phases of human activity recognition include foreground segmentation, feature extraction, and activity classification. Recently a study surveyed the recent advance in deep learning methods for sensor-based activity recognition [85]. They summarize existing literature from three aspects: sensor modality, deep model, and application. More recently, Dhiman et al. [21] presented feature designs of abnormal human activity recognition using RGB, depth, and skeletal evidence in a video related to context or application. They classified the main strengths and limitations of each feature design methodology in respective contexts within each in respective contexts within 2D and 3D abnormal human activity recognition category. Work on violence detection techniques using three classification techniques have been reviewed by Ramzan et al. [61]. They summarized existing literature based on classification techniques used: traditional machine learning, support vector machine (SVM), and deep learning. The authors also presented the feature extraction and object detection techniques of every single method from 2012 to 2019.
- Limitations::
-
Most of the previous reviews have focused on the introduction and summary of activity recognition techniques, as well as various problems in human activity recognition, without analyzing the systems.
- Abandoned object detection: :
-
another challenging field of video surveillance work is the identification of an abandoned object in real-time. In intelligent visual surveillance, a large number of publications have been published during the last decade to identify the objects abandoned or removed. However, few surveys can be found in the literature on the recognition of human activity [17, 20, 44, 45, 55]. Still, none of them concentrated extensively on abandoned or removed object detection in a review. Tripathi et al. [80] presented surveys that show overall progress in detecting abandoned or removed objects in surveillance videos.
- Crowded scene: :
-
Throughout recent years, research on autonomous crowd analysis has been extensively explored to help human operators detect threats and abnormal events in real-time. Several aspects of the crowd are studied and analyzed for this purpose, such as crowd modeling, crowd tracking, crowd activity understanding and crowd intensity estimation, and counting. Few surveys have focused on crowd scenes. The survey by Hu et al. [35] centered on the state-of-the-art of each major issue, such as detection, tracking, understanding, activity description, identification of a person using multiple cameras for visual and interactive surveillance. Although this article was very extensive, it did not address issues such as detecting anomaly and predicting behavior, fusing data from several cameras, and remote surveillance. In 2015, Li et al. [48] provided a survey on state-of-the-art methods for crowded-scene analysis, such as learning the pattern of crowd motion, analyzing crowd activity, and detecting crowds. In this survey, Multi-Sensor information fusion, Deep Learning for crowded, scene analysis, Tracking-Learning- detection framework, real-time processing, and generalization on various datasets for crowd analysis are excluded. Yogameena et al. [93] summarized the crowd disaster issue handled by different computer vision algorithms until 2017. They also presented the existing benchmark datasets with their specifications and performance evaluation metrics to help the researchers to select appropriate dataset for evaluation. Recently, Afiq et al. [1] summarized the latest developments published between 2014 and 2019 in journals and conferences. They provided a review of four major techniques to classify abnormal activity in a crowded scenario named Gaussian Mixture Model (GMM), Hidden Markov Model (HMM), Optical Flow Method, and Spatio-Temporal Technique (STT).
- Limitations::
-
Most prior studies focused on the complexity of each critical problem in crowded-scene: the learning of crowd motion patterns, the analysis of crowded scenes, and crowd detection. They have not addressed topics like anomaly detection and behavior prediction.
2 Materials and methods
2.1 Surveillance videos system
Initially, the video surveillance systems were designed for human operators to survey sites from significant distances. Compared to security cameras designed to deter criminals, surveillance cameras are designed to catch a targeted individual for certain acts. A surveillance system generally has four primary characteristics: 1) it has a communication system between the camera and display device, 2) A surveillance system normally requires a database system where the data is processed for the purposes of the forensic for a month or more (according to regulatory requirements), 3) it is a continuous system and operates 24 hours per day, 365 days per year, and 4) it is designed to improve security and public safety [90].
Watching video surveillance is a labor-intensive activity when control of a large number of cameras is needed. In addition, it is a tedious task with human users, and humans can make mistakes. Intelligent surveillance systems can help to overcome both cost and performance issues. Besides, it can save security team menbers from routine tasks and allow them to focus on higher-level cognitive work that better uses their abilities [95].
Generally there exists two different types of surveillance systems: semi-autonomous and fully-autonomous. In the semi-autonomous surveillance system, the video is recorded and sent to a human expert for analysis. This type of video surveillance requires continuous monitoring by a human that needs high cost and has different challenges. Where a system can recognize human activity tasks and classify them as normal or abnormal during video recording, called a fully autonomous surveillance system [79].
The primary objective of surveillance systems is to ensure that the observed area is well covered by as few cameras as possible. The optimal number of the cameras can help to keep the costs for the installation and the maintenance of cameras and complexity in scene calibration reasonable [64]. A secondary goal of video surveillance is to develop intelligent video surveillance to recognize abnormal human activities and send an alert through messages or other techniques to prevent unusual activities.
2.2 Short description of human activity
As we know, human has various types of activities. Depending on their complexity, human activities are categorized into four different levels: gestures, actions, interactions, and group activities. Gestures are elementary movements of a part of the body. They are describing the meaningful motion of a person based on the atomic components of his body. Each movement of the body like ‘Stretching an arm’ and ‘raising a hand’ to express an idea or feeling can be examples of gestures. An action refers to the motion created by a single person composed of two or more gestures organized temporally, such as ‘walking,’ ‘running,’ and ‘punching.’ The human activities involve two or more persons and/or objects are called Interactions. For example, ‘two-person Embracing’ is an interaction between two humans, and ‘Someone drops or puts down an object’ is a human-object interaction involving one human and one object. The group activities are the activities performed by composed of multiple persons and/or objects like: ‘a group having a meeting,’ ‘group violence in the street,’ and ‘two groups fighting’ [2].
2.3 Definition of video events (ontology)
The notion of events is essential in giving semantics to specifications and providing a logical way of specifying the interfaces and behavior of components in systems [4]. In multimedia, the notion of event is ubiquitous and has different definitions in different domains. The definition associated with an event may be heterogeneous in literature, even if it has a similar characteristic. Events are generally said to occur, or to happen, which means that they are entities that occur over time and/or space [71, 83]. The research community adopted simple or more complex definitions of an event based on the specific issue under consideration. Table 2 displays an overview of the event conceptualization scenarios from the basic definitions to complex ones [83]. The concepts of the ontology presented here refer to the video surveillance domain categorization. In order to provide a full list of all the objects or events that can happen in a video surveillance domain, Tani et al. divided ontology into four main categories: Video Events, Video Actions, Video Objects, and Video Sequences [43]. As shown in Fig. 1, these categories are linked together, where each of them creates an interconnection with the other. Each category is described below

Interconnection between events, actions, objects, and sequences in the proposed ontology [43]
- Video Events: :
-
The video event reflects the composition and succession of one or more actions in a sequence of videos. In the existing ontology context, video events contain all the different events that may happen in a video stream. Every event representing the formation of actions involves one or more relevant objects which interact with each other. Since an event is a combination of one or more actions, this property confirms that video events and video actions are related.
- Video Actions: :
-
The video actions reflect the behavior of the different objects observed in the video surveillance sequence in a time frame. This category covers actions that could be anticipated in events with video surveillance. Consequently, many kinds of objects that occur can generate several types of actions. This property indicates another connection between video actions and the category of video objects.
- Video Objects: :
-
The category of video objects contains all objects that might occur in the video surveillance sequence. Typically, a variety of objects interact with each other to create a video surveillance action. The different kinds of objects represent the key entities interacting in the video sequences, which indicates a connection between video objects and video sequences.
- Video sequences: :
-
The category of video sequences represents the class of all videos registered to the ontology video surveillance indexing, and the instances represent the video database. Generally, all available video sequences in the video database must be categorized with one or more concepts that occur in the category of video events.
2.4 TRECVid summary
Text Retrieval and Evaluation Conference, Video Retrieval Evaluation (TRECVid) is a workshop series sponsored by the US National Institute of Standards and Technology (NIST), which started in 2003. The overall aim of TRECVid is to provide access to large-scale test collections, multimedia data, and a general evaluation procedure. Thus, researchers around the world can have the opportunity to tested and compared in an open metrics-based way. TRECVid conferences have influenced the development of new thinking and challenges in the field of video retrieval. The organizing committee is responsible for writing the “organization plan”, which gathers all the evaluation paradigm instructions distributed to the participants. Various improvements are introduced to current tasks every year, such as: add a new task, replace the previous task with a new one, and introduce a new evaluation matrix. Most of the time, tasks are eliminated in two cases: when the problem under-addressed is considered fixed or, no significant novelty is expected. The evaluators are responsible for identifying the criteria and designing the appropriate evaluation methods [60].
This conference quickly became popular, and participation by research groups increased every year. Participants come from different countries, and there is a tremendous geographical spread. Some of them participate regularly and while others have just taken part once or twice. However, all take part in benchmarking to test their new technique, which they developed for video search. Most of the research groups participated in multiple multimedia research tasks, e.g., Concept Localization (LOC), Ad-hoc Video Search (AVS), Instance Search (INS), Multimedia Event Detection (MED), Multimedia Event Recounting (MER), Surveillance Event Detection (SED), Activities in Extended Video (ActEV), Streaming Multimedia Knowledge-base Population (SM-KBP), Semantic Indexing (SIN), Social Media Video Storytelling Linking (LNK) and Video to Text Description (pilot task) (VTT). Depending on the task, each participant group is allowed to submit one or more than one “run” for each task.
2.5 Detail descriptions of TRECVid-SED and TRECVid-ActEV
TRECVid Surveillance Event Detection (SED)
The SED evaluation focused on event detection in the surveillance video domain, in which the first evaluation was conducted as a part of the 2008 TRECVid conference. The events used for 2008 described in Table 3 were chosen based on their range of expected difficulty level. These ten events represented different types of activities such as single person action (events 4, 5, 8) interaction between people and objects (events 1, 3, 9, 10) and group activity (events 2, 6, 7), [67]. There is a guideline to help the users to annotate and describing the event. In the event annotation section, some rules help participants know general annotation and end time rules for each event. The Video Processing Analysis Resource (ViPER) tool is used for video event annotation. This tool allows the user to watch the video and manually manipulate a line representing the event duration. For a common-sense judgment, a full description of each event exists in the guideline for the common-sense understanding of the event title.
The dataset was captured in five locations at the Gatwick airport in London, UK, where severe occlusions and frequent interactions exist. The dataset utilized five fixed cameras on ten different days, recorded for approximately two hours each day. The location and the data collection facilities were similar for each report. Figure 2 shows the different camera views that were filmed for this dataset. Those cameras are displaying: access door (camera1), waiting area (camera 2), people waiting outside fences (camera3), close-up elevator view (camera4), and a transit area (camera5) it was removed from 2015 onwards. The development set consists of 100 hours of video distributed as MPEG-2 format, de-interlaced, PAL format, 720 x 576 resolution at 25 frames per second (Rose et al. 2009). The TRECVid-SED also has provided an eleven-hour subset of the multi-camera data for the primary evaluation.

Captured SED video from 5 Gatwick airport locations 1) access door; 2) waiting area; 3) people waiting outside fences; 4) elevator close-up; 5) transit area
From 2010 only the first seven are used for evaluation. Those seven events cover three levels of activities: single-person activities, object-person interaction activities, and multiple person activities. Some studies distinguish them into two groups according to the number of people involved in the time. The first five events which have individual actions are classified as individual events. The last two events in which the number of participators is uncertain are classified as group events (events 6, 7).
- Challenges and limitation: :
-
One of the limitations of TRECVid-SED dataset is that they are highly imbalanced for all events. In this dataset, positive events occur far less frequently than negative ones. For example, CellToEar, and PeopleSplitUp are the least and most frequent events, which they occupy only 0.31% and 4.37% of the training video sequences, respectively. Learning from these imbalanced data sets can be very challenging for many machine learning models. Another limitation is the nature of group events that make them challenging to identify. They mainly have features included: 1) there are no notable differences in pose between the involved and not involved pedestrians; 2) there is an uncertain number of participants; 3) even for a human, It must be observed for some time before discriminating against the occurrence of such events; 4) the pedestrians involved in both of these events can take place anywhere; 5) features extracted at frame level are not enough to detect these two events 6) and lacking labeled data which makes it challenging to use the deep learning approach on these events [72].
TRECVid Activities in Extended Video (ActEV)
ActEV is an extension of the TRECVid-SED evaluation, where systems only detected and temporally localized different activities (Yooyoung et al. 2019). The purpose of the ActEV challenge is to develop video processing technologies that can automatically detect the goal activity and recognize and track objects associated with the activity. This challenge involves three evaluations: activity level, temporal segmentation reference, and leaderboard. For this challenge, DIVA dataset is used to present challenging action detection scenarios. The DIVA dataset is a new data set for Spatio-temporal action detection of untrimmed videos. The latest DIVA dataset release (DIVA V1) is adapted from the VIRAT dataset [69] with new annotations for 12 simple and complex interesting acts focused on the public security domain [70]. Either people or vehicles are involved in any action. Currently, the dataset consists of 455 video clips with a total of 12 hours and 40 minutes captured at various locations. The training, validation, and test set contains 64, 54, and 96 videos with annotations withheld, respectively. All video resolutions are either 1200×720 or 1920×1080, and the frame rates range from 25-30 Hz. The stationing cameras are mostly at the top of the buildings, and the viewing angles of the cameras to the dominant ground planes vary from 20 to 50 degrees. The human-size in this dataset varies from 20 to 180 pixels in height. The structure of the events gives the possibility to divide them into three categories, namely: person only proposal, vehicle only proposal, and person-vehicle interaction proposal. The detail and categorization of events in the VIRAT dataset are shown in Tables 4 and 5, respectively.
- Challenges of DIVA dataset: :
-
This dataset introduces many new challenges for the task of action detection that makes the approaches developed for existing action datasets unsuitable (see Table 6).
The first problem concerns the sparseness of actions, both spatially and temporally. For instance, approximately half of all videos contain at least 30 seconds of footage in which no actions are carried out. The spatial sparsity of actions is what makes DIVA particularly challenging: the average size of all actions in the training set is 264×142 for the bounding boxes. Consequently, when an action occurs, it only takes on an average of less than 2.6% of the pixels in any given image, and no action takes up more than 40% in the whole dataset. This means that the average action in DIVA is just over half the size of the smallest object, which can be detected by conventional means.
The second issue in these datasets is the different actions are performed in conjunction with other repeatable actions. The similarity of each action and each environment, with few exceptions, often makes it very difficult to use the context of the surrounding scene to assist in the classification process.
The third problem is that the data set includes major spatial and temporal overlaps between different activities. Consider, for a specific example, the opening, entering, and closing activity that refers to a car-interacting human actor. To enter a car, the subject may first open the car door and will often shut it afterward. Typically all three of these actions are performed in rapid succession, but DIVA starts annotation of each activity one second before it begins and finishes annotation one second after it is finished [25].
2.6 Evaluating system performance (Performance evaluation methodology)
- TrecVID-SED Metrics :
-
It is necessary to have an evaluation system to see how well the designed system can detect event occurrences. The determination of correct detection can show the performance of the detection part of the system. The performance is measured as a tradeoff between missed detections (MD) and false alarms (FA) error. A Linear combination of these two errors creates a detection cost rate (DCR) error measure. In addition to DCR, detection error tradeoff (DET) curves are produced to graphically depict the tradeoff of the plot the FA vs. MD error. The rest of this section describes the evaluation system in SED.
- Decision Error Tradeoff Curves :
-
Typically, the DET curve is a graphical means to represent performance on detection tasks that involve a trade-off of error types. It gives uniform treatment for both kinds of error and uses a scale for both axes, which help better distinguishes different well-performing systems [50]. Typically, two types of error exist in system detection: missed detections (MD) and false alarms (FA). The DET curves will produce graphical depict the tradeoff of event-averaged missed detections probabilities (PMiss) and the probability of false alarms (PFA) which can be calculated with the following formula:
$$ P_{\text{Miss}}={N_{Miss}}/{N_{Target}}\ \ \ \ \ \ \ \ \ {\ \ \ \ \ \ \ \ \ \ \ \ \ \ P}_{\text{FA}}={N_{FA}}/{N_{Source}}, $$Where NMiss, NTarget, NFA and NSource are the number of missed detections, correct event observations, incorrect detections (false alarms), and opportunities for incorrect detection, respectively
Counting NSource is usually problematic for “streaming” detection systems like event detection, which have multiple event observations that can co-occur, and the observations can begin at any frame and have any duration. By considering these factors, false alarms rates (\({\tilde {R}}_{\text {FA}}\)) is used instead PFA which calculate by
$$ {\tilde{R}}_{\text{FA}}={N_{FA}}/{N_{CamHrs}} $$where NCamHrs is the number of camera hours of processed material and the unit of \({\tilde {R}}_{\text {FA}}\) is false alarms per hour. In Strictly speaking, \({\tilde {R}}_{\text {FA}}\) is a biased estimate of type 1 statistical errors since correct observations are included in NCamHrs.
- Normalized Detection Cost Rate (NDCR) :
-
Normalized Detection Cost Rate (NDCR) is a standard metric to descript the performance of a system in the TRECVID-SED evaluation tasks. The NDCR is a weighted linear combination of the PMiss and \({\tilde {R}}_{\text {FA}}\), defined by:
$$ NDCR=\ P_{\text{Miss}}+0.005\times {\tilde{R}}_{\text{FA}}, $$The NDCR has a value greater than or equal to zero. NDCR measures the system’s errors, and the smaller amount of NDCR means higher accuracy, and NDCR= 0 means perfect performance. NDCR= 1 indicates the cost of a system with no output and \(NDCR=\infty \) when \({\tilde {R}}_{\mathrm {F}\mathrm {A}}=\infty \). The PMiss has a higher impact on NDCR in a camper with \({\tilde {R}}_{\text {FA}}\).
Generally, two NDCR values are calculated for each event. The first value is Minimum NDCR (MinNDCR), which is the ideal detection error. It is computed by finding a particular point on the DET curve that minimizes NDCR. The other value is the Actual NDCR (ActNDCR), which is the actual detection error of the system. It is computed by using PMiss, and \({\tilde {R}}_{\text {FA}}\) calculated from the set of putative system observations with “yes” decisions based on a threshold applied to the decision scores. The value of MinNDCR is usually smaller than ActNDCR because it looks to the best threshold according to the ground truth, which is usually very difficult for the proposed system leveraging.
- NDCR at Target Operating Error Ratio (NDCR@TOER, Secondary Metric) :
-
NDCR at Target Operating Error Ratio (NDCR@TOER) is another metric of assessment. It is determined with the aid of looking at the DET curve for the point where it crosses the theoretical balancing point where two error types (Miss Detection and False Alarm) contribute equally to the measured NDCR. The Target Operating Error Ratio point is specified by the ratio of the coefficient applied to the False Alarm rate to the coefficient used to the Miss Probability.
- TrecVID 2018 ActEV Metrics :
-
The technologies sought for the assessment of ActEV are expected to report activities that take place in the series of video(s), including the identification of the camera(s) for which the activity is visible, the reporting of the duration of the activity, the detection of persons and objects involved in the activity, specifying the activity type of each object, and tracking multiple objects in multiple cameras.
This ambitious list of system capabilities is structured as a series of increasingly challenging evaluation tasks, where more detailed system output specificity is needed to define “correct detection.” For example, Activity Detection (AD) is required to identify the target activity and its duration. Activity and Object Detection (AOD) adds object detection and localization, and Activity Object Detection and Tracking (AODT) adds object type identification to the objects being tracked. Table 7 identifies the performance questions answered by the TrecVID 2018 ActEV Protocol concerning the primary and secondary measures for the tasks of AD, AOD, and AODT. The ActEV19 AD protocol is used for the TrecVID 2019 ActEV evaluation and other assessments, which is further described in [8]. In the following subsections, each task is defined, and its performance measurement is described.
Table 7 The performance questions answered by the TrecVID 2018 ActEV Protocol
- Normalized Multiple Instance Detection Error :
-
Given the target activity, the system should automatically detect and temporally localizes all activity instances in extended video sequences. The system should give the start and end frames indicating the target activity’s temporal location and a presence confidence score with higher values indicating that the instance is more likely to have taken place. The Normalized Multiple Instance Detection Error (NMIDE) is introduced to summarize the system performance on temporal localization in instances of activity. As shown in Fig. 3, the confusion matrix is first calculated in the instance pair-level within this measure. Due to the error of annotation or ambiguity of start and end frames for an activity, the No-Score (NSI) zone (blue) is used, and the length of theNS is not scored. Thus, NMIDEis computed as follows:
$$ N_{MIDE}=\ \frac{1}{N_{mapped}}\sum\limits_{I=1}^{N_{mapped}}\left( C_{MD}\times\frac{{MD}_{I}}{{MD}_{I}+{CD}_{I}}\right. $$$$ \left.+ C_{FA}\times\frac{{FA}_{I}}{{Dur}_{V}-({CD}_{I}+{MD}_{I}+{NS}_{I}}\right), $$Where CDI is correct detection as well CMD and CFA are respectively cost functions for missed detections and false alarms. The DurV is the duration of the reference video V and Nmapped is the number of mapped instance pairs between reference and output of the system.
Fig. 3 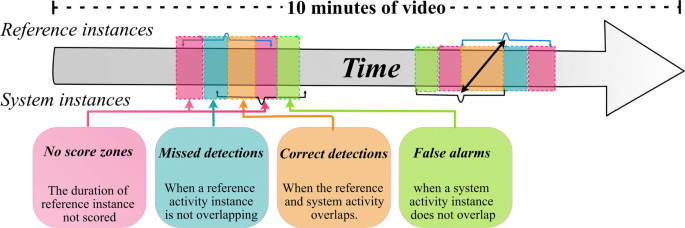
confusion matrix computation of system instance-pairs for temporal localization [7]
For the AD task evaluation in ActEV18, for accuracy and robustness of activity detection, the performance was evaluated on the operating points; PMiss at \({\tilde {R}}_{\text {FA}}=0.15\ \)(labeled ‘PR.15’), PMiss at \({\tilde {R}}_{\text {FA}}=1\) (labeled ‘PR1’). The performance measure for temporal localization multiple NMIDE values are used at different operating points; for instance, NMIDE at \({\tilde {R}}_{\text {FA}}=0.15\ \) (labeled ‘NR.15’) and NMIDE at \({\tilde {R}}_{\text {FA}}=1\)(labeled ‘NR1’). The NSI default value is zero andCMD = CFA = 1. A smaller PR.15, PR1, NR.15, and NR1 values indicate a better performance of the system.

- Normalized Multiple Object Detection Error :
-
In this function, a system not only detects/localizes the target activity but also detects the presence of target objects and localizes the objects associated with a given activity spatially. Besides the activity information, the system needs to provide the object bounding box coordinates and confidence scores for object presence.
The Normalized Multiple Object Detection Error (NMODE) is used for the object detection metric, which is described in [73]. The NMODEmeasures the relative number of false alarms and missing detections per activity instance for all objects. This metric also utilizes the Hungarian algorithm to align objects at frame level between reference and system output. For every frame t, the confusion matrix is calculated from the confidence scores of the bounding boxes of the objects, referred to as the object presence confidence thresholdτ. The NMODE at thresholdτ is computed as:
$$ N_{MODE(\tau )}=\ \sum\limits^{N_{frames}}_{I=1}{\left( \frac{1}{{\sum}^{N_{frames}}_{t=1}{{N^{t}_{R}}}}\right)\left( C_{MD}\times {MD}_{t}+C_{FA}\times {FA}_{t}\right)} $$Where MDt is the number of reference bounding boxes that are not mapped to the bounding box of the system output and FAt is the number of system bounding boxes not aligned to the bounding boxes of reference at thresholdτ. Nframesis the number of frames in the reference instance sequence and \({N^{t}_{R}}\) is the number of reference objects within frame t. The minimum NMODE value (minMODE) for each instance-pair is measured for object detection performance and PMiss at RFA points are recorded for both activity- and object-level detections.
The AOD-AD and AOD-AOD were two scoring protocols for the AOD function in ActEV18. With the AOD-AD protocol, the system is scored without additional terms to the congruence of object detection. In contrast, for AOD-AOD, the system is scored taking object detection into account.
3 Methods
- Search strategy :
-
Event detection is still an active topic of research, with numerous papers published on the subject. There are so numerous that any comprehensive review of state of the art would be beyond the scope of any reasonable–length work. As a result, selection criteria must be established, and we have limited our focus to different models that perform best in the TRECVid-SED and TRECVid-ActEV competitions based on the identified evaluation metrics. For two reasons, we decided to consider only the published TRECVid-SED proceedings and articles between 2016 and 2019. One of the reasons is that there is often only one team that performs best in the majority of events. Another reason is that the best performing teams sometimes take part in small model adjustments or improvements in the next challenge. For example, the input data sizes are decreased in a study, and the original size is used next year. Since 2018, TRECVid has decided to continue SED with more challenging tasks and a new dataset by ActEV. We also have decided to include papers or reports for TRECVid-ActEV published from 2018 to 2020. We have only looked at the best of competition best models based on the assessment methods that the organizing committee defined in that year. The results for activity detection in ActEV18 showed that IBM_MIT_PURDUE team [10] achieved the lowest object detection error, and UMD [25] team achieved the lowest error PMiss at \({\tilde {R}}_{\text {FA}}=0.15\) followed by SeuGraph team [92]. The ActEV19 result indicates that the MUDSML team [18] obtained the lowest error rate, followed by the UCF team [62].
4 Results
4.1 Event detection techniques in TRECVid-SED
Here the methods of event detection in TRECVid-SED are discussed in detail. The list of recognition methods, events detection, classification, and video features extraction techniques are provided in Table 8. Some participating teams have designed a model to identify some of the events, the number and names of events are mentioned. Some designed systems divided events into two categories and provided two or more models; the method for event detection, classification, and feature extraction are expressed based on categories.
-
1: key-pose and group-based event The authors grouped the six events into two classes: 1) key-pose based events (events 2, 3, 4, 5) and 2) group events (events 6, 7). They proposed two different event detection method for each group. Key-pose-based techniques are used for the first group, and trajectory analysis-based approaches are used for the second group. For both classes, improved Faster R-CNN is proposed to detect pedestrians in surveillance videos accurately.
They follow the Faster-RCNN method and adjust the model structure and training system to improve pedestrian detection efficiency. For the first-class event, they use Faster R-CNN, which was pre-trained on the ImageNet dataset with the VGG-16 backbone network as a key pose detection. The TVL1 [96] optical flow algorithm is used to extract optical flow features. They merged these features with original static pictures before feeding them into the input layer of CNN. In this method, events are classified based on regions extracted by the deep network of both optical flow maps and RGB channels.
The model designed for group events consists of three sections: 1) object detection, 2)multi-object tracking, and 3) group event detection (Fig. 4). Improved Faster R-CNN used for object detection section. They formulated a multi-object tracking task as a hierarchical association problem as introduced in [80] with a minor change in the low-level and high-level association. The naïve Bayesian method was used to model the appearance of pedestrians and employed a linear motion model to eliminate ambiguous associations for the low-level association. In high-level association, Gaussian process regression (GPR) is introduced to predict possible links and smooth trajectories. The second-class system had three components: trajectory clustering, spring model-based detection, and head-pose classification. They implemented pedestrian trajectories by clustering the close trajectories with little motions to a group at the stop point. They also designed a spring system model based on trajectory analysis and deep learning methods to formulate the detection. The spring model converts a complex event judgment into a simple computable model in multi-dimensional space, allowing full use of temporal and spatial information about these group events. To estimate the path a pedestrian will take, they came up with a new head-pose CNN classifier. The classifier utilizes the head-shoulder regions as input and classifying them in four directions: front, left, back, and right [72].
-
2: Short-term and long-duration events. They combined the benefits of the conventional model with the deep network and introduced a unified SED framework. According to intra-dependencies and inter-dependencies of events, the authors divided seven events into two categories: 1) short-term (events 2, 3, 5) and 2) long-duration (events 1, 4, 6, 7) events. The former can be interpreted as a kind of snapshot of static key-poses and inner-dependencies. In contrast, the latter includes dynamic interactions between pedestrians and shows obvious interdependencies and temporal contexts. They demonstrated that the head-shoulder is the most recognizable component of the SED based on statistical analysis and experimental findings. In addition, they created a new large-scale pedestrian dataset, called SED-PD, for evaluation. For statistical analysis, they evaluated the distribution of occlusion of SED-PD by counting the average occurrences of three categories of body sections, i.e., the head-to-shoulder, the upper body, and the entire body. The outcome revealed that most pedestrian instances (73%) show incomplete body parts, while 98% of head–shoulders are kept. For the experimental portion, a preliminary human detection experiment was performed with the SED-PD Cifar-10 network, resulting in lower head-shoulder than the full-body. The bounding box of the head-shoulder of every pedestrian was provided for each frame. A cascade CNN (HsNet) is trained to detect the pedestrian in which network architecture is composed of 3 subnets.

The key-pose and group-based event framework, it mainly includes three sections
The short-term event detection can be summarized as three steps: pedestrian detection, key-pose classification, and event localization. In the pedestrian detection step, the HsNet is first used for detecting the pedestrians for each video frame, and then the sizes of all detected bounding boxes are extended by 1.5 times. The pedestrian is resized to 32x32 pixels during the Key-pose classification step and then inserted into the key-pose models to be classified. To localize the event, a fast object tracking algorithm is used based on the nearest-neighbor (NN) to associate consecutive key-poses with an individual event.
They adopted a trajectory-based approach to extract the contexts for long-duration event detection, composed of five parts: 1) local-level feature extraction; 2) dimension reduction by and whiten principal component analysis (PCA); 3) video representation based on fisher vector (FV) encoding and normalization; 4) linear SVM classification for events; 5) fusion the result (Fig. 5). For Low-level feature extraction, Dense Trajectory (DT) and Improved Dense Trajectory (IDT) are applied to explore the temporal features of the events, respectively. Five types of descriptors, i.e., dense trajectory, HOG, HOF, MBHx, and MBHy are yielded in DT to represent the video’s Spatio-temporal relations. IDT improves object motion representation by removing the “global motion” in videos. The PCA operation was used for the DT and IDT feature to speed up the computation and remove data correlation, and then the Fisher Vector (FV) coding is adopted to encode raw features. Linear one-against-rest SVM classifiers are learned based on standardized video representations in order to detect events. A later-fusion system based on the classifier scores is used to produce the final results [89].
-
3: Spatio-temporal deep architecture The authors split the events into two groups: 1) key-pose based events and 2) group events. They used the head-to-shoulder part detection scheme instead of the whole body to reduce the effects of severe occlusion in SED scenes. The region-based fully convolutional networks (R-FCN) detection framework with ResNet-50 net backbone network is used as a pedestrian detector. The authors proposed an OHEM-based hard-mining algorithm, which selects and activates relatively difficult samples with high losses in the forward path to adjust the model’s weights during backward propagation. They provided a separate ObjectPut event detection system consisting of two steps: key-pose detection and key-pose sequence classification. They initially fed the video frame through R-FCN to locate the key-poses event and then concatenated the detected ROIs to form a kay-pose sequence. In the second stage, a ConvLSTM Integrated with Temporal Pooling (CLITP) model [81] used to obtain temporal representations. The CLITP model gets key-pose sequences from the first stage and classifies the event (Fig. 6). For the rest of the key-pose events, R-FCN was used by adapting a multi-class training strategy to train the model. They follow the same spring model approach for group-based events, which are described in [72].
Fig. 5 
The Short-term and long-duration framework. It include four parts: 1) pedestrian detection; 2) short-duration event detection; 3) long-duration event detection and 4) fusion
Fig. 6 
The architecture of the event detection system. The raw frame is first feeded with R-FCW to find the main locations of the event. The detected ROIs are then concatenated to form a sequence that is sent to CLITP model for further classification
-
4: High-precision head detector In this system, a high precision head detector with a track head region detector was combined. The system consisted of four stages: 1) Head detection, 2) Object tracking, 3) Regions of interest (ROI) determination, and 4) Event classification (Fig. 7).
Fig. 7 
High-precision head detector frameworks


They used the approach proposed by Stewart et al. [75] for head detection, which was a combination of CNN and LSTM. In the second stage, the system uses a generic object tracker proposed by Henriques et al. [32] to associate head regions through several frames resulting in temporal coordinates of detected people. After object tracking, the system extracts ROI from each frame. By using the head coordinates, the upper and whole-body regions are determined by predefined ratios based on the scale of the head area. The system determines scores for the target events with individual activity classifiers for each part of the body for the final event classification. The system used two 2D CNN classifiers and two 3D CNN classifiers for the upper and the whole-body motion-frames for each frame. Finally, the event scores are calculated by fusing scores from different classifiers [56].
-
5: (CMU) Event proposal for event classification and localization In this system, the object detection pipeline was extended to the event detection pipeline for SED tasks. The built model consisted of four components: 1) raw feature extractor, 2) event proposal, 3) event classification, and 4) event localization (Fig. 8).
Fig. 8 
A proposed system for event classification and localization using Event proposal

They argued that each frame contains several people, and the event only happens among some of them. Fully convolutional networks can be useful to extract features in the space to capture. For the raw feature extractor component, three types of the feature have been extracted: the RGB image feature with VGG19 net, the flow stream feature by GoogleNet, and the RGB stream feature via C3D. They used a human detector to generate a sequence of the bounding boxes for each person in every frame with limited time durations. A tracking algorithm helps the system to track the detected bounding box and produces a tube corresponding to that bounding box. This tube is called the event proposal. This idea allowed them to filter out irrelevant frame areas.
As the duration of different events varies, two different duration times (25 and 50 frames) were considered for event proposals. The output of the event proposal was the input for both event classification and event localization. To classify an evet, they used Vector of Locally Aggregated Descriptors (VLAD) [37] as a pooling method and SVM as a classifier to classify different events. The authors set the number of VLAD centers to 32 and using spatial pyramid pooling on three layers (4x4, 2x2, 1x1). Maximum suppression along a time axis was also used to localize the events [19].
-
6: Region Proposal Network (RPN) and detection network They have been paying attention to Personruns, Embrace, and Pointing events in their system. In order to detect surveillance events, they modified Faster R-CNN to detect an event in the frame sequences. These improvements included two sections: 1) adding a recurrent neural network and 2) setting multi-frames as input.
Same with Faster R-CNN, their system consisted of Region Proposal Network (RPN) and detection network. After training, RPN takes multi-frames as input and delivers a sequence of rectangular object proposals with object scores as output. The Non-maximum suppression (NMS) method is used to improve the output of RPN before the detection step. Finally, they designed a neural detection network to judge whether the region proposal with the high score given by RPN can be a target or not.
They have developed a different model for each event, depending on the structure of the events. For Personruns or Embrace event with a series of different actions and occlusion, they saw it is difficult to recognize these events with one form. To overcome this problem, they injected a combination of five adjacent frames into the neural network as system inputs for those two events. Besides, they considered two same frames for both adjacent frames to follow the event that occurred in more frames. The only difference between the model designed for Personruns or Embrace was the position of RNN in the detection network. The RNN in Embrace’s detection network is designed to fuse the feature of all frames, while the RNN is used to combine features of region proposals in the Personrun’s detection. They argued that the pointing event involves a key-pose; one frame is sufficient to detect it. In this event, the input of this network is set to a single frame and didn’t use RNN [91].
4.2 Activity detection in TRECVid-ActEV
The activity detection methods are described herein in considerable detail in the TRECVid-ActEV Table 9 present the list of recognition methods that use a different technique for events detection, feature extraction, and classification.
-
1: Modular system for Spatio-temporal action detection The authors presented a modular system for Spatio-temporal action detection in surveillance videos. Their approach consisted of three distinct modules: 1) module generates class-independent Spatio-temporal proposals from a given video sequence, 2) module performs action classification and temporal localization on generated proposals, and 3) post-processing module (Fig. 9).
Table 9 Summary of detection technique, feature extraction, classification, and for TRECVid- ActEV Fig. 9 
Modular system for Spatio-temporal action detection

They observed that the Mask-RCNN was able to detect humans and vehicles on a variety of scales. The action proposals were generated by hierarchical clustering to group frame-wise object detections obtained from Mask-RCNN in the Spatio-temporal domain. A temporal jittering approach was used to generate dense action proposals from the existing proposals. They modified the I3D [88] network(TRI-3D) to predict a temporal correction to the cuboid by adding the regression objective to the final layer. The TRI-3D network architecture was employed to classifying each proposal cuboid as one of the 12 action classes or as a non-action class. The TRI-3D network input was optical flow frames that are computed using the TV-L1 optical flow algorithm. The classification score and the refined temporal bounds for an input proposal were the TRI-3D network outputs. For the post-processing step, 3D Non-maximum Suppression (3D-NMS) algorithm was applied to eliminate the overlap created in the network output. The 3D-NMS algorithm is used separately for both of the classes. It considers the two proposals overlap when the temporal Intersection over Union (IoU) overlap reaches 0.2, and the spatial IoU overlap reaches 0.05 [25].
-
2: A combination of deeper 3D CNNs with RNN for the activity classification They suggested a DT-3DResNet-LSTM framework for the classification and temporary localization of activities in videos. Their framework involved three different sections: 1) Faster-RCNN for object detection, 2) Kalman filter [94] for object tracking, and 3) 3DResNet [30] and LSTM [13] for activity classification (Fig. 10).
Fig. 10 
The proposed system for activity classification using a combination of deeper 3D CNNs with RNN

They found that pedestrians and vehicles are the main objectives of the ActEV surveillance task. They employed Faster RCNN with the VGG-16 backbone network as the bottom feature of the video frame for object detection. The Faster RCNN outputs were used as a tracking model input. The Kalman filters were used to track observed objects and create various continuously clipped frames containing tracked objects. They used 3D CNNs based on ResNets (3DResNet) designed by Hara et al. [29] to extract spatiotemporal features from videos for action recognition directly. The ResNet model in 3DResNet was pre-trained by Kinetics datasets containing 400 human action classes. They also added LSTM units behind the 3DResNet output layers to classify a sequence of video frames to maximize temporal activity detection accuracy. They applied dropout with probability p = 0.5 during a model’s training to prevent neural networks from overfitting. The class probabilities were averaged over all the video clips generated by an object tracking model. To achieve activity predictions for the whole video, the most probable class among the candidates is considered an activity class. For the temporal localization of the video clipped activity, the mean filter of k samples was used to the predicted sequence to render the values smooth over time. The probability of action and non-action were predicted in each 16-frame clip. Finally, only clips with a probability value over a certain threshold were stored and labeled as the predicted class. [92].
-
3: Object-Centric Spatio-Temporal Activity Detection and Recognition They claimed that the ActEV problem needs spatial and temporal localization, unlike the overwhelming majority of action detection systems. The object localization and activity detection methods were used to solve this problem. The system they developed included three different sections: 1) object detection and tracking; 2) activity tube generation; 3) proposal generation; and 4) activity classification (Fig. 11).
They investigated a few state-of-the-art vehicles and people detection system possibilities on the VIRAT dataset, including YOLO, SSD, Faster RCNN, and Feature Pyramid Network (FPN) with Deformable ConvNets. They eventually picked FPN with Deformable ConvNets because of its ability to identify small-scale vehicles and people accurately. The object detection method followed the detection-based tracking method provided by Bewley et al. [12]. The localization of spatial-temporal activity takes place in three phases:

The proposed system for object-centric spatio-temporal activity detection
- Initial spatial and coarse temporal segmentation is conducted utilizing activity tube generation. An activity tube is a cropped-out video containing one or more events focused on items of activity interest.
- Secondly, tubes of object-centered activity are extracted by the analysis of interactions between person and object as well as individual object trajectories. Such tubes indicated the spatial locations of which interesting activities could occur.
-Lastly, temporal proposals in object detection are created from the tubes, analogous to the region proposal network. The final action classification is focused on an ensemble of temporal relational networks.
For the proposal generation, the authors used a Temporal Relation Network (TRN) proposed by Zhou et al. [100] with 16 frames to “detect” the optimal temporal localization of the action. In this stage, temporal proposals were constructed using the type of action class. For instance, the vehicle shall be the primary object in the case of vehicle-centered actions and localized by person and vehicle proximity; the person shall be the primary object for person-centered actions, and shall be localized by the person’s proximity to the objects related to the vehicle;, either the vehicle or the person track shall be used. For activity classification, they used a combination of 3-frame TRN, 4-frame TRN, and 8-frame TRN action classification models [10].
-
4: Spatial-temporal activity proposal generation module facilitating object detection and tracking Their system has integrated and improved several recent approaches in the sub-modules and produced an acceptable performance for detecting activity in video surveillance scenarios. They also used a two-stage activity detection system. In the first stage, they pre-processed the videos to generate event proposals and localize activity candidates spatially and temporally.
In the second stage, they extracted features and performed temporal classifications and post-processing to generate the activity detection outputs. This two-stage system was called Argus, which consisted of three parts: 1) activity proposal generation; 2) Spatial-temporal classification; 3) Post-process (Fig. 12)

The proposed system Spatial-temporal activity proposal generation module
The proposal generation involved object detection, tracking, and Spatial-temporal proposal generation. The authors used faster RCNN [66] for object detection with feature pyramid network [98] on ResNet-101 [69] as the backbone, in which RoIAlign was used to extract features for ROI. They adopted similar track handling and Kalman’s filtering system proposed by Wojke et al. [88]. Simple Online and Realtime Tracking (SORT) was used to generate tracks by associating detected objects across frames. For any bounding detection, the feature obtained from the object detection module was used as a presence descriptor. They generated event proposals after obtaining the single object trajectories for person and vehicle in videos. The event proposal can be viewed as a sequence of bounding boxes cropped out of each frame. The events were categorized into three groups: a person only, the vehicle only and person-vehicle interaction proposal (Table 5). The person and the vehicle only proposals contain events that have occurred in a single object, which can be a person or a vehicle. To generate a person-vehicle interaction proposal, they associated individual persons and vehicles with modelling their interactions. They connected the human and the vehicle to model their interactions to generate proposals of person-vehicle interaction. In addition, the Spatial-temporal regularization system was used to create interaction proposals.
The Spatial-temporal classification involves consisted of three sections: feature extraction, Spatial-temporal classification, and scene detection. They learned proposal-augmented I3D-Flow and I3D-RGB features by fine-tuning I3D models proposed by Carreira and Zisserman [16] for activity recognition on VIRAT dataset. The specific models were pre-trained on ImageNet and Kinetics-600 datasets. They also fine-tuned the base models on the VIRAT dataset with annotated positive event proposals and a five-time non-trivial background proposal as negatives. They extracted two types of raw optical flow frames (TVL1 and Farneback) and raw RGB frames from the Spatial-temporal proposals for fine-tuning. After fine-tuning, the last convolution layer was used as the classification feature. They used an extension of traditional LSTMs (bidirectional LSTM) to perform temporal classification to localize activities within spatial-temporal proposals. They applied a pre-trained ResNet-101 classifier to determine the scene (parking area, crossroads, etc.) of a video. To determine the scene for classifier selection, the first 20 seconds frames are extracted, predicted, and then averaged in all frames in each sequence.
The last part of this system was post-processing, which included: proposal filtering and fusion. The candidate proposals may have large spatial and temporal overlaps after classification and localization. In the proposal filtering section, they used spatial-temporal NMS to avoid redundant candidates. In the post-process stage, they applied late fusion to obtain the best performance. They fused results from scene-classifier, I3D-RGB model, and two types of I3D-Flow models to generate the final outputs. They took the prediction scores from individual proposals and heuristic average them when their IoU is greater than a certain threshold [18].
-
5: 3D CNN network for Spatio-temporal action segmentation Their architecture utilized a 3D CNN network for segmentation of Spatio-temporal action, which produces temporally consistent predictions and fewer proposals. The proposed system consisted of three stages: 1) Localization Network for detecting tubelets with activities, 2) tubelets classification, and 3) merging tubelets to generate Spatio-temporal activity detections (Fig. 13).
Fig. 13 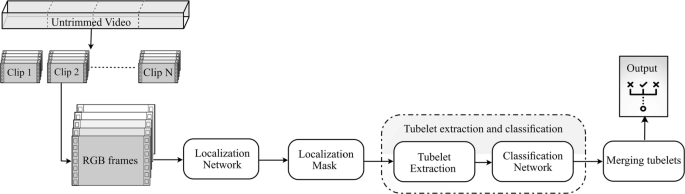
The proposed system for 3D CNN network for Spatio-temporal action segmentation

- Localization Network: :
-
The tube extraction process is the first step of the pipeline, which is responsible for extracting all action tubes from the untrimmed video input. Localizing regions of action both temporally and spatially is important for the process of classification, as the duration and location of action are unknown in advance. As illustrated in Fig. 13, the untrimmed videos were first divided into smaller clips, which are then forwarded to the localization network. According to an encoder-decoder approach, the network produces segmentation masks for action regions, each representing an action bonding box sequence (called tubelet). They used I3D [16] to learn Spatio-temporal features required for activity localization in the encoder section. The decoder section was structured by a combination of the upsampling and transpose convolutions.
- Tubelet extraction and classification: :
-
The segmentation output for each clip is a mask for the isolation of possible action tubes. To get individual tubelets from this segmentation data, the data were thresholded to establish a binary mask accompanied by Spatio-temporal extraction of the connected components. The connected part process will produce tubelets for all pixels linked to spatially and temporally. A multi-label prediction network is used to classify the actions present within each tubelet. Since actors can perform multiple activities simultaneously, a multi-label prediction network was used to classify the actions present within each tubelet. They used 3DResNet designed by Hara et al. [29] pre-trained weights on Kinetics dataset for action classification. The final layer of a model is modified to have a C + 1 dimensional output, where C is the number of action classes, and the extra output is for the background class.
- Merging tubelets: :
-
They proposed the Tubelet-Merge Action-Split algorithm (TMAS) to fuse tubelets and receive the final action tubes. The TMAS system first combined the tubelets into action-agnostic tubes of differing lengths; then split these action-agnostic tubes into a collection of action-specific tubes containing the Spatio-temporal localization for the various video activities [62].
5 Conclusion
Detection of activity in surveillance videos is challenging due to the multiple factors such as a large field of vision, multiple activity presence, differing sizes and perspectives, and untrimmed nature of the videos. Most of the existing action classifiers expect short trimmed videos, but that is impractical in real-world security videos to recognize the action. For reliable recognition, it is important to determine the temporal extent of the actions. One of the most significant characteristics of real-world videos is that several events may take place within the same frame, which creates a challenge in action detection. To solve this problem, most studies on detection of spatial actions use a regional proposal network to detect multiple objects in each frame, then momentarily combine them to produce tubeless activity. However, this strategy is computationally expensive as the number of proposals grows, making it ineffective for real-time approaches.
K. Hou et al. [34] demonstrated that a 3D CNN network could predict frame-wise background-foreground segmentation maps and extrapolate action tubes with high accuracy. Utilizing 3D ConvNet enables the model to simultaneously extract both spatial and temporal features, more than ten times faster than two-stream models, even if they lose some accuracy [16, 22, 68, 78, 86]. Most successful TRECVid-ActEV systems use 3D-CNN networks to extract video features and classification sections. Faster R-CNN, or a modification of Faster R-CNN, has been used on the part of the system in a few recent works and demonstrated competitive performance in event detection.
Spatio-temporal action detection in untrimmed videos requires a system that can perform well in real-time [62]. Some teams suggested a two-stage activity detection system. In the first stage, they preprocessed the videos to generate event proposals and localize activity candidates spatially and temporally. They extracted features and performed temporal classification to generate the activity detection outputs for the second stage. There was two option for action localization model: pixel-level action localization and frame-based object detectors. Mostly used Frame-level object detection which has two main issues: 1) The independent processing of each frame involves significant amounts of computing, which decreases the overall system speed and contributes to temporarily inconsistent detections between neighboring frames, and 2) it detects all objects inside the frame, even those that do not perform actions. Of the systems offered, only one uses pixel-level action localization object detector [62].
In this study, we review different models that perform best in the TRECVid-SED and TRECVid- ActEV competition based on the evaluation metrics identified. Each system component is explained, and the steps of each component are described to get a deep understanding of the existing systems (Tables 8, and 9).
References
Afiq AA, et al. (2019) A review on classifying abnormal behavior in crowd scene. J Vis Commun Image Represent 58:285–303
Aggarwal JK, Ryoo MS (2007) Human activity analysis: a review. ACM Comput Surv 43:1–43
Aggarwal JK, Ryoo MS (2011) Human activity analysis: A review. ACM Comput Surv, vol 43, no 3
Al-fedaghi S (2020) Modeling Events and Events of Events in Software Engineering. no 1
Ameya M, Kurokawa S, Hirose M (2012) Millimeter-wave antenna pattern measurement using high extinction ratio Mach-Zehnder modulator. In: Proc 6th Eur Conf Antennas Propagation, EuCAP 2012, pp 2574–2577
Awad G, et al. (2016) TRECVID 2016: Evaluating Vdeo search, video event detection, localization, and hyperlinking Gaithersburg
Awad G et al (2018) TRECVID 2018: Benchmarking Video Activity Detection, Video Captioning and Matching, Video Storytelling Linking and Video Search To cite this version: HAL Id: hal-01919873 TRECVID 2018: Benchmarking Video Activity Detection, Video Captioning and Mat, Proc TRECVID 2018, pp 1–38
Awad G et al (2019) TRECVID 2019: An Evaluation campaign to benchmark Video Activity Detection, Video Captioning and Matching, and Video Search retrieval, TRECVID 2019, 23sd Int Work Video Retr Eval
Ballan L, Bertini M, Del Bimbo A, Seidenari L, Serra G (2011) Event detection and recognition for semantic annotation of video. Multimed Tools Appl 51(1):279–302
Beigi M et al (2018) Object-centric Spatio-Temporal Activity Detection and Recognition
Ben Mabrouk A, Zagrouba E (2018) Abnormal behavior recognition for intelligent video surveillance systems: a review. Expert Syst Appl 91:480–491
Bewley A, Ge Z, Ott L, Ramos F, Upcroft B (2016) Simple online and realtime tracking. Proc - Int Conf Image Process ICIP 2016-Augus:3464–3468
Bhatt P, Bhatt R, Mukadam MD, Yusuf SM (2013) Prussian blue based molecular magnet K0.3Mn 2.85[cr(CN)6]2snh2o with ferrimagnetic ordering temperature of 60 K. AIP Conf Proc 1512:1082–1083
Blank M, Gorelick L, Shechtman E, Irani M, Basri R (2005) Actions as space-time shapes. Proc IEEE Int Conf Comput Vis II:1395–1402
Bux A, Angelov P, Habib Z (2017) Vision based human activity recognition: a review. Adv Intell Syst Comput 513:341–371
Carreira J, Zisserman A (2017) Quo Vadis, Action Recognition? A New Model and the Kinetics Dataset, A new Model Kinet. dataset, CoRR, arXiv:abs/1705.07750, vol 2, pp 3
Chandola V, Banerjee A, Kumar V (2009) Anomaly detection: a survey. ACM Comput Surv 41(3): 1–58
Chang X et al (2019) MMVG-INF-Etrol @ TRECVID 2019: Activities in Extended Video. In: 33rd conference on neural information processing systems, no 2017
Chen J (2017) Informedia @ Trecvid 2017 informedia@TRECVID 2017 MED and AVS
de Campos TE (2014) A survey on computer vision tools for action recognition, crowd surveillance and suspect retrieval, XXXIV Congr da Soc Bras Comput – CSBC 2014, no May, pp 1123–1132
Dhiman C, Vishwakarma DK (2019) A review of state-of-the-art techniques for abnormal human activity recognition. Eng Appl Artif Intell 77(August 2018):21–45
Feichtenhofer C, Fan H, Malik J, He K (2019) Slowfast networks for video recognition. Proc IEEE Int Conf Comput Vis 2019-Octob:6201–6210
Feichtenhofer C, Pinz A, Zisserman A (2016) Convolutional Two-Stream network fusion for video action recognition. Proc IEEE Comput Soc Conf Comput Vis Pattern Recognit 2016-Decem(i):1933–1941
Francois ARJ, Nevatia R, Hobbs J, Bolles RC, Smith JR (2005) VERL: An ontology framework for representing and annotating video events. IEEE Multimed 12(4):76–86
Gleason J, Ranjan R, Schwarcz S, Castillo CD, Chen JC, Chellappa R (2019) A proposal-based solution to spatio-temporal action detection in untrimmed videos. In: Proc - 2019 IEEE Winter Conf Appl Comput Vision, WACV 2019, pp 141–150
Gleason J, Ranjan R, Schwarcz S, Castillo C, Chen J-C, Chellappa R (2019) A proposal-based solution to spatio-temporal action detection in untrimmed videos. In: 2019 IEEE winter conference on applications of computer vision (WACV), pp 141–150
Gu C, Sun C, Ross DA, Toderici G, Pantofaru C, Ricco S (2018) AVA A video dataset of atomic visual actions. In: IEEE conference on computer vision and pattern recognition (CVPR), pp 6047–6056
Hakeem A, Sheikh Y, Shah M (2004) CASE E: a hierarchical event representation for the analysis of videos. In: Proc Natl Conf Artif Intell, pp 263–268
Hara K, Kataoka H, Satoh Y (2017) Learning spatio-Temporal features with 3D residual networks for action recognition. Proc - 2017 IEEE Int Conf Comput Vis Work ICCVW 2017 2018-Janua:3154–3160
Hara K, Kataoka H, Satoh Y (2018) Can Spatiotemporal 3D CNNs Retrace the History of 2D CNNs and ImageNet?. Proc IEEE Comput Soc Conf Comput Vis Pattern Recognit, pp 6546–6555
Hassan M, Ahmad T, Farooq A, Ali SA, hassan SR, Liaqat N (2014) A review on human actions recognition using vision based techniques. J Image Graph 2(1):28–32
Henriques JF, Caseiro R, Martins P, Batista J (2015) High-speed tracking with kernelized correlation filters. IEEE Trans Pattern Anal Mach Intell 37(3):583–596
Herath S, Harandi M, Porikli F (2017) Going deeper into action recognition: a survey. Image Vis Comput 60:4–21
Hou R, Chen C, Shah M (2017) An end-to-end 3d convolu- tional neural network for action detection and segmentation in videos. arXiv:1712.01111
Hu W, Tan T, Wang L, Maybank S (2004) A survey on visual surveillance of object motion and behaviors. IEEE Trans Syst Man Cybern Part C Appl Rev 34(3):334–352
Huang C, Wu B, Nevatia R (2008) Robust object tracking by hierarchical association of detection responses. Lect Notes Comput Sci (including Subser Lect Notes Artif Intell Lect Notes Bioinformatics) 5303 LNCS(PART 2):788–801
Jégou H, Douze M, Schmid C, Pérez P (2010) Aggregating local descriptors into a compact image representation. In: Proc IEEE Comput Soc Conf Comput Vis Pattern Recognit, pp 3304–3311
Jiang L, Hauptmann AG, Xiang G (2012) Leveraging high-level and low-level features for multimedia event detection, MM 2012 - Proc. 20th ACM Int Conf Multimed, pp 449–458
Jiang RSY-G, Liu J, Roshan Zamir A, Toderici G, Laptev I, Shah M (2013) THUMOS challenge: Action recognition with a large number of classes. http://crcv.ucf.edu/ICCV13-Action-Workshop/
Karpathy A, Toderici G, Shetty S, Leung T, Sukthankar R, Fei-Fei L (2014) Large-scale video classification with convolutional neural networks. In: 2014 IEEE conference on computer vision and pattern recognition, pp 1725–1732
Kasturi R et al (2009) Framework for performance evaluation of face, text, and vehicle detection and tracking in video: Data, metrics, and protocol. IEEE Trans Pattern Anal Mach Intell 31(2):319–336
Kay W, Carreira J, Simonyan K, Zhang B, Hillier C, Vijayanarasimhan S, Viola F, Green T, Back T, Natsev P et al (2017) The kinetics human action video dataset. arXiv:1705.06950
Kazi Tani MY, Ghomari A, Lablack A, Bilasco IM (2017) OVIS: Ontology video surveillance indexing and retrieval system. Int J Multimed Inf Retr 6(4):295–316
Ke SR, Thuc HLU, Lee YJ, Hwang JN, Yoo JH, Choi KH (2013) A review on video-based human activity recognition. vol 2, no 2
Ko T (2008) A survey on behavior analysis in video surveillance for homeland security applications, Proc - Appl Imag Pattern Recognit Work
Kong Y, Fu Y (2018) Human Action Recognition and Prediction: A Survey. vol 13, no 9,
Kuehne H, Jhuang H, Garrote E, Poggio T, Serre T (2011) HMDB: A large video database for human motion recognition. In: Proceedings of the IEEE international conference on computer vision, pp 2556–2563
Li T, Chang H, Wang M, Ni B, Hong R, Yan S (2015) Crowded scene analysis: a survey. IEEE Trans Circuits Syst Video Technol 25(3):367–386
Li W, Wong Y, Liu AA, Li Y, Su YT, Kankanhalli M (2017) Multi-camera action dataset for cross-camera action recognition benchmarking. In: Proc - 2017 IEEE Winter Conf. Appl. Comput. Vision, WACV 2017, pp 187–196
Martin A, Martin A, Doddington G, Kamm T, Ordowski M, Przybocki M (1997) . The DET Curve in Assessment of Detection Task Performance 4:1895–1898
Metaxas D, Zhang S (2013) A review of motion analysis methods for human nonverbal communication computing. Image Vis Comput 31(6–7):421–433
Oh S et al (2011) AVSS 2011 demo session: A large-scale benchmark dataset for event recognition in surveillance video. In: 2011 8th IEEE international conference on advanced video and signal based surveillance (AVSS), no 3, pp 527–528
Onofri L, Soda P, Pechenizkiy M, Iannello G (2016) A survey on using domain and contextual knowledge for human activity recognition in video streams. Expert Syst Appl 63:97–111
Over P et al (2013) TRECVID 2013 – An overview of the goals, tasks, data, evaluation mechanisms, and metrics. In: 2013 TREC video retrieval evaluation, TRECVID 2013, no. November
Patcha A, Park JM (2007) An overview of anomaly detection techniques: Existing solutions and latest technological trends. Comput Networks 51 (12):3448–3470
Phan S et al (2017) NII Hitachi UIT at TRECVID 2017
Pirsiavash H, Ramanan D (2012) Detecting activities of daily living in first-person camera views. In: 2012 IEEE conference on computer vision and pattern recognition, pp 2847–2854
Popoola OP, Wang K (2012) Video-based abnormal human behavior recognitiona review. IEEE Trans Syst Man Cybern Part C Appl Rev 42(6):865–878
Poppe R (2010) A survey on vision-based human action recognition. Image Vis Comput 28(6):976–990
Quénot G, Joly P, Benois-Pineau J (2012) Evaluation of visual information indexing and retrieval, pp 83–96
Ramzan M et al (2019) A review on state-of-the-art violence detection techniques. IEEE Access 7:107560–107575
Rana AJ et al (2019) An Online System for Real-Time Activity Detection in Untrimmed Surveillance Videos
Ranjan R, Gleason J, Schwarcz S, Castillo CD, Chen JC, Chellappa R (2020) Spatio-temporal action detection in untrimmed videos. In: 2018 TREC Video Retrieval Evaluation, TRECVID 2018
Räty TD (2010) Survey on contemporary remote surveillance systems for public safety. IEEE Trans Syst Man Cybern Part C Appl Rev 40(5):493–515
Ravanbakhsh M, Nabi M, Mousavi H, Sangineto E, Sebe N (2018) Plug-and-play CNN for crowd motion analysis: an application in abnormal event detection. Proc - 2018 IEEE Winter Conf Appl Comput Vision, WACV 2018 2018-Janua:1689–1698
Ren S, He K, Girshick R, Sun J (2017) Faster r-CNN: towards Real-Time object detection with region proposal networks. IEEE Trans Pattern Anal Mach Intell 39(6):1137–1149
Rose T, Fiscus J, Over P, Garofolo J, Michel M (2009) The TRECVid 2008 event detection evaluation. In: 2009 workshop on applications of computer vision (WACV), pp 1–8
Saha S, Cuzzolin F (2015)
Sangeetha V, Prasad KJR (2006) Syntheses of novel derivatives of 2-acetylfuro[2,3-a]carbazoles, benzo[1,2-b]-1,4-thiazepino[2,3-a]carbazoles and 1-acetyloxycarbazole-2- carbaldehydes. Indian J Chem - Sect B Org Med Chem 45(8):1951–1954
Sch C, Barbara L Recognizing Human Actions: A Local SVM Approach, pp 3–7
Scherp A, Franz T, Saathoff C, Staab S (2009) F - A model of events based on the foundational ontology DOLCE+dns ultralite. In: K-CAP’09 - Proc 5th Int Conf Knowl Capture, pp 137–144
Sharif HU, Saha AK, Arefin KS, Sharif H (2011) Event Detection from Video Streams. vol 01, no 02
Sodemann AA, Ross MP, Borghetti BJ (2012) A review of anomaly detection in automated surveillance. IEEE Trans Syst Man, Cybern Part C (Applications Rev 42(6):1257–1272
Soomro K, Zamir AR, Shah M, Recognition A (2012) UCF101: A Dataset Of 101 Human Actions Classes From Videos in The Wild, no November
Stewart R, Andriluka M, Ng AY (2016) End-to-end people detection in crowded scenes. Proc IEEE Comput Soc Conf Comput Vis Pattern Recognit 2016-Decem:2325–2333
Subetha T, Chitrakala S (2016) A survey on human activity recognition from videos. In: 2016 Int Conf Inf Commun Embed Syst ICICES 2016, no Icices, pp 1–7
Tong W et al (2014) E-LAMP: Integration of innovative ideas for multimedia event detection. Mach Vis Appl 25(1):5–15
Tran D, Bourdev L, Fergus R, Torresani L, Paluri M (2015) Learning spatiotemporal features with 3D convolutional networks. Proc IEEE Int Conf Comput Vis 2015 Inter:4489–4497
Tripathi RK, Jalal AS, Agrawal SC (2018) Suspicious human activity recognition: a review. Artif Intell Rev 50(2):283–339
Tripathi RK, Jalal AS, Agrawal SC (2019) Abandoned or removed object detection from visual surveillance: a review. Multimed Tools Appl 78 (6):7585–7620
Turaga P, Chellappa R, Subrahmanian VS, Udrea O (2008) Machine recognition of human activities: a survey. IEEE Trans Circuits Syst Video Technol 18(11):1473–1488
(2012) Tum kitchen data set. Technische Universitat Munchen
Tzelepis C et al (2016) Event-based media processing and analysis: a survey of the literature. Image Vis Comput 53:3–19
Vishwakarma S, Agrawal A (2013) A survey on activity recognition and behavior understanding in video surveillance. Vis Comput 29(10):983–1009
Wang J, Chen Y, Hao S, Peng X, Hu L (2019) Deep learning for sensor-based activity recognition: a survey. Pattern Recognit Lett 119:3–11
Wang X, Girshick R, Gupta A, He K (2017) [2018-CVPR] Non-local Neural Networks Cvpr2018, pp. 7794–7803, 2018. [11]R. Hou, C. Chen, and M. Shah, Tube Convolutional Neural Network (T-CNN) for Action Detection in Videos. Proc IEEE Int Conf Comput Vis 2017-Octob:5823–5832
Weinland D, Ronfard R, Boyer E (2011) A survey of vision-based methods for action representation, segmentation and recognition. Comput Vis Image Underst 115(2):224–241
Wojke N, Bewley A, Paulus D (2018) Simple online and realtime tracking with a deep association metric. Proc - Int Conf Image Process ICIP 2017-Septe:3645–3649
Xu J, Denman S, Sridharan S, Fookes C (2015) An efficient and robust system for multiperson event detection in real-world indoor surveillance scenes. IEEE Trans Circuits Syst Video Technol 25(6):1063–1076
Xu J, Fookes C, Sridharan S (2016) Automatic Event Detection for Signal-based Surveillance. pp 1–56
Yang P, Xiong J, Xie D, Pu S (2016) HRI Team@ TRECVID 2016 Surveillance Event detection, pp 2–5
Yao L, Qian Y (2018) DT-3DREsnet-LSTM: An architecture for temporal activity recognition in videos. Lect Notes Comput Sci (including Subser Lect Notes Artif Intell Lect Notes Bioinformatics) 11164 LNCS:622–632
Yogameena B, Nagananthini C (2017) Computer vision based crowd disaster avoidance system: a survey. Int J Disaster Risk Reduct 22 (February):95–129
Yoon JH, Yang MH, Lim J, Yoon KJ (2015) Bayesian multi-object tracking using motion context from multiple objects. In: Proc - 2015 IEEE Winter Conf Appl Comput Vision, WACV 2015, pp 33–40
Zabłocki M, Frejlichowski D, Hofman R, Gościewska K (2014) Intelligent video surveillance systems for public spaces – a survey. J Theor Appl Comput Sci 8(4):13–27
Zach C, Pock T, Bischof H (2007) A duality based approach for realtime TV-l 1 optical flow. In: Pattern recognition, vol. 0, no. x. Springer, Berlin, pp 214–223
Zhang HB et al (2019) A comprehensive survey of vision-based human action recognition methods. Sensors (Switzerland) 19(5):1–20
Zhao Y, Han R, Rao Y (2019) A new feature pyramid network for object detection. Proc - 2019 Int Conf Virtual Real Intell Syst ICVRIS 2019:428–431
Zhao Z, et al. (2018) A unified framework with a benchmark dataset for surveillance event detection. Neurocomputing 278:62–74
Zhou B, Andonian A, Oliva A, Torralba A (2018) Temporal relational reasoning in videos. Lect Notes Comput Sci (including Subser Lect Notes Artif Intell Lect Notes Bioinformatics) 11205 LNCS:831–846
Zhou K, Zhu Y, Zhao Y (2017) A spatio-temporal deep architecture for surveillance event detection based on convLSTM. In: 2017 IEEE visual communications and image processing (VCIP), pp 1–4
Zhu Y, Zhou K, Wang M, Zhao Y, Zhao Z (2019) A comprehensive solution for detecting events in complex surveillance videos. Multimed Tools Appl 78(1):817–838
Ziaeefard M, Bergevin R (2015) Semantic human activity recognition: a literature review. Pattern Recognit 48(8):2329–2345
Funding
Open access funding provided by Mid Sweden University.
Author information
Authors and Affiliations
Corresponding author
Additional information
Publisher’s note
Springer Nature remains neutral with regard to jurisdictional claims in published maps and institutional affiliations.
Rights and permissions
Open Access This article is licensed under a Creative Commons Attribution 4.0 International License, which permits use, sharing, adaptation, distribution and reproduction in any medium or format, as long as you give appropriate credit to the original author(s) and the source, provide a link to the Creative Commons licence, and indicate if changes were made. The images or other third party material in this article are included in the article's Creative Commons licence, unless indicated otherwise in a credit line to the material. If material is not included in the article's Creative Commons licence and your intended use is not permitted by statutory regulation or exceeds the permitted use, you will need to obtain permission directly from the copyright holder. To view a copy of this licence, visit http://creativecommons.org/licenses/by/4.0/.
About this article

Cite this article
Karbalaie, A., Abtahi, F. & Sjöström, M. Event detection in surveillance videos: a review. Multimed Tools Appl 81, 35463–35501 (2022). https://doi.org/10.1007/s11042-021-11864-2
Received:
Revised:
Accepted:
Published:
Issue Date:
DOI: https://doi.org/10.1007/s11042-021-11864-2