
Abstract
Intelligent Transportation Systems (ITS) aim to improve safety, mobility and environmental performance of road transport. The INSIGMA project provides a fresh look at the possible innovations in this field, by enhancing the functionality and accuracy of ITS in urban environments. This paper describes the architecture, sensors, processing algorithms, output modules and advantages of the developed system. A comparison of existing ITS systems has been provided as background. Special attention has been given to performance and privacy issues, as the system includes social aspects such as location monitoring.
1 Introduction
Modern Intelligent Transportation Systems (ITS) [32, 50] are a useful and necessary tool to help battle traffic congestion. Among other advantages, it is expected that dynamic traffic control and vehicle navigation will largely raise the constraints of road infrastructure development. Currently, such systems are mainly based on statistical data acquired from historical traffic statistics, which is insufficient, especially in case of a sudden increase in traffic related to accidents and road collisions. Often, there is a narrow range of parameters in control programs that can be tuned. A similar situation occurs in car navigation systems. Statistical traffic data no longer allows to avoid traffic jams and optimal solutions based on real-time data are necessary.
The INSIGMA project [31] is focused on providing advanced tools for traffic monitoring and for detection of dangerous events. The main objective is to analyse traffic parameters using dynamic data, obtained from existing and custom-developed sensors. One of the core concepts of INSIGMA is the dynamic map: a representation of the road transport infrastructure, combined with information about current traffic intensity as well as historical traffic data. Such a set of data includes map-related parameters stored in a database, which can be visualised and delivered to the end user via a dedicated mobile or web interface. The system includes algorithms for dynamic route optimisation, which operate on real-time dynamic data, as opposed to statistical data used by many existing road navigation applications.
The automotive sector is quickly progressing and the total number of vehicles in the world increases quickly. By some estimates [67], already in 2010, over a billion cars have been in use worldwide. The largest increase can be observed in China and other developing countries with large numbers of residents. In turn, the largest percentage of vehicles per capita can be observed in well-developed countries, particularly in Europe, USA, and Japan. In both groups, it is important to maintain an adequate road infrastructure that would meet the growing demands and expectations of its users. The current capacity of roads is insufficient in many places, especially in big cities, and intersections and access roads are the critical parts.
ITS plays a very big role in streamlining the movement of public transport vehicles in big cites which have to cope with the variable traffic volume. Especially in Poland where the motorization levels are greater than, for example, in USA (on the basis of information from Poland Central Statistical Office).
These problems are particularly noticeable during rush hours. Such situations result in tangible economic losses: time irretrievably lost in traffic jams and lost fuel [14]. The environmental aspect of the road traffic is just as important, because a standstill dramatically increases the emission of toxic compounds contained in exhaust gases from internal combustion engines. Another issue is related to the social effects associated with low comfort of transport for vehicle users. There are further transportation challenges including, among others: dangerous goods transportation [23], safety of critical infrastructure [51] or even risk assessment for transportation of hazardous materials in tunnels [43].
Nowadays it is substantial to provide tools for efficient traffic control and threat detection. Existing solutions for map creation and traffic management, often lack efficient tools that enable conversion of object location data and audiovisual data into dynamic maps. In practice, traffic control is often based on low-frequency components of traffic dynamics. In case of mass events, such as popular football matches, existing systems are incapable to respond quickly enough. In such scenarios, traffic problems can be first detected as late as half an hour after they occur. The dynamic traffic component still remains unaddressed and relevant traffic conditions need to be personally recognised by the user in advance or, worse, in the place of event. Thus, in case of a jammed metropolis, the efficiency of route optimisation is often far from what is expected. This is particularly important in daily operations of emergency services, fire brigades, police, etc.
Another problem is the limited coverage of the sensor devices. Traffic detectors are mostly deployed in major highways, but their use in access roads is very sparse. Besides adding more sensors to the infrastructure, it is crucial to develop automatic methods of visual object observation and registration of their trajectory parameters using cameras and other sensors. These systems will provide low-level data from road junctions for generation of dynamic maps. In result, the INSIGMA system will enable interfaces to access optimal routes, information about dangerous events and other intelligent services.
The remainder of this paper is organised as follows. In Section 2, basic functions and services of ITS are discussed; in the following Section 3 the system architecture, basic types of sensors and control algorithms are presented. Conclusions are provided in Section 4.
2 ITS functions and services
Intelligent Transportation Systems (ITS) [4] integrate several underlying technologies: sensing, data interpretation, communications, information integration and control to build a large, efficient and real-time tool to optimise transport. The main goals for development of ITS are safety, mobility and environmental performance [49]. ITS have been developed in various regions with a hope to significantly reduce the number of accidents, increase the throughput of road network, limit travel times and energy consumption, reduce pollution and amend travel comfort and driving conditions. Other expected benefits include lower costs of transport, logistics management and road infrastructure maintenance.
A taxonomy of ITS services [37] comprises more than thirty items grouped into families including:
-
1.
Traveler information (route planning, on-trip information, weather and road condition information, route guidance),
-
2.
Traffic management (TM – transportation planning, traffic control, enforcing traffic regulations, infrastructure maintenance),
-
3.
Emergency support functions (ESF – access to emergency services, enhanced information sharing, emergency management and operations, transportation operations during biohazard situations),
-
4.
Vehicle services (vehicle to vehicle V2V, vehicle to infrastructure V2I/V2X, vision enhancement, automated vehicle operation, collision avoidance, safety readiness),
-
5.
Regular Public Transport (RPT, management, demand responsive transport management, shared transport),
-
6.
Electronic tolling,
-
7.
Commercial vehicle tools (administrative process, on-board safety monitoring, fleet management).
The research and development in domain of ITS was established in the United States, the European Union, Singapore, Japan and South Korea. A comparison of selected ITS solutions with INSIGMA, is presented in Table 1 [19–22, 42, 47, 66].
The presented, very incomplete list in Table 1 is based on [42]. It compares INSIGMA and the most significant programs and projects, recognizable on a global scale. Enough to mention, that the Department of Transportation published in 1999 a report entitled “Intelligent Transportation Systems (ITS) Projects Book”, which describes more than 400 ITS valuable projects realized in that time in the US only [17]. Currently, the most important solutions in the US include, among others, two vehicular communication systems the Vehicle Safety Communication (VSC) and the completive Vehicle Infrastructure Integration (VII), an awarded collision avoidance system IVBSS, as well as the electronic toll collection program E-Z Pass. In Japan, the most recognizable program is the Advanced Safety Vehicle (ASV). Currently in Europe, the scale and progress of research in the domain of ITS are similar to those in the US. Multiple projects and programs funded both by European Community and on a regional, national level, cover road safety, V2V and V2I communication, pedestrians detection, tolling, etc. One of the most complete ITS programs is Cooperative Vehicle-Infrastructure Systems (CVIS), which aims to design and verify a set of the technologies required in terms of road safety, traffic efficiency and environmental protection [12]. Table 2 presents a list of sensors used by selected ITS[2, 19–22, 47, 66].
The comparison presented in Table 2 shows that the most complete solutions in terms of sensing technologies used, are proposed within CVIS. It should be noted that only INSIGMA supports the use of an array of microphones for traffic analysis, although currently in the pilot implementation video detector and GPS tracker are used in practice. It should be emphasized that in future the INSIGMA approach to the traffic management could be implemented in the broadly defined public transport.
There is very little information on performance of systems described in Table 1. This is due to the fact that many of them are in the prototyping phase and can not be considered the production systems. On the other hand, owners of production systems usually do not share detailed performance information, because it is strictly confidential on a very competitive market. The other factor is related to diversity of system functions, for which it is hard to define a uniform set of performance parameters. Moreover, performance may depend on hardware components used, as well as several published parameters are very specific and measured under varying test conditions.
A short review presented below summarizes main features of selected ITS systems.
The VSC-A Project [3] aimed at assessing crash-imminent safety scenarios in autonomous systems that could be addressed and improved by positioning systems, as well as defining a set of vehicle safety applications based on DSRC+Positioning, whose specifications include minimum system performance requirements. An important element of the program was also to develop scalable, common vehicle safety communication architecture, protocols, and messaging framework (interfaces) necessary to achieve interoperability and cohesiveness among different vehicle manufacturers. The program yielded requirements for accurate and affordable vehicle positioning technology, which in conjunction with the 5.9 GHz DSRC may support a number of the safety applications with high-potential benefits. Contrary to VSC-A, INSIGMA focuses on traffic optimization from global and driver’s point of view on the basis of cameras and GPS.
The goal of the Vehicle Infrastructure Integration (VII) program was to deploy infrastructure that supports vehicle-to-infrastructure as well as vehicle-to-vehicle communications for a variety of vehicle safety applications and transportation operations. Additionally, VII will enable deployment of a variety of applications that support private interests, including those of vehicle manufacturers [18].
The Integrated Vehicle-Based Safety Systems (IVBSS) [24] provides several on-board functions such as forward collision warning (FCW), lane departure warning (LDW), lane change warning (LCW) and curve speed warning (CSW). The tests of the IVBSS focused on the user’s acceptance not on the performance. In contrast to INSIGMA Project, IVBSS is driver-centered as well as car-centered.
E-ZPass [29] is a mature system for an electronic toll-collection. This system is used on most tolled roads, bridges, and tunnels in the mid-western and north-eastern United States. Signals emitted by on-board transponders are collected by antennas located at streets and crossroads. The data provide real-time estimates of travel times between common destinations. This information can be also used to determine the best times to schedule lane closing related to maintenance tasks and for other traffic management purposes. Available information about the system performance concerns numbers of handled cars. Total E-ZPass traffic is about 20 million cars per month.
The Advanced Safety Vehicle (ASV) [45] system is built in Japan. This complex guidance system is aware of various elements appearing in environment as vehicles, roads, traffic signs, etc. It also considers such human factors, as mentality or reaction time. Current prototypes are equipped with various sensors (laser radar, CCD-camera, gyroscope, sonar, etc.). Gathered sensor data are processed by the vehicle’s computer, which consults the driver or produces warning signals. Driving decisions and further actions are left to the driver. Recent research and development efforts have led to the implementation of various automation devices. Contrary to INSIGMA System, ASV system is a system supporting the driver only; it does not participate in the traffic management.
The SARTRE Project (Safe Road Trains for the Environment) [8] is an example of V2V technology (vehicle-to-vehicle) funded by the European Commission under the Framework 7 program. It aims at developing strategies and technologies to allow vehicle platoons (road trains) to operate on normal public highways with significant environmental, safety and comfort benefits. The systems will facilitate safe adoption of road trains on unmodified public highways with the interaction with other traffic. The developed scheme assumes that a leading vehicle with a professional driver takes the responsibility for a platoon. Following vehicles enter a semi-autonomous control mode allowing their drivers to engage in activities that would normally be prohibited for safety reasons, for example, operating a phone, reading a book or watching a movie. Initial tests showed that the amount of steering correction made by the automated control system is comparable or smaller than those made by the driver. The SARTRE system was not tested in terms of performance.
The CVIS (Cooperative Vehicle-Infrastructure Systems) [13] is a FP Integrated Project that aims at developing and testing new technologies related to communication of vehicles with near roadside infrastructure. Based on real-time traffic information, many novel applications can be produced. The CVIS objectives are to create a unified technical infrastructure enabling communication in a continuous and transparent way. Additional project objectives address such issues as users’ acceptance, data privacy and security, system openness and interoperability, risk and liability. The key project results are (i) a multi-channel terminal capable of maintaining a continuous Internet connection over a wide range of carriers, including cellular, mobile Wi-Fi networks, infrared or short range microwave channels, ensuring full interoperability in the communication between different makes of vehicles and traffic management systems, (ii) an open architecture connecting in-vehicle systems, traffic management and telematics services at the roadside, (iii) techniques for enhanced vehicle positioning and creation of local dynamic maps, using satellite positioning and radio triangulation, (iv) extended protocols for vehicle, road and environment monitoring to allow vehicles sharing and verifying their data with other vehicles or infrastructure nearby. Communication performance tests showed that there is a tradeoff between communication range and data rate: throughput measured around 20 Mbps can be achieved for a maximum distance around 200 meters, but the communication range can go up to 400/600 meters if the raw data rate setting is lowered. Other tests are related to the handover between roadside stations, handover between different media such as CALM M5 and 2G/3G and handover latency. The measured values ranged around 300 and 600 ms.
The main difference between the INSIGMA and the systems presented above is using video detection and GPS positioning to gather information about the current traffic. An important system feature is a use of ontology to describe traffic parameters. This enables semantic interoperability between system components,as well as its modifiability. Moreover, it gives opportunity to use semantic techniques e.g. reasoning, within system services.
3 INSIGMA system
The concept of the system has been in development for several years. Efficient estimation of the traffic parameters based on video stream from traffic cameras has been described in [27]. The project also addressed the problems of security and traffic surveillance. In [5, 6, 33] an implementation of a Smart Camera was described. The software allows identification of vehicle colors, make and models, as well as read license plates. The basis of the route planning and optimization algorithms has been presented in [10]. To fulfill the system requirements related to modifiability, reliability and performance a prototypes system architecture has been proposed [53] and evaluated using the ATAM method as described in [58], and some preliminary considerations regarding the relation between INSIGMA and other ITS solutions have been published in [11].
The INSIGMA system is based on three main data-oriented components: the Static Map, the Dynamic Map and the Dynamic Map Warehouse, as presented in Fig. 1. They handle slow-changing, fast-changing and historical data related to the transport infrastructure, respectively. The slow-changing data regards road infrastructure, including details like roads, junctions, lanes, traffic signs, and road accessibility. The accessibility parameter indicates whether particular roads are available for specific users, such as regular or emergency vehicles. An emergency vehicle, for instance, is allowed to use a sidewalk, while a regular vehicle is not. The fast-changing data regards dynamic parameters, so-called monitoring parameters, which represent the current or recent traffic conditions and events, including threat reporting or detection. The historical data regards aggregated fast-changing data with relationships to the slow-changing data objects. Separating it from the dynamic parameters provides means to conduct time-based analysis offloading the Dynamic Map.

Base components of the INSIGMA system
Data gathered by these three data stores is accessible through web service-based interfaces: IMS (INSIGMA-Map-Static) Interface, IMD (INSIGMA-Map-Dynamic) Interface, and IHD (INSIGMA-wareHouse-Dynamic) Interface. Additionally, the Dynamic Map Warehouse provides an OLAP Interface allowing for ad-hoc multi-dimensional analysis. The system also has “raw” SQL-based interfaces for internal, high-performance communication. They are mainly used for data transfer from the maps into the warehouse during the ETL (Extraction, Transformation, Loading) process, performed by the Dynamic Map ETL component. They are also used by Sensor Handlers which read data from sensors and feed it into the Dynamic Map.
The data model is consistent across all three main components. It is based on a formal ontology (INSIGMA Ontology) describing the world under consideration [52, 53].
Ontologies are often described as unions of two layers: terminological (TBox) and assertional (ABox). The TBox defines concepts and types of relation including: taxonomic relations between concepts, object properties and datatype properties. The ABox, in turn, gathers facts about individuals and existent relations. Hence, the ontology TBox plays a role similar to a database schema, whereas ABox corresponds to data contained in a database.
While the ontology itself was used to design the main components, it was also used to generate or validate data models and communications. One of such examples is the Schema Generator, which builds appropriate database schemas to store dynamically-changing monitoring parameter values.
At any time this data can be represented as a complete ontology consisting of both a TBox (a terminological component) and an ABox. Details of how the actual values are stored in the database and their relationship with the TBox is given in [68]. Another example is the Sensor Handler component which can verify if raw data coming from sensors meets formal criteria. It can be used to automatically detect sensor malfunctions.
Two main map-related components which are the Static and Dynamic Maps are designed and implemented using the INSIGMA Ontology, which has the following effects. It reinforces the system design process and makes data semantically available. Reinforcing the design process with ontology allows to precisely define data structures and data flows. In turn, it enables to establish clean interfaces between the system’s components. Such an approach makes future alterations and extensions of the system easier. Semantic availability increases the integration capabilities of the system. Since all gathered data is available as ontological facts, they can be easily processed, analyzed, or transferred to third party applications. This way, Further semantic analysis of gathered knowledge is also possible.
Performance of the proposed architecture has been tested and verified. It mostly regards the Dynamic Map component, since it both serves and gathers dynamically-changing data. It has been verified that a single Dynamic Map instance is capable of processing approximately 1,000 raw writes and 10,000 raw read operations per second. Retrieving or storing a single fact requires two raw reads or writes to sustain the database–ontology consistency. Thus, fact processing performance is at approximately 500 write and 5,000 read operations per second. All read operations are triggered by requests passed through interfaces, mostly web services (IMD Interface). Write operations are caused by sensor data acquired from sensors by Sensor Handler. Since a statistical sensor delivers a set of four monitoring parameter facts (queue length, number of vehicles, average speed, passing time) every 90 seconds, the proposed system is capable of handling 11,250 sensors. Assuming that a metropolitan area is equipped with 2,000 sensors it would allow to handle up to five such areas by a single Dynamic Map instance.
A Dynamic Map system running at full throughput, handling 5 metropolitan areas and acquiring data from 11,250 sensors, generates a data growth rate of 500 facts per second. Assuming approximately 100 bytes per fact, the data volume is 28GB per week. Such a growth rate would overload the Dynamic Map by slowing down or crippling its processing capabilities. To prevent that, historical facts are transferred into the Dynamic Map Warehouse. To decrease the amount of data at the warehouse side, the facts are aggregated. Furthermore, the warehouse’s database is capable of flexible storage and processing introducing horizontal scaling. Having separate interfaces to access current and historical data, the IMD Interface and the IHD Interface respectively, enables the client application to choose the proper one, depending on its needs. For the current traffic situation IMD Interface should be used. To analyze traffic flow in time, e.g. to extrapolate traffic intensity, the IHD Interface is the more appropriate choice.
Of course, the functionality of the system needs to be accessible by means of appropriate user interfaces, which make use of the IMS and IMD interfaces described above. Because the services provided by INSIGMA (c.f. Section 3.3) have different characteristics and target user groups, the UIs also need to have different designs and be based on different technologies. The user interface is Various prototypes have been evaluated, and some guidelines regarding both web-based and mobile client applications have been prepared. More information regarding this topic has been presented in Section 3.4.
3.1 Sensors
An important requirement that guided the design of the Dynamic Map was the assumed ability to integrate various types of sensors delivering information about traffic conditions. They include street cameras, inductive loops, microphone arrays, meteo stations and vehicle tracking devices. In this section we will discuss two types of sensors that can be considered complementary: the video detector and the GPS tracker.
3.1.1 The INSIGMA videodetector
A videodetector is the traditional name for a device which performs computer analysis of video streams originating from cameras, in order to determine observed parameters (for instance, of traffic). Each camera is handled by one video detector instance. In its configuration file, the user must define the areas in which the analysis will be conducted. These include polygons restricting the lanes on which the length of the queue is computed as well as virtual lines, used to count the vehicles and calculate their instantaneous velocity. Configuration of the two real scenes is shown in Figs. 2 and 3 .

Scene configuration of the Northern camera. There are 5 queue areas (denoted K) and 4 virtual lines (ZV) defined

Top scene configuration of the Eastern camera. Bottom graphical output from the videodetector corresponding to the scene presented above. The numbers inside rectangles are identifiers of detected objects. The results of vehicle counting are presented near the virtual lines
Traffic parameters described above are determined by the following procedures:
-
Length of the vehicle queue. For a given lane, the point corresponding to the end of the last car is determined. The distance from this point to the STOP line is the length of the queue – only if there is a stationary vehicle on or near the STOP line. Queue length is zero if there is no stopped vehicle near the STOP line,
-
Number of vehicles leaving the intersection. A virtual line located across the given lane is analyzed. Situations are detected when vehicle comes into contact with the line and then leave it. When that occurs, the vehicle counter is increased.
-
Instantaneous speed of vehicles is calculated on the same virtual measurement line where counting cars is done. When the vehicle is passing this line the consecutive displacements of its center of gravity are computed and summed. This sum – divided by the time-of-passing – is the instantaneous speed of a vehicle.
These parameters are averaged over a specified time horizon. It is usually a period of a full cycle of traffic lights. Averaged traffic parameters are passed to the database (the Dynamic Map) through an interface based on the gsoap package.
The optical flow method, which detects moving objects, was chosen as the basis for detection of vehicles. In the authors’ opinion, the advantage of methods based on the calculation of the optical flow against the methods that use background generation [25, 36, 65] is that the vehicle detection performance is independent from weather conditions and that it is possible to detect vehicles with a color similar to the background. However, the use of optical flow requires development of algorithms to track the detected vehicle and remember its position – especially when they are stopped.
A discussion on methods of optical flow calculation has been presented in [27]. Among several tested methods, the Horn-Schunck algorithm was chosen, as it proved to be quite fast and sufficiently accurate. Initially our own implementation of this method was used. Later it was changed to the Horn-Schunck implementation from OpenCV library, which gives comparable results and runs over two times faster. For segmentation, the optical flow modulus was used, which was binarized using a fixed threshold. The algorithm takes the following issues into account: dividing one object into several parts, joining several objects into one and memorizing the temporally stopped objects.
The bottom part of Fig. 3 shows the result of the analysis of one of scenes obtained from the Eastern camera. The lengths of the queues of vehicles K3-E, K1-S and K2-S were detected correctly. They are marked with circles. On the upper three queue areas only one dot is located, because there is only one car stopped. On the lower queue areas two dots are placed on the ends of the analyzed areas since there are long queues of vehicles. Videodetection algorithm correctly segmented three cars moving below areas of queues K1-S and K2-S. However, the bus was split into several segments due to the uniform color of the roof. This will be corrected during the vehicle counting as the segments are close to each other and move in the same direction.
The video detector prototype is running on a computer with a dual-core AMD Athlon II X2 240 (2800 MHz) and 8GB of memory, under Debian GNU/Linux 6.0.5. It analyzes the images coming from two IP cameras (with resolutions of 704x576 and 640x400 pixels) at a speed of about 8 fps. The details of one algorithm step are: image acquisition and gray level conversion – 50 ms, calculation of optical flow – 60 ms, computing traffic parameters takes about 10 ms. Exemplary results of counting and calculating the velocity of vehicles are presented in Table 3.
The analysis of the recorded movies shows that worse results when counting vehicles on the virtual lines ZV-E are due to the same vehicle being counted twice, which pertains to these being driven near the middle of two-lane road. Quite a big error in speed calculation on lines ZV-N is due to the small size of objects (vehicles), caused by the phenomenon of perspective – see the upper right corner of Fig. 3a).
After minor modifications, the video detector can be used to detect accidents, vehicle breakdowns or parking in unauthorized areas. It will be also possible to detect vehicle types, e.g. public transport, using shape descriptors and appropriate recognition methods [1] [59].
3.1.2 GPS tracker
For years, sensors delivering vehicle positioning information, mainly GPS receivers, were used to provide personal route planning services. A typical route planning device is equipped with maps stored in the memory and onboard software, which performs route calculation, tracks the vehicle position and provides instructions for the driver. On the other hand, the growing popularity of smartphones being capable of sending and receiving data over the cellular network has given rise to services in which route calculation is performed on the server side. Moreover, the constant flow of vehicle positioning information can be used for tracking and calculation of traffic parameters (average speed or travel time for individual road segments). Examples of systems which employ such approach are Nericell [39], Mobile Millenium [61], INRIX [30] and Google Maps [28].
All services based on vehicle positioning face the problem of accuracy. Sensor readings are affected by noise with gaussian distribution [62]. Hence, the actual vehicle position is expected to be within a circular or elliptical region around the obtained reading, whose diameter is about 10m for GPS sensors, and about 50m for location based on WiFi maps or cellular triangulation. GPS sensors are quite accurate in open areas, but may yield corrupted data in an urban environment due to poor satellite visibility, e.g. when moving in street canyons or under trees along a road [38].
Reliability of services such as vehicle tracking or real-time traffic monitoring depends heavily on correct map-matching, i.e. on establishing a vehicle’s location on a road segment based on uncertain positioning data. Map-matching algorithms decide which of several candidate road segments should be assumed as the vehicle’s location, based on current sensor readings and/or the history containing past data for a given period. More than thirty map-matching algorithms are surveyed by Quddus et. al in [48], including geometric (e.g. point to segment matching), topological (taking into account road segment joins), probabilistic methods (based on confidence region), as well as application of the Kalman filter or fuzzy rules. Other approaches include particle filters or Hidden Markov Models (HMM) [60].
Within the INSIGMA project, we have developed a subsystem for vehicle tracking and traffic monitoring based on vehicle positioning information, called the GPS tracker. Two alternative map-matching algorithms were used. The first [26] employs geometric matching of two consecutive sensor readings on map segments. The second is a recently developed incremental algorithm [55] based on Hidden Markov Model (HMM).
The operational concept of the the GPS tracker is shown in Fig. 4. The system receives raw data from mobile terminals equipped with GPS receivers. They may buffer GPS readings in the internal memory and send a number of records in bulk feeds. The system may also accept data from a simulator.
-
1.
Raw samples are preprocessed. This step includes trajectory smoothing with Kalman filter (to get rid of outliers) and interpolation of points between GPS readings. The second operation is required to match the map density and handle such situations as vanishing of GPS signal while traveling in tunnels.
Fig. 4 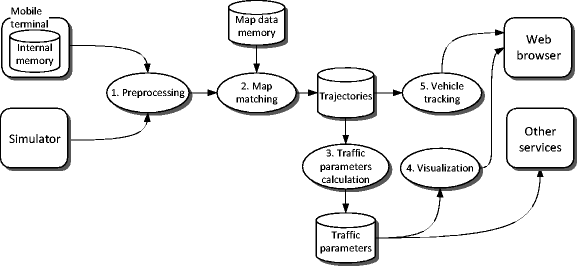
Operational concept of the GPS tracker
-
2.
Then cleansed and normalized samples are submitted to a component implementing map-matching algorithm. The algorithm requires the map data. In the described implementation its source is OpenStreetMap (OSM) [44]. To accelerate computations, the map data are stored in the memory. At the output trajectories of tracked vehicles are fed into the database.
-
3.
Traffic parameters are determined with periodically activated Traffic parameters calculation process and stored in the another database. The step involves also data aggregation based on values and timestamps. We calculate two parameters: average speed and traversal time for a road link.
-
4.
Calculated trajectories can be used for on-line vehicle tracking. Such functionality can be delivered for external clients providing vehicle-based services within an urban environment. Moreover, with built-in rules the system is capable of detecting unexpected drivers behavior based on discrepancy between current speed of their vehicles and calculated medians for route segments
-
5.
The traffic parameters assigned to road links can be used by other components of an ITS (not shown in the figure): route planning [53] or traffic control. For testing purposes the system also provides map visualisation.

Below we briefly discuss the map-matching algorithm based on Hidden Markov Model [54], which seems more robust and accurate than the geometrical one. The algorithm takes at input a sequence of GPS readings (observations) ω=(o i :i=1,n) and constructs a sequence of Hidden Markov Models Λ=(λ i :0=1,n). It is assumed that a GPS readings play the role of observations and HMM states are determined as their projections on road segments in the immediate vicinity. HMM models are characterised by two sets of probability coefficients. The observation probability decides which observation is produced after entering a state (in this case reaching a point on a road segment). For this parameter we have assumed normal probability distribution around the projection point on XY-plane. The transition probability between two states q i and q j describes the probability of reaching the state q j from q i . In this setting HMM states correspond to locations on road segments, and transitions to vehicle movements. Hence, building the model we assumed equal high probabilities for allowed manoeuvres, whereas low non-zero probabilities were attributed to the forbidden ones. We also take into account some dead reckoning, e.g. a probability of traveling at a speed 200km/h in the city would be rather low.
The algorithm (Fig. 5) contains two basic stages: initialisation, during which the first model λ 1 is built and processing that is repeated for successive observations to give models λ 2,…,λ n . The processing stage is further decomposed into expansion and contraction.

Steps of the map-matching algorithm
During the i-th expansion step new states resulting from projecting o i on road segments are added to the previous model λ i−1. The contraction aims at removing outdated states without successors. The actual vehicle trajectory is represented as the most probable path in a lattice of HMM states. Due to successful contractions, in most cases it constitute a string of states. Only under certain circumstances, like presence of parallel roads, the Viterbi algorithm is used [63]. Unlike the algorithm described in [60], the algorithm is incremental, i.e. it may return a certain part of a trajectory on arrival of new data.
An exceptional situation in the expansion phase occurs, if for a given observation o i it is not possible to find candidate road links, on which the point would be projected. We may conclude then, that the map matching algorithm got lost. They may be several reasons of such situations. It may stem from noise that was not sufficiently removed by the Kalman filter. We handle this issue by performing reinitialization and obtaining a new model λ i0. Depending on application the models λ i−1 and λ i0 can be merged. In the case of traffic parameters calculation some tracking errors can be accepted. Thus, λ i−1 model is processed with the Viterbi algorithm to get the most probable path and the whole matching process restarts from λ i0.
Table 4 summarizes the results of experiments that were conducted for 20 GPS traces of total length reaching 150 km registered in Kraków, Poland. As the main criterion used to assess the quality of algorithm we have taken the number of reinitializations (RI) that occurred during map matching. The test were run for (1) originally registered traces, (2) traces corrupted with a Gaussian noise (δ=20m),(3) half-sampled traces obtained by removal of every second reading and (4) combined half-sampled and noise. The results show that the algorithm is robust enough to be applied for tracking and traffic parameter calculation.
Figure 6 presents the results of speed parameter calculation overlaid on a map of Kraków, Poland. As a limited number of input traces were processed during the test, the results obviously do not cover the entire city area. Figure 7 shows the interface of the recently developed vehicle tracking system [7]. The system is capable of displaying both current and historical data for selected vehicles (Fig. 7).

The map with marked average speed values. Legend: red [0,20); yellow [20,50); green [50,90); blue: [90,\(\infty \)]. Assumed units: km/h

The interface of the tracking system. The tracked vehicle speed is marked with green and yellow colors
3.1.3 GPS tracker and energy preservation
An important issue related to GPS tracking services is energy consumption. Active GPS receiver as well as frequent communication over GSM network can exhaust the mobile device battery within 2-3 hours.
There are two basic solutions that can be applied to preserve energy. The first consists in controlling the frequency with which the GPS positions are computed. Larger intervals between two consecutive readings spares energy but may have negative impact on accuracy of map-matching. However, the test results reported in Table 4 (third row) show that the developed algorithm is quite promising with this aspect.
The second solution can be based on controlling the moments, when the data are transmitted from mobile devices, as well as their volume. A 3G radio used for Internet communication has three states [34] differing in energy consumption: idle (0 mW), low power and bandwidth (460 mW) and high power and bandwidth (800 mW). Transition between states occur on data arrival or after idle periods (12 sec and 5 sec). Hence less frequent bulk data transfers may spare energy but, on the other hand, may have negative impact on reliability of vehicle tracking and traffic monitoring services.
An adaptable bulk transfer was implemented in the mobile application developed to cooperate with GPS tracker service. Formally, the problem was modeled as a Markov Decision Process (MDP) [46], in which three state features of a mobile device was taken into account:
-
1.
Battery state: high (51 −100), low (0 −50)
-
2.
Signal strength: high (15 −33), low (0 −14)
-
3.
Data amount: high (>10), low (0 −10)
During experiments several policies (decision to send all data, part of them or do not send) was established for various reward functions related to data age and energy spending while making transitions between eight states (c.f. Table 5) being combinations of the discussed earlier features. In order to determine the probabilities of state transitions, a dedicated system for analysis of data transfer and energy consumption was developed. It was then used to collect about 1200 state instances and results of random transitions, while traveling over the city.
Table 5 gives examples of two policies that were established for two values of discount factor γ used in the MDP model. Applying the value γ=0.1 promotes immediate reward (i.e. sending data), whereas for γ=0.9 the policy favorites waiting for better conditions (and corresponding greater reward in the future).
3.2 Privacy
In the INSIGMA system, privacy is related to both video and GPS/GLONASS tracking. Each digital image from the camera can contain sensitive data, taking into account the privacy of registered persons or vehicles. Special attention is paid to the protection of images of faces, license plates and other information that can be used to identify identity. On the other hand, the stream of images from video monitoring system should be available for advanced tools, such as automatic traffic analysis, threat detection, and possibly to the authorized operator in an emergency service.
Digital watermarking is a technique that allows for embedding information in digital images. The most common use of these solutions includes the protection of rights to protected material by adding a visible item, such as a logo, in a selected image region. A more sophisticated approach is to modify small, unobtrusive parts of an image, such as a selected set of points scattered throughout the image and visible only in the form of a gentle noise, that encode the required information. That way data within a digital image can be protected.
The INSIGMA system allows for securing access to selected data, as well as some protection against image forgery. It is possible to place a copy of the entire image or its fragments in reduced quality in the watermark. At this point, a distinction between the quality of processing different parts of the image should be made. An important observation is that, in practice, a substantial part of the image containing the sensitive contents (e.g. faces, plates, etc.) is generally contained in a small area of the image. This part requires high-quality reconstruction. In contrast, most of the image is the background that can be encoded with low quality. In the particular case of the INSIGMA system, background can be unencoded at all, while protecting sensitive subject content that is pixelized in the protected image [16]. As a result, third parties do not obtain access to identifiable private data.
In another INSIGMA use case [15], placing a copy of the image in a digital watermark enables its protection against counterfeiting. Unauthorized modification is automatically detected and the original content can be restored.
Another important aspect is the privacy of mobile users using devices with GPS/GLONASS receivers. For this reason, the information stored in the system does not include user identification data or record its activity. The collection of data is statistical in nature and limited in location, with particular attention given to intersections. Also, the security of communication between the devices and the system is ensured.
With the above assumptions, the INSIGMA system supports the privacy of its users and bystanders. Moreover, it is planned that during deployment, the system will undergo a rigorous security risk assessment procedure following the approach described in [56, 57].
3.3 Services, algorithms and implementations
Several services have been developed within the INSIGMA project. They are focused on improving the quality of road transport in urban areas using the information from the Dynamic Map and processing it using sophisticated optimisation algorithms. The optimisation process pertains to users’ route planning, as well as global improvement of the road network dynamics. INSIGMA provides the following services:
-
Route optimisation for individual drivers.
-
Global route optimisation.
-
Traffic lights control for local and global traffic management.
-
Traffic management using variable-message signs.
Route optimisation in cities is a very difficult problem due to high variation of travel times in individual road segments. The reason for this is the high variety of the vehicle streams moving along the city streets. An unexpected traffic fluctuation can affect significant areas of the road network, which makes the route optimisation problem very difficult to solve.
The problem of the vehicle stream control in the city using traffic lights is a big challenge. Its difficulties arise not only from the computational complexity, but also from the characteristics of the controlled object. It is not possible to test the proposed algorithms in their working environment, which is the city street network, due to several technical and legal restrictions. The reason is the lack of technical infrastructure which would allow for verification of results obtained from the optimisation algorithms; that would be possible only if a large number of sensors on streets had been installed. The second problem is access to the traffic light control units: it is not allowed due to maintain the drivers safety. Testing the system on a wide scale would require deploying it in at least a few dozen of around 5,000 junctions in Krakow. This causes a several problems with the testing infrastructure (access to power and video streams and service). Therefore, the developed solutions were tested using a special simulation environment provided SUMO [35] or a dedicated model for traffic estimation based on Fuzzy Cognitive Maps [9].
For the proposed network model, several approximation algorithms were developed, with a particular emphasis on the population-based algorithms like GA (genetic algorithm) and PSO (Particle Swarm Optimization). Due to the construction of these algorithms, they can simultaneously determine a set of alternative routes. This property of population algorithms allows, in case of an unexpected fluctuation in traffic (for example, due to a car collision), to quickly switch to an alternative route. Moreover, the population algorithms can use several additional information from the Dynamic Map (e.g. the predicted travel time) while computing the set of alternative routes.
3.3.1 Modeling uncertainty in route optimization
It can be assumed that the travel times are not known exactly, which is actually close to real-life situations. The unknown or, more precisely, uncertain travel times are modelled using different approaches, including stochastic modelling, interval arithmetic and the fuzzy set theory. Several algorithms for route planning based on uncertain information were proposed and developed. The efficiency of the proposed algorithms has been verified on the basis of the real traffic network of the city of Krakw. The experimental research was also conducted using the space-continuous traffic simulator which uses microscopic simulation. This approach simulates the movement of every single vehicle in the street, mostly assuming that the behavior of the vehicle depends on both the vehicle’s physical abilities to move and the driver’s controlling behavior.
In the first half of the 1960s, the first book on interval analysis was written by Ramon E. Moore [41]. Moore’s idea of introducing intervals was not only to provide a treatment of rounding errors and truncation errors in finite precision arithmetic. It also proved that interval arithmetic can probe the behavior of functions efficiently and reliably over whole sets of arguments at once. By its nature, interval arithmetic yields rigorous enclosures for the range of operations and functions. The results are intervals in which the exact results must lie. In the interval approach, an uncertain quantity \(\widetilde {x}\) is represented by a closed bounded real x which is a compact and connected set of real numbers:
where \(\underline {x}, \overline {x} \in \mathbb {R}\) constitutes, the lower and upper bounds of that quantity, respectively. Interval quantities are denoted here (according to the interval standard) by bold face small cap letters. For the interval \(\widetilde {x}\in \left [ \underline {x},\overline {x} \right ]\) no further information about the likeliness of different values is available. The set of all real intervals is denoted by IR. Since an interval is a set, the set operations are well-defined on IR. Real numbers are embedded into IR by the injection which assigns an interval of zero radius [x,x] to the real number x.
The endpoints of an interval are very often denoted by
which is especially useful when instead of x, a more complicated expression occurs. The representation using endpoints is called an inf-sup representation. Based on the fact that an unknown quantity can be represented as a plus/minus approximation of the maximal error bound, the midpoint can be defined as
whereas the radius can be defined as
Elementary arithmetic operations ∘∈{+,−,∗,/} are defined on the set of intervals by the following formula:
3.3.2 Local route optimisation algorithms using interval algebra
The usefulness of any model depends in part on the accuracy and reliability of its output. Because precise input data are sometimes hardly to obtain (e.g. in real-world production planning and scheduling), output values may be imprecise. The main issue in that case is to select a proper representation of uncertain input data and then appropriately propagate those uncertainties through computations. When solving many practical problems, fuzzy or interval numbers are often used to model uncertainties as they are simple but powerful methodologies. The interval number represents a level of uncertainty of the travel time on a certain route. If we find a route not affected by travel time changes, we will ma the special assumption about it. Gamberella [40] defines two types of optimisation problems: (a) the absolute robust shortest path problem and (b) the robust deviation shortest path problem. Let us assume that the scenario r is a feasible realisation of arc costs. A path p from s to t is said to be an absolute robust shortest path (ABS) if it has the smallest (among all paths from s to t) maximum (among all possible feasible scenarios) cost. A path p from s to t is said to be a robust deviation shortest path if it has the smallest (among all paths from s to t) maximum (among all possible scenarios) robust deviation. The robust deviation for a path p from s to t in the scenario r is the difference between the cost of p in r and the cost of the shortest path from s to t in the scenario r. Both problems ABS and RD are NP-hard which makes finding the solution for bigger graphs practically impossible. Moreover, there are doubts about the practical usefulness of this approach.
In the INSIGMA project, other approach to representation of interval number x in the form of the scalar \(\breve {x}\) was proposed:
where \(wid \left (x \right )= \left (\overline {x} -- \underline {x} \right )\) is a interval width and α∈[0,1] defines the confidence level of the average value which describes the real travel time well. Representation of the interval number as a scalar allows using simple and fast Dijkstra or A* algorithms. For example if α = 1, we do not take the interval width of x under consideration, and assume that the average value well describes the real travel time. Otherwise, if α = 0, we consider only the interval width of x. In this case, using Dijkstra or A* algorithms leads to finding the path characterised by the minimal range of changes of the travel time. The main problem is to define the α value. It can be assumed that this value depends on route network properties, day time, size of vehicle streams and some other factors. The value of α can be determined on the basis of simulation tests using a real road network model in the SUMO simulator and information collected by Dynamic Map (Fig. 8). For example, for Kraków, the best value of α is between 0.7 and 0.8 (and depends on time of the day).

Dependence the average travel time and α for 1,000 different paths (repeated 100 times at different time points) in Kraków
3.3.3 Global route optimisation using interval algebra
Thanks to the information from the Dynamic Map, the Route Planning Subsystem (RPS) provides routes for users based on the current road network situation. For this purpose, the information (e.g. road travel time, queue length) from many detectors is analysed. However, parameters originate from various types of detectors working in various conditions. Because of that, the supplied parameters are characterised by limited accuracy resulting from measurement errors.
Centralised navigation system
Developed as part of the INSIGMA project, the centralised navigation system is able to react to the current road situation. The application running in every car is connected with the RPS. In case of a change in the traffic conditions affecting the user’s route (path), a new route based on the current parameter values acquired from the Dynamic Map is calculated. Due to the constant parameter value fluctuations (caused in part by sensor measurement errors), it is crucial to answer the question of when a new route should be computed and sent to the user (driver). In case of the RPS which handles many thousands of customers, it is important to implement the methods with response time in mind. During research, special theorems which can lead to solving this problem were proposed and proved. Additionally, significant shortening of the response time can be achieved using pre-calculated and specially processed data. For example, the shortest path between all vertices (source and destination) in the network can be precomputed and stored in the database. In this case, the new shortest path can be calculated with O(1) complexity, compared to the Dijkstra’s algorithm computational complexity of O(n 2). A quick response is crucial as the car driver in constantly in motion. Nowadays, route planning systems often use precomputing as a method for response time improvement, as presented in [64], among others. In case of mass service systems using cellular technologies as a communications medium, response time is not the only parameter which needs to be optimised. Another important problem is minimisation of the network traffic generated during communication between RPS servers and thousands of customers. Determining the conditions when the new route should be calculated and sent to the user due to the changes of traffic conditions becomes more and more important. Exhaustive tests of the RPS system using the street network in Kraków in SUMO proved that dynamic path changes due to change the road situation, could decrease the average travel time about 5–7 %.
3.3.4 Traffic lights control for local and global traffic management
Traffic control using traffic lights requires taking several factors under consideration. These include:
-
The number of the junctions in the controlled area.
-
The volume and number of the vehicle streams.
-
Junction geometry.
-
Behavioral properties of the drivers.
-
Vehicles properties (acceleration, breaking).
-
Safety rules.
-
Legal aspects.
In order for INSIGMA to satisfy all the demands enumerated above, a set of approximation and construction algorithms for controlling the vehicle stream using traffic lights were designed, developed and tested. Several methods of controlling traffic lights were examined, including cyclic, acyclic and triggered ones as well as one based on the number of stopped vehicles. In addition, in the developed algorithms, several scenarios of neighbouring junction coordination were considered:
-
Isolated coordination.
-
Linked coordination.
-
Alongside or network coordination.
-
Centralised coordination.
The developed algorithms can use one of the scenarios enumerated above. Analyses and tests carried out resulted in creating a system with possibility to adapt to the variable traffic conditions. The system reacts to the current traffic situation by making decisions e.g. about changing the duration of the traffic lights phases or switching to a different optimisation algorithm. The decision about parameter recalculation or changing the algorithm is made when the quality control decreases (the difference between predicted and the observed traffic state increases). In case of significant changes of traffic, the optimisation algorithm may be changed. Such a scheme of system operation is possible thanks to the constant access to the current information about the traffic state with the use of the efficient traffic simulator. The architecture of the system for the traffic lights control is shown in Fig. 9.

Traffic control system architecture
The implemented solution has the features of hierarchical algorithms, where the upper layer (heuristics) is responsible for traffic control, triggering the methods from the lower layer (approximation algorithms). This architecture has its origin in the requirement that the system should adapt itself to the high variability of the traffic situations. Hence, the more precise algorithms with high computational complexity should not always be used. In several cases, it is sufficient to use the simple greedy heuristics.
Below, the main elements of the INSIGMA traffic lights control system are presented:
-
Dynamic Map/ RPS Interface – provides the information about the current traffic state and enables returning the calculated control for traffic lights.
-
Greedy heuristics – the low-complexity greedy heuristics which enables dynamic and local control of traffic lights is used in the low traffic case.
-
Approximation algorithms – a set of algorithms designed and developed in the INSIGMA project, including:
-
Evolution algorithms (GA) – optimisation algorithm simultaneously processing a set of solutions;
-
Simulation annealing algorithm (SA) – a fast algorithm, processing only one solution at a time,
-
Agent system – method used for traffic lights control, based on a self-adaptation mechanism. The goal of the agents is to find a junction synchronisation scheme which provides the maximal throughput.
-
-
Traffic simulator – enables evaluation of the solution found by the approximation algorithms. It uses a detailed road network description (obtained from the Static Map) and the information about the current traffic state (obtained from the Dynamic Map).
-
Control evaluation module – the module is responsible for the evaluation of the traffic control quality. The calculated evaluation is provided for the heuristics responsible for the selection of the control algorithms.
-
Junction topology knowledge base – contains information about the junction topology needed to calculate the restrictions imposed on the length of the traffic lights phases.
Figures 10 and 11 show the difference between the performance of constant light phases and more sophisticated algorithms (an agent system and the simulated annealing algorithm SA) used to control 30 junctions.

Summary length of the vehicle queues waiting to pass the junction (L) in the subsequent intervals of time for the constant phases (red line) and the agents system (blue line); a – medium traffic, b – intense traffic

The relation of drive and stop time for 1000 vehicles (λ) for the constant phases of the traffic lights (black points) and the phases calculated by SA algorithm (gray points)
3.4 User interfaces
Deficiencies in the user interface layer can hamper even the best software backend. Functional requirements are of obvious importance, but the significance non-functional requirements, especially those regarding UI responsiveness are becoming increasingly important, especially when it comes to mobile devices. Also, as the INSIGMA system can potentially be used for various critical tasks, it is important to guarantee its resilience and ability to operate if external services are down. Also, it is the user interface layer that’s most likely to become outdated quickly. To guarantee system maintainability, is is important for the UI layer to be easily replaceable with minimal or no modification to the backend side.
Web-based map applications have become very popular in the recent years. Evolution of CSS and JavaScript technologies enabled interactive visualisation of geographic and georeferenced data. Numerous APIs and services have emerged to allow for easy integration of map content in web applications. These include Google Maps APIFootnote 1, Bing Maps APIFootnote 2 and the collection of MapQuest APIs.Footnote 3 They all operate on the basis of a JavaScript procedure which activates map controls in a predefined DOM element, although some outdated proprietary technologies such as Flash or Silverlight are also supported by some services. Maps are usually visualised as pre-rendered bitmap tiles for different zoom levels, which are used as the background for markers and vector objects (used, for instance, to display traffic levels).
The problem with these solutions is that they make the system essentially dependent on an external service. This means that in case of its malfunction, change of terms of service or exhaustion of query number limit, the client application becomes largely unusable. Therefore, the decision has been made to instead utilise an open-source solution, OpenLayers.Footnote 4 It is also a JavaScript API, but because it is not a hosted service, it is guaranteed to work even if external services are not available. Of course, visualisation of the individual map layers can be (and by default is) performed by external services, but they can be implemented locally, e.g. by means of map rendering systems such as Mapnik.Footnote 5 This would make the system completely independent of external services, as the INSIGMA data model contains all data necessary not only to perform route planning, but also for map visualisation.
Modern mobile platforms usually have built-in APIs for map visualisation. Apple’s iOS has been using Google Maps with for visualisation purposes up to version 5. Version 6 has introduced their own mapping solution, which is a very responsive vector-based solution (though it had faced some serious criticism upon its initial release). Current Android versions are based on Google Maps, but the variant used recently is a vector-based rendering engine. Regardless of that, numerous third-party mobile APIs have emerged. For instance, Google offers its Google Maps API on iOS; MapQuest has versions of its API for iOS and for Android.
End-user navigation is one of the most probable uses of the mobile client application. In recent years, most navigation software has been fitted with 3-dimensional user interfaces. Implementation of such interface may not be possible using built-in or third-party map APIs. Thus, such a user interface would probably need a lot more implementation work to be performed.
Integration of the client applications with the backend are also an important aspect. The INSIGMA system provides REST-based web services for all necessary functional components, as outlined in Section 3. These interfaces use the JSON (JavaScript Object Notation) language to encode query data and generate output. In comparison to SOAP-based XML solutions, there is significantly less overhead, which makes the data more compact and enables easier parsing on the client side.
4 Conclusions
The paper presents contribution of the INSIGMA project to the Intelligent Transportation System (ITS) domain. The proposed tools and components provide functions and services related to traveler information, traffic management and emergency transportation operations. They are build around the Dynamic Map concept, a repository which gathers dynamically changing and constantly updating traffic and event-oriented information.
The information gathered by the Dynamic Map comes from several sensors deployed in an urban area including but not limited to: video detectors and GPS trackers. Data acquisition and processing from these two types of sources is described in details.
Several services are also provided. These include route planing and traffic lights optimisation as well as traffic management. The services are implemented by a hierarchy of redundant algorithms switched among by a heuristic component to increase accuracy and decrease response time.
Comparing with other ITS, the proposed system provides a comprehensive, integrated source of traffic related information. It is capable of being easily extend with a range of diverse sensors. Furthermore, it is applicable to urban areas where centralised and global route planning services tailored for specific users provide the greatest impact.
From a variety of functions which can be provided by an ITS (c.f. Section 2), the system developed within the INSIGMA project supports: traveler information, including route planning, on-trip traffic information and route guidance, as well as traffic management (transportation planning and traffic control). The key concept within the system is the Dynamic Map, which integrates the description of a road network with dynamically-changing traffic information. Traffic parameters are currently delivered by two types of sensors: video detector and GPS tracker. However, the design of the system is flexible enough to integrate almost any type of sensor. One important issue related to data collection is privacy protection and security. This aspect was addressed during the system design. Within the project, advanced algorithms for dynamic route planning and traffic control have been developed. It is expected that their application in real life will significantly improve mobility and environmental performance.
References
Adam G, Glowacz W (2008) Automatic shape recognition of film sequence with application of backpropagation neural network. In: Conference on human system interactions. IEEE, pp 76–81
Adamski A, Hełdak G (2014) Intelligent recognition of the preference structures for multi-criteria management and traffic control methods in its systems. Instytut Logistyki i Magazynowania, Logistyka
Administration NHTS (2004) Vehicle safety communications project: task 3 final report: identify intelligent vehicle safety applications enabled by dsrc. Tech. rep., National Highway Traffic Safety Administration, Office of Research and Development, Washington D.C., pp 2004–149
An Sh, Lee BH, Shin DR (2011) A survey of intelligent transportation systems. In: 2011 3rd international conference on computational intelligence, communication systems and networks (CICSyn). IEEE, pp 332–337
Baran R, Glowacz A, Matiolanski A (2013) The efficient real- and non-real-time make and model recognition of cars. Multimed Tools Appl:1–20. doi:http://dx.doi.org/10.1007/s11042-013-1545-2
Baran R, Rusc T, Rychlik M (2014) A smart camera for traffic surveillance. In: Dziech A, CzyŻewski A (eds) Multimedia communications, services and security, Communications in computer and information science. doi:10.1007/978-3-319-07569-3_1, vol 429. Springer International Publishing, pp 1–15
Brewczyński Ł, Dziedzic F. (2014) Vehicle tracking system. Master’s thesis, Department of Applied Computer Science AGH University of Science and Technology
Chan E, Gilhead P, Jelinek P, Krejci P, Robinson T (2012) Cooperative control of sartre automated platoon vehicles
Chmiel W, Szwed P (2015) Learning fuzzy cognitive map for traffic prediction using an evolutionary algorithm. In: Dziech A, Leszczuk M, Baran R (eds) Multimedia communications, services and security, communications in computer and information science. doi:10.1007/978-3-319-26404-2_16, vol 566. Springer International Publishing, pp 195–209
Chmiel W, Kadłuczka P, Ernst S (2011) A multicriteria model for dynamic route planning. In: Dziech A, CzyŻewski A (eds) Multimedia communications, services and security, communications in computer and information science. doi:10.1007/978-3-642-21512-4, vol 149. Springer, Berlin, pp 174–182
Chmiel W, Dańda J, Dziech A, Ernst S, Głowacz A, Kadluczka P, Mikrut Z, Pawlik P, Szwed P, Wojnicki I (2014) Contribution of the INSIGMA project to the field of intelligent transportation systems. In: Dziech A, CzyŻewski A (eds) Multimedia communications, services and security. doi:10.1007/978-3-319-07569-3_5, vol 429. Springer, Berlin, pp 58–72
CVIS Cooperative Vehicle Infrastructure Systems. http://www.cvisproject.org/ (Last accessed: Sep 2014)
Cvis project. http://www.cvisproject.org/ (2015). Online; accessed 10-December-2015
Deloitte Research: Combating gridlock: how pricing road use can easy congestion (2003)
Dziech A, Bialas J, Glowacz A, Leszczuk M, Matiolanski A, Baran R (2013) Overview of recent advances in CCTV processing chain in the INDECT and INSIGMA projects. IEEE CPS, Regensburg
Dziech A, Glowacz A, Korus P, Szmuc W Method and system for restricting access to sensitive contents of digital images (2012). Patent App. 13/524,609
U.S. Department of Transportation (1999) Intelligent transportation systems projects book, Intelligent Transportation Systems (ITS) Joint Program Office
U.S. Department of Transportation (2015) Vehicle infrastructure integration (VII), Research and Innovative Technology Administration. www.its.dot.gov/vii/ (Online - last accessed: Dec-2015)
U.S. Department of Transportation (2014) Integrated Vehicle-Based Safety Systems, Intelligent Transportation Systems (ITS) Joint Program Office www.nhtsa.gov (Online - last accessed: Sep 2014)
U.S. Department of Transportation (2014) Vehicle Safety Communications - Applications VSCA. National Highway Traffic Safety Administration, www.nhtsa.gov (Online -last accessed: Sep 2014)
et al, SB: DVE monitoring modules design and development. www.aide-eu.org (Last accessed: Sep 2014)
Ezell S (2010) Intelligent transportation systems. Tech. rep., The Information Technology & Innovation Foundation
Fabiano B, Curro F, Reverberi AP, Pastorino R (2005) Dangerous good transportation by road: from risk analysis to emergency planning, vol 18
Ference JJ, Szabo S, Najm WG Performance evaluation of integrated vehiclebased safety systems. In: Proceedings of the performance metrics for intelligent systems (PerMIS) Workshop, National Institute of Standards and Technology, p 23
Gaborski R. S., Paskali J. (2007) A cognitively motivated video detection system. Res J Appl Sci Eng Technol 1(1):51–57
Gleba K, Caban P, Wiacek H, Kantyka G (2013) The concept of GPSTracker for intelligent system for global monitoring detection and identification of threats (INSIGMA). In: Military communications and information systems conference (MCC), pp 1–6
Glowacz A, Mikrut Z, Pawlik P (2012) Video detection algorithm using an optical flow calculation method. In: MCSS 2012, CCIS 287. Springer, pp 118–129
Google Official Blog: The bright side of sitting in traffic: Crowdsourcing road congestion data. http://googleblog.blogspot.com/2009/08/bright-side-of-sitting-in-traffic.html. Online: last accessed: Dec 2013
Group EZ E-zpass. http://www.e-zpassiag.com (2015). Online; accessed 12-December-2015
INRIX: Inrix home page. http://www.inrix.com/default.asp. Online: last accessed: Dec 2013
INSIGMA project. http://insigma.kt.agh.edu.pl (Last accessed: Mar 2014)
Intelligent transport system. http://ec.europa.eu/transport/themes/its/index_en.htm (Last accessed: Mar 2014)
Janowski L, Kozłowski P, Baran R, Romaniak P, Glowacz A, Rusc T (2014) Quality assessment for a visual and automatic license plate recognition. Multimedia Tools and Applications 68(1):23–40. doi:10.1007/s11042-012-1199-5
Kasera S, Narang N (2004) 3G Networks. Tata McGraw-Hill professional-networking series. Tata McGraw-Hill Pub. http://books.google.pl/books?id=b5d0_au-z9MC
Krajzewicz D, Erdmann J, Behrisch M, Bieker L (2012) Recent development and applications of SUMO - Simulation of Urban Mobility. Int J Advances Systems and Measurements 5(3&4):128–138
Li Q, Dang H, Zhang Y, Wu D (2011) Video vehicle detection and tracking system. In: CSE 2011, Part II, CCIS 202. Springer, pp 24–31
McQueen B, McQueen J (1999) Intelligent transportation systems architectures. Artech House Publishers, Norwood
Modsching M., Kramer R., ten Hagen K. (2006) Field trial on GPS accuracy in a medium size city: the influence of built-up. In: 3Rd workshop on positioning, navigation and communication , pp 209–218
Mohan P, Padmanabhan VN, Ramjee R (2008) Nericell: rich monitoring of road and traffic conditions using mobile smartphones. In: Proceedings of the 6th ACM conference on embedded network sensor systems. ACM, pp 323–336
Montemanni R, Gambardella L (2002) An algorithm for the relative robust shortest path problem with interval data. Tech rep
Moore RE, Yang CT (1959) Interval analysis I. Technical Document LMSD-285875. Lockheed Missiles and Space Division, Sunnyvale
Naja R (2013) Wireless vehicular networks for Car Collision Avoidance. Springer Science & Business Media
Nathanail1 EG, Zaharis S, Vagiokas N, Prevedouros PD (2010) Risk assessment for transportation of hazardous materials through tunnels. Transp Res Rec 2162:98–106
OpenStreetMap: OpenStreetMap Wiki. http://wiki.openstreetmap.org/ (2013). [Online; accessed Sept 2014]
Paromtchik I, Laugier C The advanced safety vehicle programme
Puterman ML (2009) Markov decision processes: discrete stochastic dynamic programming, vol 414. Wiley
Qi Y, Chen X, Yang L, Wang B, Yu L (2009) Vehicle infrastructure integration (VII) based Road-Condition warning system for highway collision prevention. Tech. rep., Texas Southern University
Quddus MA, Ochieng WY, Noland RB (2007) Current map-matching algorithms for transport applications: State-of-the art and future research directions. Transp Res C Emerg Technol 15(5):312–328
Research and Innovative Technology Administration (RITA) : Intelligent transportation systems (ITS). http://www.its.dot.gov/. Online: last accessed: Feb 2014
RITA intelligent transportation systems. http://www.its.dot.gov (Last accessed: Mar 2014)
Ronchia E, Colonnaa P, Capoteb J, Alvearb D, Berlocoa N, Cuestab A (2012) The evaluation of different evacuation models for assessing road tunnel safety analysis. Tunn Undergr Space Technol 30:74–84
Sliwa J, Gleba K, Chmiel W, Szwed P, Glowacz A (2011) IOEM - ontology engineering methodology for large systems. In: Jedrzejowicz P, Nguyen NT, Hoang K (eds) Computational collective intelligence. Technologies and applications - 3rd international conference, ICCCI 2011, Gdynia, Poland, September 21-23, 2011, Proceedings, Part I, Lecture Notes in Computer Science. doi:10.1007/978-3-642-23935-9_59, vol 6922. Springer, pp 602–611
Szwed P, Kadluczka P, Chmiel W, Glowacz A, Sliwa J (2012) Ontology based integration and decision support in the INSIGMA route planning subsystem. In: Ganzha M, Maciaszek LA, Paprzycki M (eds) FedCSIS, pp 141–148
Szwed P, Pekala K (2014) An incremental map-matching algorithm based on hidden markov model. In: Rutkowski L, Korytkowski M, Scherer R, Tadeusiewicz R, Zadeh LA, Zurada JM (eds) Artificial intelligence and soft computing, lecture notes in computer science. doi:10.1007/978-3-319-07176-3_51, vol 8468. Springer International Publishing, pp 579–590
Szwed P, Pekala K (2014) Beyond databases, architectures, and structures, communications in computer and information science. In: Kozielski S, Mrozek D, Kasprowski P, Małysiak-Mrozek B, Kostrzewa D (eds). doi:10.1007/978-3-319-06932-6_41, vol 424. Springer International Publishing, pp 425–434
Szwed P, Skrzynski P (2014) A new lightweight method for security risk assessment based on fuzzy cognitive maps. Appl Math Comput Sci 24(1):213–225. doi:10.2478/amcs-2014-0016
Szwed P, Skrzynski P, Chmiel W (2014) Risk assessment for a video surveillance system based on fuzzy cognitive maps. Multimedia Tools and Applications :1–24. doi:10.1007/s11042-014-2047-6
Szwed P, Wojnicki I, Ernst S, Głowacz A (2013) Services and security application of new ATAM tools to evaluation of the dynamic map architecture. In: Dziech A, CzyŻewski A (eds) Multimedia communications, services and security. Springer, Berlin, pp 248–261
Tadeusiewicz R (2011) How intelligent must a system be for image analysis? In: Kwasnicka H, Jain LC (eds) Innovations in intelligent image analysis, studies in computational intelligence, vol 339. Springer, Berlin, pp 5–10
Thiagarajan A, Ravindranath L, LaCurts K, Madden S, Balakrishnan H, Toledo S, Eriksson J (2009) Vtrack: accurate, energy-aware road traffic delay estimation using mobile phones. In: Proceedings of the 7th ACM conference on embedded networked sensor systems. ACM, pp 85–98
University of California, Berkeley: Mobile millenium project. http://traffic.berkeley.edu/. Online: last accessed: Dec 2013
VanDiggelen F (2007) GNSS Accuracy: lies, damn lies, and statistics. GPS World 0107:26–32
Viterbi A (1967) Error bounds for convolutional codes and an asymptotically optimum decoding algorithm. IEEE Trans Inf Theory 13(2):260–269
Volker L (2008) Route planning in road networks with turn costs. Universitat Karlsruhe, Fakultat fur Informatik
Wang Y, Zou Y, Shi H, Zhao H (2009) Video image vehicle detection system for signaled traffic intersection. In: HIS - Ninth international conference on hybrid intelligent systems. IEEE CS press, pp 222–227
Wani K (2006) The 4th phase of advanced safety vehicle project - technologies for collision avoidance. In: Proceedings of the 13th ITS world congress
Ward’s Automotive Group: Vehicles in operation by country (2010)
Wojnicki I, Szwed P, Chmiel W, Ernst S (2012) Ontology oriented storage, retrieval and interpretation for a dynamic map system. In: Dziech A, CzyŻewski A (eds) Multimedia communications, services and security, communications in computer and information science. doi:10.1007/978-3-642-30721-8_37, vol 287. Springer, Berlin, pp 380–391
Author information
Authors and Affiliations
Corresponding author
Additional information
Open Access
This article is distributed under the terms of the Creative Commons Attribution 4.0 International License (http://creativecommons.org/licenses/by/4.0/), which permits unrestricted use, distribution, and reproduction in any medium, provided you give appropriate credit to the original author(s) and the source, provide a link to the Creative Commons license, and indicate if changes were made.
Work has been co-financed by the European Regional Development Fund under the Innovative Economy Operational Programme, INSIGMA project no. POIG.01.01.02-00-062/09.
Rights and permissions
Open Access This article is distributed under the terms of the Creative Commons Attribution 4.0 International License (http://creativecommons.org/licenses/by/4.0/), which permits unrestricted use, distribution, and reproduction in any medium, provided you give appropriate credit to the original author(s) and the source, provide a link to the Creative Commons license, and indicate if changes were made.
About this article

Cite this article
Chmiel, W., Dańda, J., Dziech, A. et al. INSIGMA: an intelligent transportation system for urban mobility enhancement. Multimed Tools Appl 75, 10529–10560 (2016). https://doi.org/10.1007/s11042-016-3367-5
Received:
Revised:
Accepted:
Published:
Issue Date:
DOI: https://doi.org/10.1007/s11042-016-3367-5