
Abstract
The authors synthesize research on the relationship of customer satisfaction with customer- and firm-level outcomes using a meta-analysis based on 535 correlations from 245 articles representing a combined sample size of 1,160,982. The results show a positive association of customer satisfaction with customer-level outcomes (retention, WOM, spending, and price) and firm-level outcomes (product-market, accounting, and financial-market performance). A moderator analysis shows the association varies due to many contextual factors and measurement characteristics. The results have important theoretical and managerial implications.
1 Introduction
Oliver (2014, p. 8) defines customer satisfaction (CS) as “a judgment that a product/service feature or the product or service itself provided (or is providing) a pleasurable level of consumption-related fulfillment, including levels of under- or over-fulfillment.” Similarly, Anderson and Sullivan (1993, p. 126) characterize CS as a “post-purchase evaluation of product quality given repurchase expectations.” Thus, CS is a customer’s evaluative summary judgment of consumption experiences that is associated with customer- and firm-level outcomes.
Although we may theoretically know and expect that CS will have a positive association with many outcomes such as retention, WOM, and sales, a systematic and large-scale meta-analysis can provide important insights. First, it is important to compare differences in the strength of relationship across different customer- and firm-level outcomes (e.g., CS-retention vs. CS-sales). Second, it is important to examine the considerable variation in the magnitude of these relationships across studies. For example, some studies find the CS-retention correlation to be nonsignificant (e.g., van Birgelen, de Jong, and de Ruyter 2006) while others find a strong positive association (e.g., Anderson and Sullivan 1993).
Understanding the reasons behind these systematic differences can yield new and important research questions and insights. For example, is the association between CS and customer-level consequences stronger (or weaker) for business-to-consumer (B2C) markets relative to business-to-business (B2B) markets? What is the theoretical reason behind this difference, and what are its practical implications? Answering these questions can suggest more nuanced testable hypotheses and guide practitioners as well.
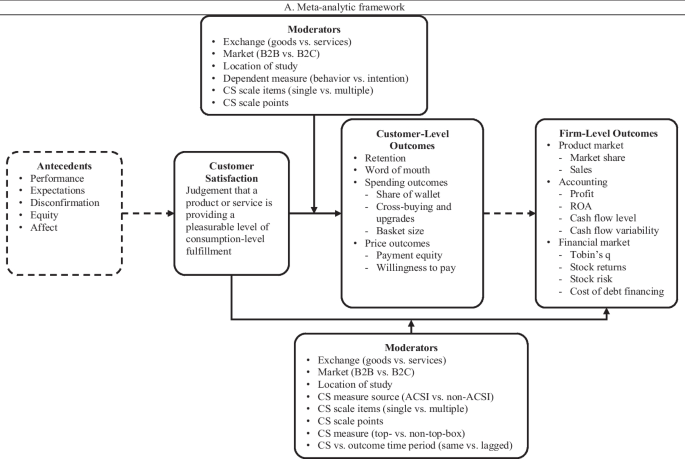
This study investigates the association of CS with 14 outcomes in a meta-analytic framework (see Fig. 1, panel A). These outcomes include customer outcomes, product-market performance, accounting performance, and financial-market performance. These outcomes are of great importance to a firm’s chief marketing officer (CMO), chief sales officer (CSO), chief financial officer (CFO), and chief executive officer (CEO) (see Fig. 1, panel B).

Customer satisfaction and its outcomes
As shown in Table 1, there have been three meta-analyses of CS published in marketing journals. Szymanski and Henard (2001) conducted the first meta-analysis including 50 studies. Among them, 15 studies examined three CS outcomes (complaining, negative WOM, and repurchase) while 35 examined antecedents of CS. No studies investigated CS and firm-level outcomes.
Curtis et al. (2011) focused on CS and three customer-level outcomes, retention behavior, retention intention, and loyalty, with no firm-level outcomes. They showed that the positive association of CS with retention and loyalty varies across exchanges (goods vs. services), markets (B2C vs. B2B), and locations of study (North America vs. Europe vs. others).
The most recent meta-analysis by Otto, Szymanski, and Varadarajan (2020) did not examine any customer-level outcomes and included only five out of ten firm-level outcomes examined in the current study. While they included moderators such as goods vs. services and ACSI vs. non-ACSI metrics, factors such as location of study and scale points were not included.
This meta-analysis uses 535 effect sizes from 245 articles representing a combined sample size of 1,160,982 units, examines 14 effects, and includes nine moderators. It is the most comprehensive meta-analysis to date with a much larger number of articles, customer- and firm-level outcomes, and moderators (see Table 1).
2 Theoretical framework
Within the attitude-intentions-behavior framework (Fishbein and Ajzen 1975), satisfaction judgments are a function of expectations, disconfirmation, and performance (see, for a review, Oliver 2014). Satisfaction judgments drive customers’ behavioral intentions, which in turn guide subsequent actions such as WOM, repurchase, and spending. As customers repeatedly engage in these behaviors, their satisfaction judgments, intentions, and action are reinforced. The result of this process is a cumulative satisfaction judgment (Anderson, Fornell, and Lehmann 1994) and associated outcomes. This general process undergirds the framework in Fig. 1, panel A. Note the current meta-analysis examines CS and its outcomes (and not antecedents).
2.1 Customer- and firm-level outcomes of customer satisfaction
Extant research has linked CS to four customer-level outcomes (retention, WOM, price outcomes, and spending outcomes) and ten firm-level outcomes (e.g., sales, cash flow, stock returns, and Tobin’s q). Their definition, measures, and respective calculations are shown in Table 2, panel A.
2.2 Moderators of the CS-outcomes relationship
Table 2, panel B reports the nine moderators examined in this meta-analysis. These include (1) contextual factors such as type of exchange and location of study and (2) measurement characteristics including the number of items and the number of scale points in the CS measure, the source of CS measure (e.g., ACSI), the calculation of CS score (e.g., top-box score), and the measurement of outcome (e.g., behavior).Footnote 1
3 Methodology
3.1 Literature search
We identified studies using computerized searches of Web of Knowledge, ScienceDirect, and EBSCO with the keywords “customer satisfaction” and “consumer satisfaction.” We examined each issue of the major marketing journals in the USA and Europe starting from 1980.Footnote 2 Prior to 1980, CS research focused on its antecedents. We also reviewed and included pertinent articles from the three meta-analyses in Table 1.
3.2 Criteria for inclusion/exclusion
A study was excluded if it: (1) measured satisfaction with specific attributes but not overall satisfaction, (2) used a composite measure of multiple outcomes (e.g., latent construct of repurchase and recommendation), and (3) did not report correlations or information that could be converted to correlations.Footnote 3 When a study provided multiple effect sizes, either for separate samples or relationships, we treated effects as independent. When a study provided multiple effect sizes for the same relationship (e.g., for subsets of the same sample), we calculated the average effect size. The final analyses use 535 correlations from 245 articles (N = 1,160,982).
3.3 Approach to analysis
We calculate inverse-variance-weighted reliability-adjusted correlations between CS and each outcome (Hunter and Schmidt 2004). To adjust for reliability, we use Cronbach’s alpha (Nunally 1978) as a reliability measure and divide the raw correlations by the square root of the product of reliabilities of CS and the outcome. We are unable to correct for reliability for firm-level outcomes because they use a single metric based on archival financial data. We then transform the reliability-adjusted correlations to Fisher’s z coefficients and weight them by the inverse variance (i.e., 1/[N – 3]). Finally, we transform the Fisher’s z coefficients back to correlations to arrive at the weighted reliability-adjusted correlations.Footnote 4 The analyses use a random effects approach for effect size integration.
3.3.1 Publication bias
To address the file-drawer problem, we report the fail-safe N (FSN). This calculates the number of studies that would have to be missing from the analysis to nullify an effect or reduce it to a level that is not theoretically or practically significant (Orwin 1983). A funnel plot shows minimal publication bias (Fig. A1 in Web Appendix A).
3.3.2 Homogeneity and moderator analysis
The Q test assesses between-study variability in the population effect size estimated by the individual studies.Footnote 5 In Table 3, a statistically significant Q statistic suggests the need for subgroup analysis (e.g., Pick and Eisend 2014). Thus, we compare effect sizes across different levels of each moderator.
4 Results
4.1 CS and customer-level outcomes
Table 3, panel A reports that CS has a strong association with retention (r = 0.60, p < 0.01) and WOM (r = 0.68, p < 0.01) and is moderately correlated with spending (r = 0.28, p < 0.01) and price outcomes (r = 0.39, p < 0.01).Footnote 6 The statistically significant Q tests (ps < 0.01) for all four outcomes indicate that effect sizes may vary based on exchange type, market type, location of study, measurement of outcome, scale items, and scale points. Disaggregated results are shown in panel A of Table A2 in Web Appendix A and discussed next.
4.2 Moderator analysis for customer-level outcomes
4.2.1 Exchange
For retention, the association with CS is stronger for mixed exchanges (rMIXED = 0.69) than for services (rSERVICES = 0.56) but not for goods (rGOODS = 0.57); the association does not differ between goods and services. The association between CS and WOM is statistically not different among goods (rGOODS = 0.66), services (rSERVICES = 0.64), and mixed exchanges (rMIXED = 0.74). For spending outcomes, the association with CS is statistically similar for goods (rGOODS = 0.38), services (rSERVICES = 0.22), and mixed exchanges (rMIXED = 0.27). Finally, the association of CS and price outcomes is also not statistically different across goods (rGOODS = 0.08), services (rSERVICES = 0.41), and mixed exchanges (rMIXED = 0.34).Footnote 7
4.2.2 Market
The CS-retention association is statistically stronger in B2B (rB2B = 0.66) than in B2C (rB2C = 0.55) but not in mixed markets (rMIXED = 0.63). The CS-WOM relationship is stronger in B2B markets than in others (rB2C = 0.61 vs. rB2B = 0.74 vs. vs. rMIXED = 0.42). The CS-spending outcomes relationship is not statistically different across B2C (rB2C = 0.33), B2B (rB2B = 0.16), and mixed markets (rMIXED = 0.23). Finally, the CS-price outcomes association is statistically similar in B2C and B2B markets (rB2C = 0.41 vs. rB2B = 0.18).
4.2.3 Location of study
Relative to Europe, North American samples exhibit a stronger association of CS with retention (rNORTH.AMERICA = 0.63 vs. rEUROPE = 0.51 vs. rASIA = 0.64 vs. rAFRICA = 0.82), WOM (rNORTH.AMERICA = 0.71 vs. rEUROPE = 0.57 vs. rASIA = 0.65 vs. rAFRICA = 0.41), and price outcomes (rNORTH.AMERICA = 0.75 vs. rEUROPE = 0.35). For spending outcomes, the association with CS does not statistically differ among samples from North America (rNORTH.AMERICA = 0.25), Europe (rEUROPE = 0.30), and Asia (rASIA = 0.50).
4.2.4 Measurement of outcome
The association with CS is stronger when the outcome is measured as intentions than as behaviors for retention (rBEHAVIOR = 0.21 vs. rINTENTION = 0.65) and WOM (rBEHAVIOR = 0.50 vs. rINTENTION = 0.71) but not for spending outcomes (rBEHAVIOR = 0.24 vs. rINTENTION = 0.41).
4.2.5 Scale items
The association with CS is stronger when a single- vs. a multiple-item CS scale is used for retention (rSINGLE = 0.66 vs. rMULTI = 0.55) and WOM (rSINGLE = 0.73 vs. rMULTI = 0.59) but statistically not different for spending outcomes (rSINGLE = 0.22 vs. rMULTI = 0.31).
4.2.6 Scale points
The association of CS with outcomes is statistically similar for 5-, 7-, 10-, and 100-point scales (r5-POINT = 0.62 vs. r7-POINT = 0.60 vs. r10-POINT = 0.50 vs. r100-POINT = 0.54 for retention; r5-POINT = 0.65 vs. r7-POINT = 0.71 vs. r10-POINT = 0.50 vs. r100-POINT = 0.65 for WOM; r5-POINT = 0.28 vs. r7-POINT = 0.33 vs. r10-POINT = 0.21 vs. r100-POINT = 0.23 for spending outcomes; and r5-POINT = 0.24 vs. r7-POINT = 0.41 for price outcomes).
4.3 CS and firm-level outcomes
The CS-outcomes correlation is smaller at the firm level than at the customer level (see Table 3, panel B) potentially because firm-level outcomes are more distal than customer-level outcomes. Different than the association of CS with customer-level outcomes, the magnitude of the association of CS with firm-level outcomes can be classified as small to moderate. Footnote 8
Specifically, CS has a positive and statistically significant association with sales (r = 0.15, p < 0.01), profit (r = 0.10, p < 0.01), ROA (r = 0.22, p < 0.01), Tobin’s q (r = 0.29, p < 0.01), and stock returns (r = 0.08, p < 0.05); a negative and statistically significant association with cash flow variability (r = –0.10, p < 0.01), risk (r = –0.23, p < 0.01), and cost of debt financing (r = –0.14, p < 0.01). CS has a nonsignificant association with market share (r = 0.05, p > 0.10) and a weak positive association with cash flow (r = 0.09, p < 0.10), which may occur because they likely represent multiple subgroups with large between-group variability in the association (Whitener 1990). Footnote 9
The Q statistics for all outcomes, except for cost of debt financing, indicate a statistically significant heterogeneity among studies (see Table 3, panel B). Yet, with a small number of exceptions, the association between CS and firm-level outcomes is not statistically different across subgroups based on different levels of moderators (see panel B of Table A2 in Web Appendix A). There are several potential reasons for the statistically nonsignificant results. First, for several moderator levels, each outcome has been investigated by a small number of studies (i.e., k in panel B of Table A2 in Web Appendix A). Second, most of the firm-level studies include samples from multiple industries and preclude us from isolating correlations based on specific industry settings. Finally, published studies typically do not report correlations disaggregated by firm-level moderators such as firm size, advertising and R&D intensity, and industry concentration. Therefore, we report means by subgroups for firm-level outcomes but do not discuss them further.
5 Implications
5.1 Research implications
First, the moderator analysis shows that there is substantial and systematic heterogeneity in the positive association between CS and customer-level outcomes. Yet, we do not understand the different patterns of variability and their implications. As an example, the association of CS with price outcomes is more heterogeneous than its association with spending outcomes across markets, exchange types, and locations of study. Is it because firms have more control on price outcomes but not on spending outcomes? These issues need further research.
Second, studies that simultaneously examine and compare the association of CS with multiple customer-level outcomes under different contexts are needed. Specifically, attention to differences in effect sizes among subgroups as well as their causes and implications is a key research direction.
Third, the association of CS is strongest for WOM, followed by retention, and is the weakest for spending and price outcomes. Future research should develop a conceptual and theoretical framework to understand these relative differences. Thus, is it the case that higher CS is more beneficial for growing new customers than retaining current customers? To the extent that WOM affects the cost of attracting new customers, customer equity research can be expanded by including CS as a contributing factor for retaining current customers and attracting new customers. Third, a wider set of potential moderators including psychological constructs such as trust and commitment as well as structural factors such as company size, industry growth, and competitive intensity should be investigated.
Fourth, these results make a very strong case that consumer behavior scholars should use CS as a consequential dependent variable in their studies. CS has a clear association with actual consumer behaviors and firm-level financial outcomes. Thus, consumer behavior scholars can be reasonably assured that differences in CS are consequential, i.e., predictive of actual consumer behaviors and firm financial outcomes.
Fifth, these results call into question the long-standing insistence on using multi-item scales for measuring CS. The CS-outcomes linkage is impervious to single- vs. multiple-item scales or number of scale points (i.e., 5- vs. 7- vs. 10- vs. 100-point scale). Simple and single item scales suffice; this is an important insight for practitioners who value simplicity to reduce the cost of customer surveys.
Sixth, at the firm level, the mean association of CS with market share (p > 0.10) and cash flow (p < 0.10) is nonsignificant to weak (Table 3, panel B). This may be the case if the association of CS with these outcomes is nonlinear and/or contingent on factors such as firms’ ability to standardize or customize their offerings, the heterogeneity in consumer preferences, and the nature of the offering (e.g., goods vs. services; Anderson, Fornell, and Rust 1997). In the same vein, CS has a stronger association with ROA than with cash flow. While we can speculate on the potential reasons for this, more studies are needed to better estimate the effects and explain the differences. Finally, the small number of studies for subgroups within different levels of moderators precluded specific conclusions; clearly, more studies on CS-firm outcomes are needed.
5.2 Implications for firm strategy and senior executives
Figure 1, panel B organizes the outcomes of CS based on their relevance to CMOs, CSOs, CFOs, and CEOs and board members. CMOs who organize their efforts around CS and make CS as their key metric should be able to make a case for their relevance and contribution to customer retention, WOM, spending, and price outcomes. While CMOs are free to focus on other constructs such as net promoter, this research provides clear, strong, and convincing evidence for using CS as a metric to measure marketing and sales performance and relate it to firm performance. Specifically, CS can provide the basis for CMOs and CSOs to collaboratively grow the current customer base organically as well as expand it through additional sales. The positive association of CS with ROA and cash flow and its negative association with cash flow variability speak to CFOs.
Finally, our work makes a clear case for CEOs and board members to utilize CS as an organizing framework for strategy planning and execution. By making customer value, as measured through CS, the central mechanism for creating and implementing strategy, CEOs can reliably increase Tobin’s q and stock returns while decreasing risk, outcomes for which CEOs are most responsible.
In summary, a focus on CS can align C-suite members (CEO, CFO, CMO, and CSO) using a theoretically sound, conceptually consistent, and empirically validated approach. We hope that senior leaders in firms embrace a satisfaction-based approach to strategy planning and execution based on these results.
6 Concluding comments
CS is a core construct for guiding strategy research and a consequential outcome for consumer-behavior research. This meta-analysis of 535 effect sizes from 245 articles shows that the positive outcomes of CS at the customer- and firm-level vary across different outcomes and across different study characteristics. The results provide guidance for research scholars and show how senior executives can adopt a CS-based framework to develop, guide, and implement firm strategy.
The current research has limitations. First, the results are limited by data availability, which precluded a larger number of outcomes or additional moderators. Second, variation in effect sizes remained even after accounting for contextual and measurement factors, suggesting that sources of variation still exist. Finally, our analysis was based on traditional meta-analytic framework and could not capture nonlinearity in the relationship between two constructs. Studies reporting correlations at different levels of moderators and boundary conditions in the association of CS with its consequences can be helpful in this regard.
Data Availability
Please contact authors for data availability.
Notes
We calculated the proportion of studies for each combination of levels in different moderators. Table A1 in Web Appendix A reports the proportions showing adequate variation in study settings.
Journals include Journal of Marketing, Journal of Marketing Research, Marketing Science, Journal of Consumer Research, Journal of Service Research, Journal of Retailing, Journal of the Academy of Marketing Science, Journal of Services Marketing, Journal of Service Industry Management, Journal of Consumer Satisfaction, Dissatisfaction, and Complaining Behavior, Journal of Business Research, and International Journal of Service Industry Management. The list of papers included in the meta-analysis is provided in Web Appendix B.
We contacted 44 authors to request missing correlations for studies, and 17% of them provided the correlations.
We use the Fisher’s z transformation due to potential issues associated with using raw correlations. Specifically, different than Fisher’s z scores, raw correlations may be highly skewed and have a problematic standard error formulation: the standard error is used to compute the inverse variance weight in the meta-analysis (Lipsey and Wilson 2001). Still, we computed results using raw correlations. Reassuringly, most of the results remained unchanged when using Fisher’s z or correlations.
The Q statistic is computed by summing the squared deviations of each study’s effect estimate from the overall estimate, weighting each study by the inverse of its variance, and has a chi-square distribution with k – 1 degrees of freedom (k = number of effect sizes). A statistically significant Q statistic indicates the effect size varies across studies. The Q statistic has low power to detect heterogeneity when the number of studies is small or sample size within studies is low. Thus, it should be interpreted cautiously.
The very small sample size for goods and mixed exchanges precludes meaningful statistical comparisons.
We use Cohen’s (1992) standards for effect sizes in our interpretation. It may be the case that higher/more conservative standards are required because lower-level variability influences higher-level effects (e.g., individual-level variability is ignored in the estimate of firm-level effects).
Notably, the magnitude and the statistical significance of the correlations of CS with market share, sales, profit, Tobin’s q, and stock returns are similar to those reported in Otto, Szymanski, and Varadarajan (2020).
References
Anderson, E. W. (1998). Customer satisfaction and word of mouth. Journal of Service Research, 1(1), 5–17.
Anderson, E. W., Fornell, C., & Lehmann, D. R. (1994). Customer satisfaction, market share, and profitability: findings from Sweden. Journal of Marketing, 58(3), 53–66.
Anderson, E. W., Fornell, C., & Rust, R. T. (1997). Customer satisfaction, productivity, and profitability: Differences between goods and services. Marketing Science, 16(2), 129–145.
Anderson, E. W., & Mansi, S. A. (2009). Does customer satisfaction matter to investors? Findings from the bond market. Journal of Marketing Research, 46(5), 703–714.
Anderson, E. W., & Sullivan, M. W. (1993). The antecedents and consequences of customer satisfaction for firms. Marketing Science, 12(2), 125–143.
Bhattacharya, A., Morgan, N. A., & Rego, L. L. (2021). Customer satisfaction and firm profits in monopolies: A study of utilities. Journal of Marketing Research, 58(1), 202–222.
Bolton, R. N., Lemon, K. N., & Verhoef, P. C. (2008). Expanding business-to-business customer relationships: Modeling the customer’s upgrade decision. Journal of Marketing, 72(1), 46–64.
Cohen, J. (1992). A power primer. Psychological Bulletin, 112(1), 155–159.
Curtis, T., Abratt, R., Rhoades, D. L., & Dion, P. (2011). Customer loyalty, repurchase and satisfaction: A meta-analytical review. Journal of Consumer Satisfaction, Dissatisfaction and Complaining Behavior, 24, 1–26.
Fishbein, M., & Ajzen, I. (1975). Belief, attitude, intention and behavior: An introduction to theory and research. Addison-Wesley.
Gruca, T. S., & Rego, L. L. (2005). Customer satisfaction, cash flow, and shareholder value. Journal of Marketing, 69(3), 115–130.
Homburg, C., Wieseke, J., & Hoyer, W. D. (2009). Social identity and the service–profit chain. Journal of Marketing, 73(2), 38–54.
Hunter, J. E., & Schmidt, F. L. (2004). Methods of meta-analysis (2nd ed.). Sage.
Jacobson, R., & Mizik, N. (2009). The financial markets and customer satisfaction: Reexamining possible financial market mispricing of customer satisfaction. Marketing Science, 28(5), 810–819.
Lipsey, M. W., & Wilson, D. T. (2001). Practical meta-analysis. Applied social research methods series. SAGE.
Loveman, G. W. (1998). Employee satisfaction, customer loyalty, and financial performance: An empirical examination of the service profit chain in retail banking. Journal of Service Research, 1(1), 18–31.
Mittal, V., Han, K., Lee, J., & Sridhar, S. (2021). Improving business-to-business customer satisfaction programs: assessment of asymmetry, heterogeneity, and financial impact. Journal of Marketing Research, 58(4), 615–643.
Mittal, V., & Kamakura, W. A. (2001). Satisfaction, repurchase intent, and repurchase behavior: Investigating the moderating effect of customer characteristics. Journal of Marketing Research, 38(1), 131–142.
Mittal, V., Kumar, P., & Tsiros, M. (1999). Attribute-level performance, satisfaction, and behavioral intentions over time: A consumption-system approach. Journal of Marketing, 63(2), 88–101.
Morgan, N. A., & Rego, L. L. (2006). The value of different customer satisfaction and loyalty metrics in predicting business performance. Marketing Science, 25(5), 426–439.
Nunally, J. C. (1978). Psychometric theory (2nd ed.). McGraw-Hill Book Company.
Oliver, R. L. (2014). Satisfaction: A behavioral perspective on the consumer. Routledge.
Orwin, R., & G. (1983). A fail-safe N for effect size in meta-analysis. Journal of Educational Statistics, 8(2), 157–159.
Otto, A. S., Szymanski, D. M., & Varadarajan, R. (2020). Customer satisfaction and firm performance: Insights from over a quarter century of empirical research. Journal of the Academy of Marketing Science, 48(3), 543–564.
Pick, D., & Eisend, M. (2014). Buyers’ perceived switching costs and switching: a meta-analytic assessment of their antecedents. Journal of the Academy of Marketing Science, 42(2), 186–204.
Pritchard, M., & Silvestro, R. (2005). Applying the service profit chain to analyse retail performance. International Journal of Service Industry Management, 16(4), 337–356.
Szymanski, D. M., & Henard, D. H. (2001). Customer satisfaction: A meta-analysis of the empirical evidence. Journal of the Academy of Marketing Science, 29(1), 16–35.
Tuli, K. R., & Bharadwaj, S. G. (2009). Customer satisfaction and stock returns risk. Journal of Marketing, 73(6), 184–197.
van Birgelen, M., de Jong, A., & de Ruyter, K. (2006). Multi-channel service retailing: The effects of channel performance satisfaction on behavioral intentions. Journal of Retailing, 82(4), 367–377.
Verhoef, P. C. (2003). Understanding the effect of customer relationship management efforts on customer retention and customer share development. Journal of Marketing, 67(4), 30–45.
Whitener, E. M. (1990). Confusion of confidence intervals and credibility intervals in meta-analysis. Journal of Applied Psychology, 75(3), 315–321.
Author information
Authors and Affiliations
Corresponding author
Ethics declarations
Conflict of interest
The authors have no conflicts of interest to disclose.
Ethical approval
Not applicable.
Statements and Declarations
The authors have no competing interests to declare that are relevant to the content of this article.
Additional information
Publisher’s note
Springer Nature remains neutral with regard to jurisdictional claims in published maps and institutional affiliations.
Supplementary information
Rights and permissions
Open Access This article is licensed under a Creative Commons Attribution 4.0 International License, which permits use, sharing, adaptation, distribution and reproduction in any medium or format, as long as you give appropriate credit to the original author(s) and the source, provide a link to the Creative Commons licence, and indicate if changes were made. The images or other third party material in this article are included in the article's Creative Commons licence, unless indicated otherwise in a credit line to the material. If material is not included in the article's Creative Commons licence and your intended use is not permitted by statutory regulation or exceeds the permitted use, you will need to obtain permission directly from the copyright holder. To view a copy of this licence, visit http://creativecommons.org/licenses/by/4.0/.
About this article

Cite this article
Mittal, V., Han, K., Frennea, C. et al. Customer satisfaction, loyalty behaviors, and firm financial performance: what 40 years of research tells us. Mark Lett 34, 171–187 (2023). https://doi.org/10.1007/s11002-023-09671-w
Accepted:
Published:
Issue Date:
DOI: https://doi.org/10.1007/s11002-023-09671-w