
Abstract
The article builds on the current debate on how accounting tools can assist top management teams to manage their resources, while communicating a variety of data and information about value creation to their stakeholders. Within this debate, the study focuses on a recent tool for corporate reporting, the Integrated Reporting (〈IR〉), and investigates its utility to support the development of a holistic model for managing strategic resources to create value. To operationalize the 〈IR〉 according to this perspective, the article combines 〈IR〉 with the Dynamic Resource-Based View (DRBV) of the firm on the basis of their common idea that strategic resources are interconnected and have to be managed with the collaboration of all stakeholders in order to inform governance actions and create value with a holistic perspective. For the two case studies analyzed, the information provided by the two organizations’ 〈IR〉 is specifically organized and re-framed using “resource mapping”, which is a DRBV-based visual and analytical technique representing the causal relationships between resources and governance actions. In this way, we not only aim to re-organize and visualize existing information into a new form, but we also expect to describe and communicate the dominant logic in the business and the leverage points where the value creation process lies, supporting the usefulness of Integrated Reporting as a management and governance tool.


Notes
More specifically, we emphasize that a resource map may or may not require quantification (see Warren 2002, 2008 for examples) or formal algebraic modelling and simulation (of the kind used in System Dynamics). Specifically, this choice depends on whether the issue facing the management team is essentially interpretist (reconciling conflicting views about strategy) or functionalist (seeking insight into the likely outcome of an agreed strategy), or somehow a combination of the two (see Kunc and Morecroft 2009 about this).
Due to copyright issues the reports (or images from the reports) cannot be presented in this article. The full reports are available at the following web addresses:
ENI 2015—https://www.eni.com/docs/en_IT/enicom/company/integrated-annual-report-2015.pdf.
ENI 2016—https://www.eni.com/docs/en_IT/enicom/publications-archive/publications/reports/reports-2016/Integrated-Annual-Report-2016.pdf.
SASOL 2015—http://www.sasol.com/extras/air_reports/air_2015/files/assets/basic-html/page-1.html#.
SASOL 2016—http://www.sasol.com/financial-reports/annual-integrated-report-30-june-2016.
Capabilities can be represented in System Dynamics models as stocks (for more details see Rahmandad 2012 and Rahmandad and Repenning 2016). However, we decided to represent capabilities not as a stock following literature in the RBV (see Sect. 2.3.1). Additionally, the two organizations explicitly list some capabilities as variables and not resources (e.g., Process upgrade and Technological upgrade for the ENI’s 2015 IR are referred to as “main actions” and not as capitals/resources).
On defining the typology of feedback loops see what Sterman (2000, pp. 144–145) states: “The right way to determine the polarity of a loop is to trace the effect of a small change in one of the variables as it propagates around the loop. If the feedback effect reinforces the original change, it is a positive loop; if it opposes the original change, it is a negative loop. You can start with any variable in the loop; the result must be the same”.
References
Abeysekera, I. (2013). A template for integrated reporting. Journal of Intellectual Capital, 14(2), 227–245.
Adams, C. A. (2004). The ethical, social and environmental reporting-performance portrayal gap. Accounting, Auditing and Accountability Journal, 17(5), 731–757.
Adams, C. A. (2015). The international integrated reporting council: A call to action. Critical Perspectives on Accounting, 27(1), 23–28.
Alazzani, A., & Wan-Hussin, W. N. (2013). Global reporting initiative’s environmental reporting: A study of oil and gas companies. Ecological Indicators, 32, 19–24.
Amir, E., Lev, B., & Soungiannis, T. (2003). Do financial analysts get intangibles? European Accounting Review, 13(4), 635–659.
Andriof, J., Waddock, S., Husted, S., & Rahman, S. S. (2002). Unfolding stakeholder thinking: Theory, responsibility and engagement. Sheffield: Greenleag Publishing.
Atkins, J., Atkins, B. C., Thomson, I., & Maroun, W. (2015a). “Good” news from nowhere: Imagining utopian sustainable accounting. Accounting, Auditing and Accountability Journal, 28(5), 651–670.
Atkins, J. F., Solomon, A., Norton, S., & Joseph, N. L. (2015b). The emergence of integrated private reporting. Meditari Accountancy Research, 23(1), 28–61.
Barnabè, F. (2016). “Representing” value creation: A combined approach of System dynamics and integrated reporting for the airline sector. International Journal of Applied Systemic Studies, 6(3), 202–222.
Barnabè, F., & Giorgino, M. C. (2013). ‘Integrating’ business model and strategy. In C. Busco, M. L. Frigo, A. Riccaboni, & P. Quattrone (Eds.), Integrated reporting (pp. 111–126). Cham: Springer.
Barney, J. B. (1986). Strategic factor markets: Expectations, luck and business strategy. Management Science, 32(10), 1231–1241.
Barney, J. B. (1991). Firm resources and sustained competitive advantage. Journal of Management, 17(1), 99–120.
Baxter, P., & Jack, S. (2008). Qualitative case study methodology: Study design and implementation for novice researchers. The Qualitative Report, 13(4), 544–556.
Beattie, V., & Smith, S. J. (2013). Value creation and business models: Refocusing the intellectual capital debate. The British Accounting Review, 45(4), 243–254.
Beck, C., Dumay, J., & Frost, G. (2017). In pursuit of a ‘single source of truth’: From threatened legitimacy to integrated reporting. Journal of Business Ethics, 141(1), 191–205.
Belkaoui, A., & Karpik, P. G. (1989). Determinants of the corporate decision to disclose social information. Accounting, Auditing and Accountability Journal, 2(1), 36–51.
Berelson, B. (1952). Content analysis in communication research. New York: Free Press.
Bernardi, C., & Stark, A. W. (2018). Environmental, social and governance disclosure, integrated reporting, and the accuracy of analyst forecasts. The British Accounting Review, 501(1), 16–31.
Burgman, R., & Roos, G. (2007). The importance of intellectual capital reporting: Evidence and implications. Journal of Intellectual Capital, 8(1), 7–51.
Burke, J. J., & Clark, C. E. (2016). The business case for integrated reporting: Insights from leading practitioners, regulators, and academics. Business Horizons, 59(3), 273–283.
Busco, C., Frigo, M. L., Quattrone, P., & Riccaboni, A. (2013a). Redefining corporate accountability through integrated reporting. Strategic Finance, 8(August), 33–41.
Busco, C., Frigo, M. L., Riccaboni, A., & Quattrone, P. (Eds.). (2013b). Integrated reporting. Concepts and cases that redefine corporate accountability. Cham: Springer.
Camilleri, M. A. (2017). The integrated reporting of financial, social and sustainability capitals: A critical review and appraisal. International Journal of Sustainable Society., 9(4), 311–326.
Charreaux, G., & Desbrières, P. (2001). Corporate governance: Stakeholder value versus shareholder value. Journal of Management and Governance, 5(2), 107–128.
Cheng, M., Green, W., Conradie, P., Konishi, N., & Romi, A. (2014). The international integrated reporting framework: Key issues and future research opportunities. Journal of International Financial Management & Accounting, 25(1), 90–119.
CIMA. (2014). Tomorrow’s Business. Success using integrated reporting to help create value and effectively tell the full story. London: Centre for Tomorrow’s Company.
de Villiers, C., Rinaldi, L., & Unerman, J. (2014). Integrated reporting: Insights, gaps and an agenda for future research. Accounting, Auditing and Accountability Journal, 27(7), 1042–1067.
de Villiers, C., & Sharma, U. (2017). A critical reflection on the future of financial, intellectual capital, sustainability and integrated reporting. Critical Perspectives on Accounting (forthcoming).
Dierickx, I., & Cool, K. (1989). Asset stock accumulation and sustainability of competitive advantage. Management Science, 35(12), 1504–1511.
Donaldson, T., & Preston, L. E. (1995). The stakeholder theory of the corporation: Concepts, evidence, and implications. Academy of Management Review, 20(1), 65–91.
Druckman, P. (2014). Integrated reporting: A new governance tool. The Corporate Board, 35(206), 6–10.
Dumay, J. (2015). Who is the IIRC’s integrated reporting rhetoric really for? Social Value and Intangibles Review, 2(Spring), 86–88.
Dumay, J. (2016). A critical reflection on the future of intellectual capital: From reporting to disclosure. Journal of Intellectual Capital, 17(1), 168–184.
Dumay, J., Bernardi, C., Guthrie, J., & Demartini, P. (2016). Integrated reporting: A structured literature review. Accounting Forum, 40(3), 166–185.
Eberlein, R. L., & Peterson, D. W. (1992). Understanding models with Vensim™. European Journal of Operational Research, 59(1), 216–219.
Eccles, R. G., & Krzus, M. P. (2010). Integrated reporting for a sustainable strategy. Financial Executive, 26(2), 28–32.
Eccles, R. G., & Krzus, M. P. (2011). One report. Integrated reporting for a sustainable strategy. New York: Wiley and Sons.
Eccles, R. G., Krzus, M. P., & Ribot, S. (2015). The integrated reporting movement: Meaning, momentum, motives and materiality. Hoboken: Wiley.
Eccles, R. G., & Mavrinac, S. C. (1995). Improving the corporate disclosure process. Sloan Management Review, 36(4), 11–26.
Eccles, R. G., & Saltzman, D. (2011). Achieving sustainability through integrated reporting. Stanford Social Innovation Review, 59(Summer), 56–61.
Eccles, R. G., & Serafeim, G. (2014). Corporate and integrated reporting: A functional perspective. Cambridge: Harvard Business School.
Eisenhardt, K. M. (1989). Building theories from case study research. Academy of Management Review, 14(4), 532–550.
Elo, S., & Kyngäs, H. (2008). The qualitative content analysis process. Journal of Advanced Nursing, 62(1), 107–115.
ENI (2015). Integrated Annual Report 2015. https://www.eni.com/docs/en_IT/enicom/company/integrated-annual-report-2015.pdf. Accessed 2 Dec 2016.
ENI (2016). Integrated Annual Report 2016. https://www.eni.com/docs/en_IT/enicom/publications-archive/publications/reports/reports-2016/Integrated-Annual-Report-2016.pdf. Accessed 9 June 2017.
Fink, A., Marr, B., Siebe, A., & Kuhle, J. P. (2005). The future scorecard: Combining external and internal scenarios to create strategic foresight. Management Decision, 43(3), 360–381.
Flammer, C., & Luo, J. (2017). Corporate social responsibility as an employee governance tool: Evidence from a quasi-experiment. Strategic Management Journal, 38(2), 163–183.
Flower, J. (2015). The international integrated reporting council: A story of failure. Critical Perspectives on Accounting, 27, 1–17.
Forrester, J. W. (1961). Industrial dynamics. Cambridge: The M.I.T. Press.
Forrester, J. W. (1968a). Principles of systems. Cambridge: The M.I.T. Press.
Forrester, J. W. (1968b). Industrial dynamics-after the first decade. Management Science, 14(7), 398–415.
Freeman, R. E. (1984). Strategic management: A stakeholder approach. New York: Cambridge University Press.
Freeman, R. E., Harrison, J. S., & Wicks, A. C. (2007). Managing for stakeholders: Survival, reputation, and success. New Haven: Yale University Press.
Freeman, R. E., & Reed, D. (1983). Stockholders and stakeholders: A new perspective on corporate governance. California Management Review, 25(3), 88–106.
Gary, M. S., & Wood, R. E. (2011). Mental models, decision rules, and performance heterogeneity. Strategic Management Journal, 32(6), 569–594.
Grant, R. M. (1991). The resource-based theory of competitive advantage: Implications for strategy formulation. California Management Review, 33(3), 114–135.
Grant, R. M. (2016). Contemporary strategy analysis text only. Chichester: Wiley.
Gray, R. (2006). Social, environmental and sustainability reporting and organisational value creation? Whose value? Whose creation? Accounting, Auditing and Accountability Journal, 19(6), 793–819.
Green W. J., & Cheng, M. M. (2018). Materiality judgments in an integrated reporting setting: The effect of strategic relevance and strategy map. Accounting, Organizations and Society, (in press).
Greenwood, M. (2007). Stakeholder engagement: Beyond the myth of corporate responsibility. Journal of Business Ethics, 74(4), 315–327.
Groesser, S. N., & Schaffernicht, M. (2012). Mental models of dynamic systems: Taking stock and looking ahead. System Dynamics Review, 28(1), 46–68.
Guenther, E., Hoppe, H., & Poser, C. (2007). Environmental corporate social responsibility of firms in the mining and oil and gas industries: Current status quo of reporting following gri guidelines. Greener Management International, 53, 7–25.
Guthrie, J., & Abeysekera, I. (2006). Content analysis of social, environmental reporting: What is new? Journal of Human Resource Costing and Accounting, 10(2), 114–126.
Guthrie, J., Petty, R., Yongvanich, K., & Ricceri, F. (2004). Using content analysis as a research method to inquire into intellectual capital reporting. Journal of Intellectual Capital, 5(2), 282–293.
Hall, R. (1993). A framework linking intangible resources and capabilities to sustainable competitive advantage. Strategic Management Journal, 14(8), 607–618.
Harrison, J. S., Bosse, D. A., & Phillips, R. A. (2010). Managing for stakeholders, stakeholder utility functions and competitive advantage. Strategic Management Journal, 31(1), 58–74.
Humphreys, K. A., Gary, M. S., & Trotman, K. T. (2016). Dynamic decision making using the balanced scorecard framework. The Accounting Review, 91(5), 1441–1465.
Hutton, A. (2004). Beyond financial reporting an integrated approach to disclosure. Journal of Applied Corporate Finance, 16(4), 8–16.
International Integrated Reporting Council (IIRC) (2013a). The International 〈IR〉 Framework. http://www.theiirc.org/international-ir-framework/. Accessed 30 April 2016.
International Integrated Reporting Council (IIRC). (2013b). Value Creation. Background paper for 〈IR〉. http://integratedreporting.org/wp-content/uploads/2013/08/Background-Paper-Value-Creation.pdf. Accessed 30 April 2016.
International Integrated Reporting Council (IIRC). (2013c). Capitals. Background paper for 〈IR〉. http://integratedreporting.org/wp-content/uploads/2013/03/IR-Background-Paper-Capitals.pdf. Accessed 30 April 2016.
Jones, T. M., & Wicks, A. C. (1999). Convergent stakeholder theory. Academy of Management Review, 24(2), 206–221.
Kampmann, C. E., & Oliva, R. (2006). Loop eigenvalue elasticity analysis: Three case studies. System Dynamics Review, 22(2), 141–162.
Kaplan, R. S., & Norton, D. (1992). The balanced scorecard: Measures that drive performance. Harvard Business Review, 70(1), 71–79.
Kaplan, R. S., & Norton, D. P. (2000). Having trouble with your strategy? Then map it!. Harvard Business Review, September–October, pp. 167–176.
Kaplan, R. S., & Norton, D. P. (2004). Strategy maps: Converting intangible assets into tangible outcomes. Boston: Harvard Business School Press.
Kazakov, R., & Kunc, M. (2016). Foreseeing the dynamics of strategy: An anticipatory systems perspective. Systemic Practice and Action Research, 29(1), 1–25.
Kim, H., & Andersen, D. F. (2012). Building confidence in causal maps generated from purposive text data: Mapping transcripts of the Federal Reserve. System Dynamics Review, 28(4), 311–328.
Kolk, A. (2010). Trajectories of sustainability reporting by MNCs. Journal of World Business, 45(4), 367–374.
KPMG (2011). Integrated Reporting. Performance insight through better business reporting. Issue 1.
KPMG (2012). Integrated reporting. Performance insight through better business reporting. Issue 2.
Krippendorff, K. (2004). Content analysis: An introduction to its methodology. Thousand Oaks: SAGE Publications.
Krzus, M. P. (2011). Integrated reporting: If not now, when. Zeitschrift fuer Internationale Rechnungslegung, 6, 271–276.
Kunc, M. (2008). Using systems thinking to enhance strategy maps. Management Decision, 46(5), 761–778.
Kunc, M., & Morecroft, J. D. W. (2007). System dynamics modelling for strategic development. In R. Dyson & F. O’Brien (Eds.), Supporting strategy: Frameworks, methods and models (pp. 157–190). Chichester: Wiley.
Kunc, M., & Morecroft, J. D. W. (2009). Resource-based strategies and problem structuring: Using resource maps to manage resource systems. Journal of the Operational Research Society, 60(2), 191–199.
Kunc, M., & Morecroft, J. D. W. (2010). Managerial decision-making and firm performance under a resource-based paradigm. Strategic Management Journal, 31(11), 1164–1182.
Kunc, M., & O’Brien, F. A. (2017). Exploring the development of a methodology for scenario use: Combining scenario and resource mapping approaches. Technological Forecasting and Social Change, 124, 150–159.
Lane, D. C., & Husemann, E. (2008). System dynamics mapping of acute patient flows. Journal of the Operational Research Society, 59(2), 213–224.
Lev, B., & Zarowin, P. (1999). The boundaries of financial reporting and how to extend them. Journal of Accounting Research, 37(2), 353–385.
Martinez-Moyano, I. J. (2012). Documentation for model transparency. System Dynamics Review, 28(2), 199–208.
McNally, M. A., & Maroun, W. (2018). It is not always bad news: Illustrating the potential of integrated reporting using a case study in the eco-tourism industry. Accounting, Auditing and Accountability Journal, 31(5), 1319–1348.
Meadows, D. H. (2008). Thinking in systems: A primer. White River Junction: Chelsea Green Publishing.
Melloni, G., Stacchezzini, R., & Lai, A. (2016). The tone of business model disclosure: An impression management analysis of the integrated reports. Journal of Management and Governance, 20(2), 295–320.
Miles, M. B., Huberman, A. M., & Saldana, J. (2013). Qualitative data analysis. A Methods Sourcebook: Sage Publications.
Milne, M. J., & Adler, R. (1999). Exploring the reliability of social and environmental disclosures content analysis. Accounting, Auditing and Accountability Journal, 12(2), 237–256.
Milne, M. J., & Gray, R. (2013). W(h)ither ecology? The triple bottom line, the global reporting initiative, and corporate sustainability reporting. Journal of Business Ethics, 118(1), 13–29.
Mitchell, R. K., Agle, B. R., & Wood, D. J. (1997). Toward a theory of stakeholder identification and salience: Defining the principle of who and what really counts. Academy of Management Review, 22(4), 853–886.
Moolman, J., Oberholzer, M., & Steyn, M. (2016). The effect of integrated reporting on integrated thinking between risk, opportunity and strategy and the disclosure of risks and opportunities. Southern African Business Review, 20(1), 600–627.
Morecroft, J. D. W., & Sterman, J. D. (Eds.). (2000). Modeling for learning organizations (1st ed.). Portland: Productivity Press.
Morsing, M., & Schultz, M. (2006). Corporate social responsibility communication: Stakeholder information, response and involvement strategies. Business Ethics: A European Review, 15(4), 323–338.
Penrose, E. T. (1959). The theory of the growth of the firm. Oxford: Basil Blackwell.
Perego, P., Kennedy, S., & Whiteman, G. (2016). A lot of icing but little cake? Taking integrated reporting forward. Journal of Cleaner Production, 136, 53–64.
Peteraf, M. A. (1993). The cornerstones of competitive advantage: A resource-based view. Strategic Management Journal, 14(3), 179–191.
Phillips, R. (1997). Stakeholder theory and a principle of fairness. Business Ethics Quarterly, 7(1), 51–66.
Prahalad, C. K. (2004). The blinders of dominant logic. Long Range Planning, 37(2), 171–179.
Prahalad, C. K., & Bettis, R. A. (1986). The dominant logic: A new linkage between diversity and performance. Strategic Management Journal, 7(6), 485–501.
Rahmandad, H. (2012). Impact of growth opportunities and competition on dynamics of capability development. Organization Science, 23(1), 138–154.
Rahmandad, H., & Repenning, N. (2016). Capability erosion dynamics. Strategic Management Journal, 37(4), 649–672.
Richardson, G. P., & Pugh, A. (1981). Introduction to system dynamics modeling with dynamo. Waltham: Pegasus Communications.
Rinaldi, L., Unerman, J., & de Villiers, C. (2018). Evaluating the integrated reporting journey: Insights, gaps and agendas for future research. Accounting, Auditing and Accountability Journal., 31(5), 1294–1318.
Roca, L. C., & Searcy, C. (2012). An analysis of indicators disclosed in corporate sustainability reports. Journal of Cleaner Production, 20(1), 103–118.
Ryan, B., Scapens, R. W., & Theobald, M. (2002). Research method and methodology in finance and accounting (2nd ed.). London: Thomson.
SASOL (2015). Maintaining Momentum. Annual Integrated Report 30 June 2015. http://www.sasol.com/extras/air_reports/air_2015/files/assets/basic-html/page-1.html#. Accessed 2 Dec 2016.
SASOL (2016). SASOL Limited. Integrated Report 30 June 2016. http://www.sasol.com/financial-reports/annual-integrated-report-30-June-2016. Accessed 9 June 2017.
Schaffernicht, M., & Groesser, S. N. (2011). A comprehensive method for comparing mental models of dynamic systems. European Journal of Operational Research, 210(1), 57–67.
Senge, P. M. (1990). The fifth discipline, The art and practice of the learning organization. New York: Doubleday-Currency.
Stake, R. E. (1995). The art of case study research. Thousand Oaks: Sage.
Stemler, S. (2001). An overview of content analysis. Practical Assessment, Research and Evaluation, 7(17), 137–146.
Sterman, J. D. (2000). Business dynamics. System thinking and modeling for a complex world. Boston: McGraw-Hill.
Stolowy, H., & Paugam, L. (2018). The expansion of non-financial reporting: An exploratory study. Accounting and Business Research, 48(5), 525–548.
Svendsen, A. (1998). The stakeholder strategy: Profiting from collaborative business relationships. San Francisco (CA): Berett-Koehler.
Teece, D. J., Pisano, G. & Shuen, A. (1990). Firm capabilities, resources and the concept of strategy. Working Paper, University of California at Berkeley.
Teece, D. J., Pisano, G., & Shuen, A. (1997). Dynamic capabilities and strategic management. Strategic Management Journal, 18(7), 509–533.
Tian, Y., & Chen, J. (2009). Concept of voluntary information disclosure and a review of relevant studies. International Journal of Economics and Finance, 1(2), 55–59.
Tikkanen, H., & Alajoutsijärvi, K. (2001). Competence strategies of growth firms. Helsinki: MET Publishing.
Torres, J. P., Kunc, M., & O’Brien, F. (2017). Supporting strategy using system dynamics. European Journal of Operational Research, 260(3), 1081–1094.
Vennix, A. M. J. (1990). Mental models and computer models. Ph.D. Thesis, Nijmegen, The Netherlands.
Vennix, A. M. J. (1996). Group model building. Facilitating team learning using system dynamics. Chichester: Wiley.
Warren, K. (2002). Competitive strategy dynamics. Chichester: Wiley.
Warren, K. (2008). Strategic management dynamics. Chichester: Wiley.
Wernerfelt, B. (1984). A resource-based view of the firm. Strategic Management Journal, 5(2), 171–180.
Westwood, J. (2014). Co-operative accountability. International Journal of Co-operative Management, 7(1), 73–78.
Wolstenholme, E. F. (1999). Qualitative vs quantitative modelling: The evolving balance. The Journal of Operational Research Society, 50(4), 422–428.
Wolstenholme, E. F. (2003). Towards the definition and use of a core set of archetypal structures in system dynamics. System Dynamics Review, 19(1), 7–26.
Yin, R. K. (1994). Case study research: Design and methods (2nd ed.). Newbury Park: Sage.
Author information
Authors and Affiliations
Corresponding author
Additional information
Publisher's Note
Springer Nature remains neutral with regard to jurisdictional claims in published maps and institutional affiliations.
Appendix
Appendix
1.1 Method to build resource maps from 〈IR〉
The process of developing the resource maps follows the stages described below.
The first step entailed searching within the documents for key 〈IR〉 -related concepts (e.g., capitals, business model, value creation process, business activities, outputs and outcomes) and, more in detail, identifying the two organizations’ capitals/resources, classified according to the indication of the 〈IR〉 framework (IIRC 2013a, c). In our case, we reviewed in detail the four annual Integrated Reports (analyzed separately for SASOL and ENI), focusing on all sections of the reports explaining the two organizations’ business model, value creation process and key performance indicators (KPIs); these three elements represent the fundamental concepts at the core of any integrated report. This step also entailed identifying and visually reviewing any representation, table or matrix related to the key guiding principles listed by the IIRC’s framework (IIRC 2013a): strategic focus and future orientation; connectivity of information; stakeholder relationship; materiality; conciseness; reliability and completeness; consistency and comparability. The analysis in this phase of our research was conducted following the guidelines and suggestions provided by several contributions in the field of content analysis for qualitative research and, more specifically, when applied to sustainability and ESG-related reporting (Milne and Adler 1999; Guthrie et al. 2004; Guthrie and Abeysekera 2006). In broad terms, content analysis is “a research technique for the objective, systematic and quantitative description of the manifest content of communication” (Berelson 1952); moreover, content analysis is also “a research technique for making replicable and valid inferences from texts (or other meaningful matter) to the contexts of their use” (Krippendorff 2004, p. 21). Notably, the technique can be used with either qualitative or quantitative data (Elo and Kyngäs 2008, p. 107) and provides powerful support for researchers who aim to analyze large volumes of data in a systematic fashion with relative ease (Stemler 2001, p. 137). Therefore, content analysis allows organizing “the text of writing into various groups or categories based on selected criteria” (Guthrie et al. 2004, p. 287).
The second step of the process required exploring and treating the information retrieved according to a coding technique that involved, as suggested by Kim and Andersen (2012, p. 315), “discovering concepts and their relationships from raw data and iteratively working with the concepts and relationships to allow theories to emerge from the data”. Specifically, we applied two (out of the three) typologies of coding suggested by Kim and Andersen (2012, pp. 315–316): first, open coding was used to break down data into smaller pieces-words, phrases, sentences and paragraphs and to define (sub)systems boundaries and identify key variables; secondly, axial coding was used to find relationships among the concepts, variables and codes previously identified. The objective of coding was to confirm linkages between the components of the resource maps as well as other components not related with resources such as external factors or activities.
Then, we proceeded to the next stage of our research process, using the software Vensim (Eberlein and Peterson 1992) to develop the resource map for each organization accordingly with the steps outlined below (see Table 5) (Kunc and Morecroft 2009; Kunc and O’Brien 2017).
More details are provided below.
-
1.
Lay out the resources (boxes) In order to identify resources in the integrated report, there is a set of questions: what are the capitals identified in the report? How is this capital built? Does the capital have a long-term life in the organization? Is this the basic unit of analysis or can we identify another accumulation process defining the capital? For example, “Chemical plants” (from SASOL’s map) have a long-term life, are tangible and there is no other accumulation process. Notably, for all of the different categories of capitals (see IIRC 2013a), each report specified the name of the resources either owned or managed by the organization. Therefore, this allowed us to start building the resource map, beginning with the identification of the resources at the core of the two organizations’ business models.
-
2.
Identify the processes (flows) responsible for building or eroding resources The information collected has to be codified in order to recognize and represent the processes causing the resource growth or decrease, i.e. inflows and outflows. For example, “New buildings and equipment” (from ENI’s resource map) is an investment (inflow) increasing the resource “Buildings and other equipment”, or “Investment” is an outflow reducing the organization’s “Liquidity reserves”, which is a resource.
As an example, Fig. 6 portrays the key resources and the main governance actions for SASOL, respectively visualizing the variables belonging to the “Manufactured capital” and the “Financial Capital” and their trade-offs and relationships. In terms of the flows between the resources of the manufactured capital, they can be associated with flows of energy between the different assets.
Fig. 6 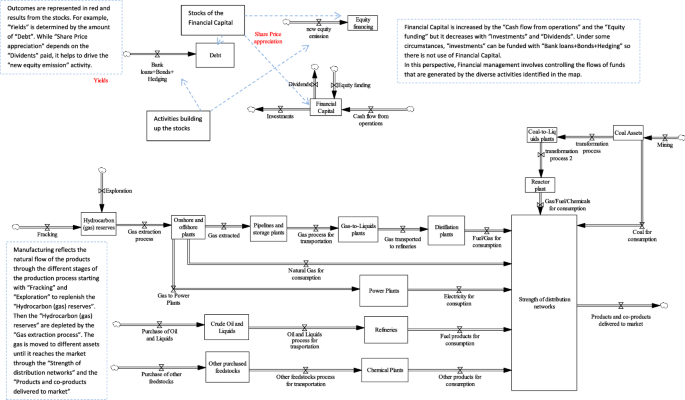
SASOL’s resource map based on the stocks of Manufactured capital and Financial capital as indicated in the organization’s 2015 and 2016 integrated reports
Particularly, the simple map represented in Fig. 6, identifies the SASOL’s key stocks of capital (resources), main actions (flows), and also value creation outputs and outcomes for its stakeholders (concepts in red color). Different colors serve to make the resource map more intelligible. The names of the resources (rectangles) are aligned to the stocks of capital as indicated by the organization’s integrated reports, and the names of the flows (arrows with little valves) indicate the processes responsible for accumulation and depletion of the resources (as identified in the previous steps). We applied the same method also to build an initial simple resource map for ENI.
It is to note that an integrated report usually provides a verbal description of the stocks and their flows, and that most of the variables and actions which are mentioned and described in such reports are expressed in monetary terms. We subsequently connected resources through a number of flows, re-framing the information provided by the reports into a different form. In this regard, dimensional consistency between resources is not strictly ensured in this work, since the resource maps are primarily aimed at providing a qualitative and quite aggregate visualization of the complex hierarchy of resources and connections existing in the business domain which is under investigation and is described by the integrated reports. Should the maps be converted into simulation models, this would definitely require further analysis and modeling effort.
-
3.
Identify capabilities Capabilities originate from either a single resource or from a set of related resources. Capabilities can build other resources, generate value by attracting customers, or generate activities influencing external stakeholders. The questions to identify capabilities are: what processes originate from resources? Where this activity comes from? The capabilities discovered in the integrated reports are presented in the resource maps using variables and not boxes.Footnote 4 For example, “Technology and patents” (resource) boost “Technological upgrade” (capability) which in turn sustains “Fracking” (flow) thus increasing “Hydrocarbon (gas) reserves” (resource) (see Fig. 3).
-
4.
Portray relationships (direct and indirect) and polarities (positive and negative)To design the resource map basing on the integrated report data, we also need to represent the causal links in the organization. They are depicted through the use of connectors (lines) which contain the direction of the linkage and the type of linkage, e.g. (from Fig. 3), “Financial capital” (resource) generates new “Investments” (outflow) that sustain “Research and development expenditures” (inflow) that eventually develop “Technology and patents” (resource). The type of linkage indicates a positive impact—an increase in A increases B, or a negative one,—an increase in A decreases B. For example, “Investments” have a negative impact on “Financial capital” because “Investments” decrease initially the amount of “Financial capital”. However, “Investments” have a positive impact on “Technology and patents” because they support “Research and Development expenditures”, which generate patents. A critical aspect to consider is the evidence to uncover these relationships: a verbal description of the linkage (explicit) or an inference from existing data or comments in the report (implicit) through the content analysis process performed at the beginning.
See examples in Table 6, which also provides a rather general description of the concept of “polarity”.
Table 6 Examples of causal relationships (from ENI’s resource map) Identifying causal relationships and defining the polarity to be assigned to the linkages were not always straightforward. To this aim, we relied on the information explicitly provided by the documents (e.g., maps describing business processes or verbal descriptions of the business activities) and on the coding technique applied in the previous step of the research design. In this regard, it is to stress again that a resource map developed in accordance with the methodology we outline in this study, is in some way the “representation” of the business domain as perceived by the organizations and their managers. This representation is conveyed through the information, data, graphs, and descriptions included in the organizations’ integrated report which eventually reflects the underlying managers’ mental models.
-
5.
Include additional external or unmanageable effects If the 〈IR〉 stresses the existence of further (external or unmanageable) events affecting the capitals, these events have to be included in the resource map, specifying the type of the effect produced (negative or positive).
-
6.
Identify feedback loops (reinforcing and balancing) The resource mapping is finished with the identification of the feedback processes between resources and flows. A feedback process consists of a circular relationship between a set of concepts (or parts of a system), e.g. A affects B, then B affects C and ultimately C affects A determining a circular relationship between A-B-C. They are recognized and labelled as either reinforcing (positive, generating growth) or balancing (negative, inducing stagnation).Footnote 5 This last step is also fundamental to explain trade-offs among resources/capitals, and correctly portraying value creation patterns, as emerged from the analysis of the integrated reports.

Subsequently, we analyzed the structure of feedback loops responsible for determining value creation patterns.
As example is provided by Fig. 5, already presented in this study, which depicts two feedback loops identified in the ENI’s resource map.
The first one, the positive (or reinforcing) feedback loop can be traced circularly as follows:
-
(1)
An increase in Brand & Reputation management (activities),
-
(2)
increases ENI brand + Reputation,
-
(3)
increases Customers and Suppliers Satisfaction,
-
(4)
increases Products delivered to market,
-
(5)
increases Availability of energy sources and green products,
-
(6)
increases stakeholders engagement + projects for local development + strategic partnership,
-
(7)
increases Strength of relationship with stakeholders,
-
(8)
decreases Environmental and social impacts (blow-out risk, fight against corruption, wellness and satisfaction of ENI’s people and local communities,…) (the polarity of this link is a “–”), which in turn
-
(9)
increases Brand & Reputation management (activities), thus closing the feedback loop.
The second one, the negative (or balancing) feedback loop, connects the following variables:
-
(1)
An increase in stakeholders engagement + projects for local development + strategic partnership,
-
(2)
increases Strength of relationship with stakeholders,
-
(3)
reduces Environmental and social impacts (blow-out risk, fight against corruption, wellness and satisfaction of ENI’s people and local communities,…),
-
(4)
which feedbacks to the starting variable, decreasing stakeholders engagement + projects for local development + strategic partnership, and closing the loop.
Notably, the analysis centered on the structure of feedback loops can be carried out extensively for any variable (resources, outcomes, and capabilities) in the map.
We also underline that the two resource maps were refined with the addition of a number of colored boxes, used to group together variables (either resources, flows or auxiliaries) pertaining to the same category as indicated by the IIRC Framework (IIRC 2013a, c). These boxes can be considered sub-systems (see Sterman 2000, pp. 99–102 about the use of subsystem diagrams) and constitute the general architecture of the 〈IR〉-based resource maps, even though at a quite aggregate level.
As an additional methodological note related to this study, we underline that data and information included in the 〈IR〉 under investigation were separately analyzed by each one of the three researchers involved in the research with the aim to reduce potential “researcher effects” (Miles et al. 2013, p. 296). The outputs of the three autonomous data processing were subsequently compared in order to derive the resource maps presented in this article. Notably, the resource maps we present in this article are 〈IR〉-based ones: for this specific reason, we used the categorization of the capitals/resources in 6 main typologies (as presented in the Sect. 2.2.) to group together “similar” resources, capabilities and flows within the maps.
As mentioned in Sect. 3 of this study, the last step of our research design entailed analyzing the resulting resource maps in terms of issues related to causal ambiguity and dynamic complexity in the business. To this aim, we employed SDM_Doc software (Martinez-Moyano 2012).
Notably, this last step allowed generating a number of descriptive statistics about the structure of the two resource maps, and identifying interesting information about the importance of each variables portrayed in the maps. Specifically, this stage allowed clarifying which are the Key Value Creation Spots for the two organizations, that is to say those resources or value outcomes affected by dense feedback processes that are controlled by the management of the organizations or their stakeholders. Tables 3 and 4 in the main body offer the evidence to identify those KVCS. As we emphasized in the article and previously literature stressed (e.g., Groesser and Schaffernicht 2012), density is a measure that supports analysts in describing a “property” of a model, and subsequently, it facilitates a deeper understanding of the conceptual structure of that specific model. More in detail, in our study density was regarded as the concept of accumulation of feedback loops over a variable that can determine its importance in terms of control or in terms of ambiguity due to the confounding effects of multiple feedback loops. It is to stress again that a high level of density associated to one specific variable, if on hand clearly points to that variable as a relevant one in the managers’ view, on the other hand it does not necessarily entail loop dominance or specific dynamics emerging from the model. This is where transforming an IR-based resource map into a quantified simulation model may help to expand the analysis, investigate the managers’ mental models and test the accuracy of the information provided by the organizations’ integrated reports more in-depth.
Rights and permissions
About this article

Cite this article
Barnabè, F., Giorgino, M.C. & Kunc, M. Visualizing and managing value creation through integrated reporting practices: a dynamic resource-based perspective. J Manag Gov 23, 537–575 (2019). https://doi.org/10.1007/s10997-019-09467-z
Published:
Issue Date:
DOI: https://doi.org/10.1007/s10997-019-09467-z