
Abstract
Semi-supervised learning is the branch of machine learning concerned with using labelled as well as unlabelled data to perform certain learning tasks. Conceptually situated between supervised and unsupervised learning, it permits harnessing the large amounts of unlabelled data available in many use cases in combination with typically smaller sets of labelled data. In recent years, research in this area has followed the general trends observed in machine learning, with much attention directed at neural network-based models and generative learning. The literature on the topic has also expanded in volume and scope, now encompassing a broad spectrum of theory, algorithms and applications. However, no recent surveys exist to collect and organize this knowledge, impeding the ability of researchers and engineers alike to utilize it. Filling this void, we present an up-to-date overview of semi-supervised learning methods, covering earlier work as well as more recent advances. We focus primarily on semi-supervised classification, where the large majority of semi-supervised learning research takes place. Our survey aims to provide researchers and practitioners new to the field as well as more advanced readers with a solid understanding of the main approaches and algorithms developed over the past two decades, with an emphasis on the most prominent and currently relevant work. Furthermore, we propose a new taxonomy of semi-supervised classification algorithms, which sheds light on the different conceptual and methodological approaches for incorporating unlabelled data into the training process. Lastly, we show how the fundamental assumptions underlying most semi-supervised learning algorithms are closely connected to each other, and how they relate to the well-known semi-supervised clustering assumption.
1 Introduction
In machine learning, a distinction has traditionally been made between two major tasks: supervised and unsupervised learning (Bishop 2006). In supervised learning, one is presented with a set of data points consisting of some input x and a corresponding output value y. The goal is, then, to construct a classifier or regressor that can estimate the output value for previously unseen inputs. In unsupervised learning, on the other hand, no specific output value is provided. Instead, one tries to infer some underlying structure from the inputs. For instance, in unsupervised clustering, the goal is to infer a mapping from the given inputs (e.g. vectors of real numbers) to groups such that similar inputs are mapped to the same group.
Semi-supervised learning is a branch of machine learning that aims to combine these two tasks (Chapelle et al. 2006b; Zhu 2008). Typically, semi-supervised learning algorithms attempt to improve performance in one of these two tasks by utilizing information generally associated with the other. For instance, when tackling a classification problem, additional data points for which the label is unknown might be used to aid in the classification process. For clustering methods, on the other hand, the learning procedure might benefit from the knowledge that certain data points belong to the same class.
As is the case for machine learning in general, a large majority of the research on semi-supervised learning is focused on classification. Semi-supervised classification methods are particularly relevant to scenarios where labelled data is scarce. In those cases, it may be difficult to construct a reliable supervised classifier. This situation occurs in application domains where labelled data is expensive or difficult obtain, like computer-aided diagnosis, drug discovery and part-of-speech tagging. If sufficient unlabelled data is available and under certain assumptions about the distribution of the data, the unlabelled data can help in the construction of a better classifier. In practice, semi-supervised learning methods have also been applied to scenarios where no significant lack of labelled data exists: if the unlabelled data points provide additional information that is relevant for prediction, they can potentially be used to achieve improved classification performance.
A plethora of learning methods exists, each with their own characteristics, advantages and disadvantages. The most recent comprehensive survey of the area was published by Zhu in 2005 and last updated in 2008 [see Zhu (2008)]. The book by Chapelle et al. (2006b) and the introductory book by Zhu and Goldberg (2009) also provide good bases for studying earlier work on semi-supervised learning. More recently, Subramanya and Talukdar (2014) provided an overview of several graph-based techniques, and Triguero et al. (2015) reviewed and analyzed pseudo-labelling techniques, a class of semi-supervised learning methods.
Since the survey by Zhu (2008) was published, some important developments have taken place in the field of semi-supervised learning. Across the field, new learning approaches have been proposed, and existing approaches have been extended, improved, and analyzed in more depth. Additionally, the rise in popularity of (deep) neural networks (Goodfellow 2017) for supervised learning has prompted new approaches to semi-supervised learning, driven by the simplicity of incorporating unsupervised loss terms into the cost functions of neural networks. Lastly, there has been increased attention for the development of robust semi-supervised learning methods that do not degrade performance, and for the evaluation of semi-supervised learning methods for practical purposes.
In this survey, we aim to provide the reader with a comprehensive overview of the current state of the research area of semi-supervised learning, covering early work and recent advances, and providing explanations of key algorithms and approaches. We present a new taxonomy for semi-supervised classification methods that captures the assumptions underlying each group of methods as well as the way in which they relate to existing supervised methods. In this, we provide a perspective on semi-supervised learning that allows for a more thorough understanding of different approaches and the connections between them. Furthermore, we shed new light on the fundamental assumptions underlying semi-supervised learning, and show how they connect to the so-called cluster assumption.
Although we aim to provide a comprehensive survey on semi-supervised learning, we cannot possibly cover every method in existence. Due to the sheer size of the literature on the topic, this would not only be beyond the scope of this article, but also distract from the key insights which we wish to provide to the reader. Instead, we focus on the most influential work and the most important developments in the area over the past twenty years.
The rest of this article is structured as follows. The basic concepts and assumptions of semi-supervised learning are covered in Sect. 2, where we also make a connection to clustering. In Sect. 3, we present our taxonomy of semi-supervised learning methods, which forms the conceptual basis for the remainder of our survey. Inductive methods are covered in Sects. 4 through 6. We first consider wrapper methods (Sect. 4), followed by unsupervised preprocessing (Sect. 5), and finally, we cover intrinsically semi-supervised methods (Sect. 6). Sect. 7 covers transductive methods, which form the second major branch of our taxonomy. Semi-supervised regression and clustering are discussed in Sect. 8. Finally, in Sect. 9, we provide some prospects for the future of semi-supervised learning.
2 Background
In traditional supervised learning problems, we are presented with an ordered collection of l labelled data points \(D_L = ((x_i, y_i))_{i=1}^l\). Each data point \((x_i, y_i)\) consists of an object \(x_i \in \mathcal {X}\) from a given input space \(\mathcal {X}\), and has an associated label \(y_i\), where \(y_i\) is real-valued in regression problems and categorical in classification problems. Based on a collection of these data points, usually called the training data, supervised learning methods attempt to infer a function that can successfully determine the label \(y^*\) of some previously unseen input \(x^*\).
In many real-world classification problems, however, we also have access to a collection of u data points, \(D_U = (x_i)_{i=l+1}^{l+u}\), whose labels are unknown. For instance, the data points for which we want to make predictions, usually called the test data, are unlabelled by definition. Semi-supervised classification methods attempt to utilize unlabelled data points to construct a learner whose performance exceeds the performance of learners obtained when using only the labelled data. In the remainder of this survey, we denote with \(X_L\) and \(X_U\) the collection of input objects for the labelled and unlabelled samples, respectively.Footnote 1
There are many cases where unlabelled data can help in constructing a classifier. Consider, for example, the problem of document classification, where we wish to assign topics to a collection of text documents (such as news articles). Assuming our documents are represented by the set of words that appear in it, one could train a simple supervised classifier that, for example, learns to recognize that documents containing the word “neutron” are usually about physics. This classifier might work well on documents containing terms that it has seen in the training data, but will inherently fail when a document does not contain predictive words that also occurred in the training set. For example, if we encounter a physics document about particle accelerators that does not contain the word “neutron”, the classifier is unable to recognize it as a document concerning physics. This is where semi-supervised learning comes in. If we consider the unlabelled data, there might be documents that connect the word “neutron” to the phrase “particle accelerator”. For instance, the word “neutron” would often occur in a document that also contains the word “quark”. Furthermore, the word “quark” would regularly co-occur with the phrase “particle accelerator”, which guides the classifiers towards classifying these documents as revolving around physics as well, despite having never seen the phrase “particle accelerator” in the labelled data.
Figure 1 provides some further intuition towards the use of unlabelled data for classification. We consider an artificial classification problem with two classes. For both classes, 100 samples are drawn from a 2-dimensional Gaussian distribution with identical covariance matrices. The labelled data set is then constructed by taking one sample from each class. Any supervised learning algorithm will most likely obtain as the decision boundary the solid line, which is perpendicular to the line segment connecting the two labelled data points and intersects it in the middle. However, this is quite far from the optimal decision boundary. As is clear from this figure, the clusters we can infer from the unlabelled data can help us considerably in placing the decision boundary: assuming that the data stems from two Gaussian distributions, a simple semi-supervised learning algorithm can infer a close-to-optimal decision boundary.

A basic example of binary classification in the presence of unlabelled data. The unlabelled data points are coloured according to their true label. The coloured, unfilled circles depict the contour curves of the input data distribution corresponding to standard deviations of 1, 2 and 3 (Color figure online)
2.1 Assumptions of semi-supervised learning
A necessary condition of semi-supervised learning is that the underlying marginal data distribution p(x) over the input space contains information about the posterior distribution p(y|x). If this is the case, one might be able to use unlabelled data to gain information about p(x), and thereby about p(y|x). If, on the other hand, this condition is not met, and p(x) contains no information about p(y|x), it is inherently impossible to improve the accuracy of predictions based on the additional unlabelled data (Zhu 2008).
Fortunately, the previously mentioned condition appears to be satisfied in most learning problems encountered in the real world, as is suggested by the successful application of semi-supervised learning methods in practice. However, the way in which p(x) and p(y|x) interact is not always the same. This has given rise to the semi-supervised learning assumptions, which formalize the types of expected interaction (Chapelle et al. 2006b). The most widely recognized assumptions are the smoothness assumption (if two samples x and \(x'\) are close in the input space, their labels y and \(y'\) should be the same), the low-density assumption (the decision boundary should not pass through high-density areas in the input space), and the manifold assumption (data points on the same low-dimensional manifold should have the same label). These assumptions are the foundation of most, if not all, semi-supervised learning algorithms, which generally depend on one or more of them being satisfied, either explicitly or implicitly. Throughout this survey, we will elaborate on the underlying assumptions utilized by each specific learning algorithm. The assumptions are explained in more detail below; a visual representation is provided in Fig. 2.

Illustrations of the semi-supervised learning assumptions. In each picture, a reasonable supervised decision boundary is depicted, as well as the optimal decision boundary, which could be closely approximated by a semi-supervised learning algorithm relying on the respective assumption
2.1.1 Smoothness assumption
The smoothness assumption states that, for two input points \(x, x' \in \mathcal X\) that are close by in the input space, the corresponding labels \(y, y'\) should be the same. This assumption is also commonly used in supervised learning, but has an extended benefit in the semi-supervised context: the smoothness assumption can be applied transitively to unlabelled data. For example, assume that a labelled data point \(x_1 \in X_L\) and two unlabelled data points \(x_2, x_3 \in X_U\) exist, such that \(x_1\) is close to \(x_2\) and \(x_2\) is close to \(x_3\), but \(x_1\) is not close to \(x_3\). Then, because of the smoothness assumption, we can still expect \(x_3\) to have the same label as \(x_1\), since proximity—and thereby the label—is transitively propagated through \(x_2\).
2.1.2 Low-density assumption
The low-density assumption implies that the decision boundary of a classifier should preferably pass through low-density regions in the input space. In other words, the decision boundary should not pass through high-density regions. The assumption is defined over p(x), the true distribution of the input data. When considering a limited set of samples from this distribution, it essentially means that the decision boundary should lie in an area where few data points are observed. In that light, the low-density assumption is closely related to the smoothness assumption; in fact, it can be considered the counterpart of the smoothness assumption for the underlying data distribution.
Suppose that a low-density area exists, i.e. an area \(R \subset \mathcal {X}\) where p(x) is low. Then very few observations are expected to be contained in R, and it is thus unlikely that any pair of similar data points in R is observed. If we place the decision boundary in this low-density area, the smoothness assumption is not violated, since it only concerns pairs of similar data points. For high-density areas, on the other hand, many data points can be expected. Thus, placing the decision boundary in a high-density region violates the smoothness assumption, since the predicted labels would then be dissimilar for similar data points.
The converse is also true: if the smoothness assumption holds, then any two data points that lie close together have the same label. Therefore, in any densely populated area of the input space, all data points are expected to have the same label. Consequently, a decision boundary can be constructed that passes only through low-density areas in the input space, thus satisfying the low-density assumption as well. Due to their close practical relation, we depict the low-density assumption and the smoothness assumption in a single illustration in Fig. 2.
2.1.3 Manifold assumption
In machine learning problems where the data can be represented in Euclidean space, the observed data points in the high-dimensional input space \(\mathbb {R}^d\) are usually concentrated along lower-dimensional substructures. These substructures are known as manifolds: topological spaces that are locally Euclidean. For instance, when we consider a 3-dimensional input space where all points lie on the surface of a sphere, the data can be said to lie on a 2-dimensional manifold. The manifold assumption in semi-supervised learning states that (a) the input space is composed of multiple lower-dimensional manifolds on which all data points lie and (b) data points lying on the same manifold have the same label. Consequently, if we are able to determine which manifolds exist and which data points lie on which manifold, the class assignments of unlabelled data points can be inferred from the labelled data points on the same manifold.
2.2 Connection to clustering
In semi-supervised learning research, an additional assumption that is often included is the cluster assumption, which states that data points belonging to the same cluster belong to the same class (Chapelle et al. 2006b). We argue, however, that the previously mentioned assumptions and the cluster assumption are not independent of each other but, rather, that the cluster assumption is a generalization of the other assumptions.
Consider an input space \(\mathcal {X}\) with some objects \(X \subset \mathcal {X}\), drawn from the distribution p(x). A cluster, then, is a set of data points \(C \subseteq X\) that are more similar to each other than to other data points in X, according to some concept of similarity (Anderberg 1973). Determining clusters corresponds to finding some function \(f:X \rightarrow \mathcal {Y}\) that maps each input in \(x \in X\) to a cluster with label \(y = f(x)\), where each cluster label \(y \in \mathcal {Y}\) uniquely identifies one cluster. Since we do not have direct access to p(x) to determine a suitable clustering, we need to rely on some concept of similarity between data points in \(\mathcal {X}\), according to which we can assign clusters to similar data points.
The concept of similarity we choose, often implicitly, dictates what constitutes a cluster. Although the efficacy of any particular clustering method for finding these clusters depends on many other factors, the concept of similarity uniquely defines the interaction between p(x) and p(y|x). Therefore, whether two points belong to the same cluster can be derived from their similarity to each other and to other points. From our perspective, the smoothness, low-density, and manifold assumptions boil down to different definitions of the similarity between points: the smoothness assumption states that points that are close to each other in input space are similar; the low-density assumption states that points in the same high-density area are similar; and the manifold assumption states that points that lie on the same low-dimensional manifold are similar. Consequently, the semi-supervised learning assumptions can be seen as more specific instances of the cluster assumption: that similar points tend to belong to the same group.
One could even argue that the cluster assumption corresponds to the necessary condition for semi-supervised learning: that p(x) carries information on p(y|x). In fact, assuming the output space \(\mathcal {Y}\) contains the labels of all possible clusters, the necessary condition for semi-supervised learning to succeed can be seen to be the necessary condition for clustering to succeed. In other words: if the data points (both unlabelled and labelled) cannot be meaningfully clustered, it is impossible for a semi-supervised learning method to improve on a supervised learning method.
2.3 When does semi-supervised learning work?
The primary goal of semi-supervised learning is to harness unlabelled data for the construction of better learning procedures. As it turns out, this is not always easy or even possible. As mentioned earlier, unlabelled data is only useful if it carries information useful for label prediction that is not contained in the labelled data alone or cannot be easily extracted from it. To apply any semi-supervised learning method in practice, the algorithm then needs to be able to extract this information. For practitioners and researchers alike, this begs the question: when is this the case?
Unfortunately, it has proven difficult to find a practical answer to this question. Not only is it difficult to precisely define the conditions under which any particular semi-supervised learning algorithm may work, it is also rarely straightforward to evaluate to what extent these conditions are satisfied. However, one can reason about the applicability of different learning methods on various types of problems. Graph-based methods, for example, typically rely on a local similarity measure to construct a graph over all data points. To apply such methods successfully, it is important that a meaningful local similarity measure can be devised. In high-dimensional data, such as images, where Euclidean feature distance is rarely a good indicator of the similarity between data points, this is often difficult. As can be seen in the literature, most semi-supervised learning approaches for images rely on a weak variant of the smoothness assumption that requires predictions to be invariant to minor perturbations in the input (Rasmus et al. 2015; Laine and Aila 2017; Tarvainen and Valpola 2017). Semi-supervised extensions of supervised learning algorithms, on the other hand, generally rely on the same assumption as their supervised counterparts. For instance, both supervised and semi-supervised support vector machines rely on the low-density assumption, which states that the decision boundary should lie in a low-density region of the decision space. If a supervised classifier performs well in such cases, it is only natural to use the semi-supervised extension to the algorithm.
As is the case for supervised learning algorithms, no method has yet been discovered to determine a priori what learning method is best-suited for any particular problem. What is more, it is impossible to guarantee that the introduction of unlabelled data will not degrade performance. Such performance degradation has been observed in practice, and its prevalence is likely under-reported due to publication bias (Zhu 2008). The problem of potential performance degradation has been identified in multiple studies (Zhu 2008; Chapelle et al. 2006b; Singh et al. 2009; Li and Zhou 2015; Oliver et al. 2018), but remains difficult to address. It is particularly relevant in scenarios where good performance can be achieved with purely supervised classifiers. In those cases, the potential performance degradation is much larger than the potential performance gain.
The main takeaway from these observations is that semi-supervised learning should not be seen as a guaranteed way of achieving improved prediction performance by the mere introduction of unlabelled data. Rather, it should be treated as another direction in the process of finding and configuring a learning algorithm for the task at hand. Semi-supervised learning procedures should be part of the suite of algorithms considered for use in a particular application scenario, and a combination of theoretical analysis (where possible) and empirical evaluation should be used to choose an approach that is well suited to the given situation.
2.4 Empirical evaluation of semi-supervised learning methods
When evaluating and comparing machine learning algorithms, a multitude of decisions influence the relative performance of different algorithms. In supervised learning, these include the selection of data sets, the partitioning of those data sets into training, validation and test sets, and the extent to which hyperparameters are tuned. In semi-supervised learning, additional factors come into play. First, in many benchmarking scenarios, a decision has to be made which data points should be labelled and which should remain unlabelled. Second, one can choose to evaluate the performance of the learner on the unlabelled data used for training (which is by definition the case in transductive learning), or on a completely disjoint test set. Additionally, it is important to establish high-quality supervised baselines to allow for proper assessment of the added value of the unlabelled data. In practice, excessively limiting the scope of the evaluation can lead to unrealistic perspectives on the performance of the learning algorithms. Recently, Oliver et al. (2018) established a set of guidelines for the realistic evaluation of semi-supervised learning algorithms; several of their recommendations are included here.
In practical use cases, the partitioning of labelled and unlabelled data is typically fixed. In research, data sets used for evaluating semi-supervised learning algorithms are usually obtained by simply removing the labels of a large amount of data points from an existing supervised learning data set. In earlier research, the data sets from the UCI Machine Learning Repository were often used (Dua and Graff 2019). In more recent research on semi-supervised image classification, the CIFAR-10/100 (Krizhevsky 2009) and SVHN (Netzer et al. 2011) data sets have been popular choices. Additionally, two-dimensional toy datasets are sometimes used to demonstrate the viability of a new approach. Typically, these toy data sets consist of an input distribution where data points from each class are concentrated along a one-dimensional manifold. For instance, the popular half-moon data set consists of data points drawn from two interleaved half circles, each associated with a different class.
As has been observed in practice, the choice of data sets and their partitioning can have significant impact on the relative performance of different learning algorithms (see, e.g. Chapelle et al. 2006b; Triguero et al. 2015). Some algorithms may work well when the amount of labelled data is limited and perform poorly when more labelled data is available; others may excel on particular types of data sets but not on others. To provide a realistic evaluation of semi-supervised learning algorithms, researchers should thus evaluate their algorithms on a diverse suite of data sets with different quantities of labelled and unlabelled data.
In addition to the choice of data sets and their partitioning, it is important that a strong baseline is chosen when evaluating the performance of a semi-supervised learning method. After all, it is not particularly relevant to practitioners whether the introduction of unlabelled data improves the performance of any particular learning algorithm. Rather, the central question is: does the introduction of unlabelled data yield a learner that is better than any other learner—be it supervised or semi-supervised. As pointed out by Oliver et al. (2018), this calls for the inclusion of state-of-the-art, properly tuned supervised baselines when evaluating the performance of semi-supervised learning algorithms.
Several studies have independently evaluated the performance of different semi-supervised learning methods on various data sets. Chapelle et al. (2006b) empirically compared eleven diverse semi-supervised learning algorithms, using supervised support vector machines and k-nearest neighbours as their baseline. They included semi-supervised support vector machines, label propagation and manifold regularization techniques, applying hyperparameter optimization for each algorithm. Comparing the performance of the algorithms on eight different data sets, the authors found that no algorithm uniformly outperformed the others. Substantial performance improvements over the baselines were observed on some data sets, while performance was found to be degraded on others. Relative performance also varied with the amount of unlabelled data.
Oliver et al. (2018) compared several semi-supervised neural networks, including the mean teacher model, virtual adversarial training and a wrapper method called pseudo-label, on two image classification problems. They reported substantial performance improvements for most of the algorithms, and observed that the error rates typically declined as more unlabelled data points were added (without removing any labelled data points). Performance degradations were observed only when there was a mismatch between the classes present in the labelled data and the classes present in the unlabelled data. These results are promising indeed: they indicate that, in image classification tasks, unlabelled data can be employed by neural networks to consistently improve performance. It is an interesting avenue for future research to investigate whether these consistent performance improvements can also be obtained for other types of data. Furthermore, it is an open question whether the assumptions underlying these semi-supervised neural networks could be exploited to consistently improve the performance of other learning methods.
3 Taxonomy of semi-supervised learning methods
Over the past two decades, a broad variety of semi-supervised classification algorithms has been proposed. These methods differ in the semi-supervised learning assumptions they are based on, in how they make use of unlabelled data, and in the way they relate to supervised algorithms. Existing categorizations of semi-supervised learning methods generally use a subset of these properties and are typically relatively flat, thereby failing to capture similarities between different groups of methods. Furthermore, the categorizations are often fine-tuned towards existing work, making them less suited for the inclusion of new approaches.
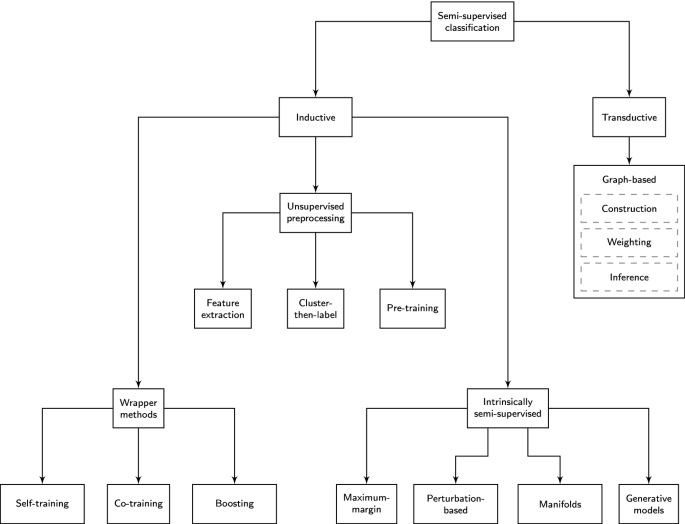
Visualization of the semi-supervised classification taxonomy. Each leaf in the taxonomy corresponds to a specific type of approach to incorporating unlabelled data into classification methods. In the leaf corresponding to transductive, graph-based methods, the dashed boxes represent distinct phases of the graph-based classification process, each of which has a multitude of variations
In this survey, we propose a new way to represent the spectrum of semi-supervised classification algorithms. We attempt to group them in a clear, future-proof way, allowing researchers and practitioners alike to gain insight into the way semi-supervised learning methods relate to each other, to existing supervised learning methods, and to the semi-supervised learning assumptions. The taxonomy is visualized in Fig. 3. At the highest level, it distinguishes between inductive and transductive methods, which give rise to distinct optimization procedures: the former attempt to find a classification model, whereas the latter are solely concerned with obtaining label predictions for the given unlabelled data points. At the second level, it considers the way the semi-supervised learning methods incorporate unlabelled data. This distinction gives rise to three distinct classes of inductive methods, each of which is related to supervised classifiers in a different way.
The first distinction we make in our taxonomy, between inductive and transductive methods, is common in the literature on semi-supervised learning (see, e.g. Chapelle et al. 2006b; Zhu 2008; Zhu and Goldberg 2009). The former, like supervised learning methods, yield a classification model that can be used to predict the label of previously unseen data points. The latter do not yield such a model, but instead directly provide predictions. In other words, given a data set consisting of labelled and unlabelled data, \(X_L, X_U \subseteq \mathcal {X}\), with labels \(\mathbf {y}_L \in \mathcal {Y}^l\) for the l labelled data points, inductive methods yield a model \(f: \mathcal {X} \mapsto \mathcal {Y}\), whereas transductive methods produce predicted labels \(\hat{\mathbf {y}}_U\) for the unlabelled data points in \(X_U\). Accordingly, inductive methods involve optimization over prediction models, whereas transductive methods optimize directly over the predictions \(\hat{\mathbf {y}}_U\).
Inductive methods, which generally extend supervised algorithms to include unlabelled data, are further differentiated in our taxonomy based on the way they incorporate unlabelled data: either in a preprocessing step, directly inside the objective function, or via a pseudo-labelling step. The transductive methods are in all cases graph-based; we group these based on the choices made in different stages of the learning process. In the remainder of this section, we will elaborate on the grouping of semi-supervised learning methods represented in the taxonomy, which forms the basis for our discussion of semi-supervised learning methods in the remainder of this survey.
3.1 Inductive methods
Inductive methods aim to construct a classifier that can generate predictions for any object in the input space. Unlabelled data may be used when training this classifier, but the predictions for multiple new, previously unseen examples are independent of each other once training has been completed. This corresponds to the objective in supervised learning methods: a model is built in the training phase and can then be used for predicting the labels of new data points.
3.1.1 Wrapper methods
A simple approach to extending existing, supervised algorithms to the semi-supervised setting is to first train classifiers on labelled data, and to then use the predictions of the resulting classifiers to generate additional labelled data. The classifiers can then be re-trained on this pseudo-labelled data in addition to the existing labelled data. Such methods are known as wrapper methods: the unlabelled data is pseudo-labelled by a wrapper procedure, and a purely supervised learning algorithm, unaware of the distinction between originally labelled and pseudo-labelled data, constructs the final inductive classifier. This reveals a key property of wrapper methods: most of them can be applied to any given supervised base learner, allowing unlabelled data to be introduced in a straightforward manner. Wrapper methods form the first part of the inductive side of the taxonomy, and are covered in Sect. 4.
3.1.2 Unsupervised preprocessing
Secondly, we consider unsupervised preprocessing methods, which either extract useful features from the unlabelled data, pre-cluster the data, or determine the initial parameters of a supervised learning procedure in an unsupervised manner. Like wrapper methods, they can be used with any supervised classifier. However, unlike wrapper methods, the supervised classifier is only provided with originally labelled data points. These methods are covered in Sect. 5.
3.1.3 Intrinsically semi-supervised methods
The last class of inductive methods we consider directly incorporate unlabelled data into the objective function or optimization procedure of the learning method. Many of these methods are direct extensions of supervised learning methods to the semi-supervised setting: they extend the objective function of the supervised classifier to include unlabelled data. Semi-supervised support vector machines (S3VMs), for example, extend supervised SVMs by maximizing the margin not only on labelled, but also on unlabelled data. There are intrinsically semi-supervised extensions of many prominent supervised learning approaches, including SVMs, Gaussian processes and neural networks, and we describe these in Sect. 6. We further group the methods inside this category based on the semi-supervised learning assumptions on which they rely.
3.2 Transductive methods
Unlike inductive methods, transductive methods do not construct a classifier for the entire input space. Instead, their predictive power is limited to exactly those objects that it encounters during the training phase. Therefore, transductive methods have no distinct training and testing phases. Since supervised learning methods are by definition not supplied with unlabelled data until the testing phase, no clear analogies of transductive algorithms exist in supervised learning.
Since no model of the input space exists in transductive learners, information has to be propagated via direct connections between data points. This observation naturally gives rise to a graph-based approach to transductive methods: if a graph can be defined in which similar data points are connected, information can then be propagated along the edges of this graph. In practice, all transductive methods we discuss are either explicitly graph-based or can implicitly be understood as such. We note that inductive graph-based methods also exist; we cover them in Sect. 6.3. Inductive as well as transductive graph-based methods are typically premised on the manifold assumption: the graphs, constructed based on the local similarity between data points, provide a lower-dimensional representation of the potentially high-dimensional input data.
Transductive graph-based methods generally consist of three steps: graph construction, graph weighting and inference. In the first step, the set of objects, X, is used to construct a graph where each node represents a data point and pairwise similar data points are connected by an edge. In the second step, these edges are weighted to represent the extent of the pairwise similarity between the respective data points. In the third step, the graph is used to assign labels to the unlabelled data points. Different methods for carrying out these three steps are discussed in detail in Sect. 7.
4 Wrapper methods
Wrapper methods are among the oldest and most widely known algorithms for semi-supervised learning (Zhu 2008). They utilize one or more supervised base learners and iteratively train these with the original labelled data as well as previously unlabelled data that is augmented with predictions from earlier iterations of the learners. The latter is commonly referred to as pseudo-labelled data. The procedure usually consists of two alternating steps of training and pseudo-labelling. In the training step, one or more supervised classifiers are trained on the labelled data and, possibly, pseudo-labelled data from previous iterations. In the pseudo-labelling step, the resulting classifiers are used to infer labels for the previously unlabelled objects; the data points for which the learners were most confident of their predictions are pseudo-labelled for use in the next iteration.
A significant advantage of wrapper methods is that they can be used with virtually any supervised base learner. The supervised base learner can be entirely unaware of the wrapper method, which simply passes pseudo-labelled samples to the base learner as if they were regular labelled samples. Although some wrapper methods require the base learner to provide probabilistic predictions, many wrapper methods relying on multiple base learners do not. For any particular wrapper method, the semi-supervised learning assumptions underlying it are dependent on the base learners that are used. In that sense, a wrapper method cannot be considered a learning method on its own: it only becomes a complete learning method when it is combined with a particular set of base learners.
A comprehensive survey of wrapper methods was published recently by Triguero et al. (2015). In addition to providing an overview of such methods, they also proposed a categorization and taxonomy of wrapper methods, which is based on (1) how many classifiers are used, (2) whether different types of classifiers are used, and (3) whether they use single-view or multi-view data (i.e. whether the data is split into multiple feature subsets). This taxonomy provides valuable insight into the space of wrapper methods.
We present a less complex taxonomy, focused on the three relatively independent types of wrapper methods that have been studied in the literature. Firstly, we consider self-training, which uses one supervised classifier that is iteratively re-trained on its own most confident predictions. Secondly, we consider co-training, an extension of self-training to multiple classifiers that are iteratively re-trained on each other’s most confident predictions. The classifiers are supposed to be sufficiently diverse, which is usually achieved by operating on different subsets of the given objects or features. Lastly, we consider pseudo-labelled boosting methods. Like traditional boosting methods, they build a classifier ensemble by constructing individual classifiers sequentially, where each individual classifier is trained on both labelled data and the most confident predictions of the previous classifiers on unlabelled data.
4.1 Self-training
Self-training methods (sometimes also called “self-learning” methods) are the most basic of pseudo-labelling approaches (Triguero et al. 2015). They consist of a single supervised classifier that is iteratively trained on both labelled data and data that has been pseudo-labelled in previous iterations of the algorithm.
At the beginning of the self-training procedure, a supervised classifier is trained on only the labelled data. The resulting classifier is used to obtain predictions for the unlabelled data points. Then, the most confident of these predictions are added to the labelled data set, and the supervised classifier is re-trained on both the original labelled data and the newly obtained pseudo-labelled data. This procedure is typically iterated until no more unlabelled data remain.
Self-training was first proposed by Yarowsky (1995) as an approach to word sense disambiguation in text documents, predicting the meaning of words based on their context. Since then, several applications and variations of self-training have been put forward. For instance, Rosenberg et al. (2005) applied self-training to object detection problems, and showed improved performance over a state-of-the-art (at that time) object detection model. Dópido et al. (2013) developed a self-training approach for hyperspectral image classification. They used domain knowledge to select a set of candidate unlabelled samples, and pseudo-labelled the most informative of these samples with the predictions made by the trained classifier.
The self-training paradigm admits a multitude of design decisions, including the selection of data to pseudo-label, the re-use of pseudo-labelled data in later iterations of the algorithm, and stopping criteria (see, e.g. Rosenberg et al. 2005; Triguero et al. 2015). The selection procedure for data to be pseudo-labelled is of particular importance, since it determines which data end up in the training set for the classifier. In typical self-training settings, where this selection is made based on prediction confidence, the quality of the confidence estimates significantly influences algorithm performance. In particular, the ranking of prediction probabilities for the unlabelled samples should reflect the true confidence ranking.
If well-calibrated probabilistic predictions are available, the respective probabilities can be used directly. In this case, the self-training approach is iterative and not incremental, as label probabilities for unlabelled data points are re-estimated in each step. In that case, the approach becomes similar to expectation-maximization (EM; Dempster et al. 1977). It has been particularly well studied in the context of naïve Bayes classifiers, which are inherently probabilistic (Nigam and Ghani 2000; Nigam et al. 2000, 2006). Wu et al. (2012b) recently applied semi-supervised EM with a naïve Bayes classifier to the problem of detecting fake product reviews on e-commerce websites.
Algorithms that do not natively support robust probabilistic predictions may require adaptations to benefit from self-training. Decision trees are a prime example of this: without any modifications or pruning, prediction probability estimates, which are generally calculated from the fraction of samples in a leaf with a certain label, are generally of low quality. This can be mainly attributed to the fact that most decision tree learning algorithms explicitly attempt to minimize the impurity in tree nodes, thereby encouraging small leaves and highly biased probability estimates (Provost and Domingos 2003). Tanha et al. (2017) attempted to overcome this problem in two distinct ways. Firstly, they applied several existing methods, such as grafting and Laplace correction, to directly improve prediction probability estimates. Secondly, they used a local distance-based measure to determine the confidence ranking between instances: the prediction confidence of an unlabelled data point is based on the absolute difference in the Mahalanobis distances between that point and the labelled data from each class. They showed improvements in performance of both decision trees and random forests (ensembles of decision trees) using this method (Tanha et al. 2017).
Leistner et al. (2009) also utilized self-training to improve random forests. Instead of labelling the unlabelled data \(\mathbf {x} \in X_U\) with the label predicted to be most likely, they pseudo-label each unlabelled data point independently for each tree according to the estimated posterior distribution \(p(y|\mathbf {x})\). Furthermore, they proposed a stopping criterion based on the out-of-bag-error: when the out-of-bag-error (which is an unbiased estimate of the generalization error) increases, training is stopped.
The base learners in self-training are by definition agnostic to the presence of the wrapper method. Consequently, they have to be completely re-trained in each self-training iteration. However, when a classifier can be trained incrementally (i.e. optimizing the objective function over individual data points or subsets of the given data), an iterative pseudo-labelling approach similar to self-training can be applied. Instead of re-training the entire algorithm in each iteration, data points can be pseudo-labelled throughout the training process. This approach was applied to neural networks by Lee (2013), who proposed the pseudo-label approach. Since the pseudo-labels predicted in the earlier training stages are generally less reliable, the weight of the pseudo-labelled data is increased over time. The pseudo-label approach exhibits clear similarities to self-training, but differs in the sense that the classifier is not re-trained after each pseudo-labelling step: instead, it is fine-tuned with new pseudo-labelled data, and therefore technically deviates from the wrapper method paradigm.
Limited studies regarding the theoretical properties of self-training algorithms exist. Haffari and Sarkar (2007) performed a theoretical analysis of several variants of self-training and showed a connection with graph-based methods. Culp and Michailidis (2008) analyzed the convergence properties of a variant of self-training with several base learners, and considered the connection to graph-based methods as well.
4.2 Co-training
Co-training is an extension of self-training to multiple supervised classifiers. In co-training, two or more supervised classifiers are iteratively trained on the labelled data, adding their most confident predictions to the labelled data set of the other supervised classifiers in each iteration. For co-training to succeed, it is important that the base learners are not too strongly correlated in their predictions. If they are, their potential to provide each other with useful information is limited. In the literature, this condition is usually referred to as the diversity criterion (Wang and Zhou 2010). Zhou and Li (2010) provided a survey of semi-supervised learning methods relying on multiple base learners. They jointly refer to these methods as disagreement-based methods, referring to the observation that co-training approaches exploit disagreements between multiple learners: they exchange information through unlabelled data, for which different learners predict different labels.
To promote classifier diversity, earlier co-training approaches mainly relied on the existence of multiple different views of the data, which generally correspond to distinct subsets of the feature set. For instance, when handling video data, the data can be naturally decomposed into visual and audio data. Such co-training methods belong to the broader class of multi-view learning approaches, which includes a broad range of supervised learning algorithms as well. A comprehensive survey of multi-view learning was produced by Xu et al. (2013). We cover multi-view co-training methods in Sect. 4.2.1. In many real-world problem scenarios, no distinct views of the data are known a priori. Single-view co-training methods address this problem either by automatically splitting the data into different views, or by promoting diversity in the learning algorithms themselves; we cover these methods in Sect. 4.2.2. We also briefly discuss co-regularization methods, in which multiple classifiers are combined into a single objective function, in Sect. 4.2.3.
4.2.1 Multi-view co-training
The basic form of co-training was proposed by Blum and Mitchell (1998). In their seminal paper, they proposed to construct two classifiers that are trained on two distinct views, i.e. subsets of features, of the given data. After each training step, the most confident predictions for each view are added to the set of labelled data for the other view. Blum and Mitchell applied the co-training algorithm to the classification for university web pages, using the web page text and the anchor text in links to the web page from external sources as two distinct views. This algorithm and variants thereof have been successfully applied in several fields, most notably natural language processing (Kiritchenko and Matwin 2001; Mihalcea 2004; Wan 2009).
The original co-training algorithm by Blum and Mitchell (1998) relies on two main assumptions to succeed: (1) each individual subset of features should be sufficient to obtain good predictions on the given data set, and (2) the subsets of features should be conditionally independent given the class label. The first assumption can be understood trivially: if one of the two feature subsets is insufficient to form good predictions, a classifier using that set can never contribute positively to the overall performance of the combined approach. The second assumption is related to the diversity criterion: if the feature subsets are conditionally independent given the class label, the predictions of the individual classifiers are unlikely to be strongly correlated. Formally, for any data point \(\mathbf {x}_i = \mathbf {x}^{(1)}_i \times \mathbf {x}^{(2)}_i\), decomposed into \(\mathbf {x}^{(1)}_i\) and \(\mathbf {x}^{(2)}_i\) for the first and second feature subset, respectively, the conditional independence assumption amounts to \(p(\mathbf {x}^{(1)}_i | \mathbf {x}^{(2)}_i, y_i) = p(\mathbf {x}^{(1)}_i | y_i)\). Dasgupta et al. (2002) showed that, under the previously mentioned assumptions, generalization error can be decreased by promoting agreement among the individual learners.
In practice, the second assumption is generally not satisfied: even if a natural split of features exists, such as in the experimental setup used by Blum and Mitchell (1998), it is unlikely that information contained in one view provides no information about the other view when conditioned on the class label (Du et al. 2011). Considering the university web page classification example, the anchor text of a link to a web page can indeed be expected to contain clues towards the content of the web page, even if it is known that the web page is classified as a faculty member’s home page. For example, if the link’s anchor text is “Dean of the Engineering Faculty”, one is more likely to find information about the dean of the engineering faculty than about any other person in the text of that page. Thus, several alternatives to this assumption have been considered.
Abney (2002) showed that a weak independence assumption is sufficient for successful co-training. Balcan et al. (2005) further relaxed the conditional independence assumption, showing that a much weaker assumption, which they dub the expansion assumption, is sufficient and to some extent necessary. The expansion assumption states that the two views are not highly correlated, and that individual classifiers never confidently make incorrect predictions.
Du et al. (2011) studied empirical methods to determine to what degree the sufficiency and independence assumptions hold. They proposed several methods for automatically splitting the feature set into two views, and showed that the resulting empirical independence and sufficiency is positively correlated with the performance of the co-trained algorithm, indicating that feature splits optimizing sufficiency and independence lead to good classifiers.
4.2.2 Single-view co-training
As shown by Du et al. (2011), co-training can be successful even when no natural split in a given feature set is known a priori. This observation is echoed throughout the literature on co-training, and many different approaches to applying co-training in this so-called single-view setting exist.
Chen et al. (2011) attempted to alleviate the need for pre-defined disjoint feature sets by automatically splitting the feature set in each co-training iteration. They formulated a single optimization problem closely related to co-training, incorporating both the requirement that the feature sets should be disjoint and the expansion property of Balcan et al. (2005). They showed promising results for this approach on a partially synthetic data set, where multiple views of each data point are automatically generated. Wang and Zhou (2010) reasoned about sufficient and necessary conditions for co-training to succeed, approaching co-training from a graph-based perspective, where label propagation is alternately applied to each learner. A downside of this approach is that, although inspired by co-training, it cannot be applied to an arbitrary supervised learning algorithm without modification: the operations resembling co-training are embedded in the objective function, which is optimized directly.
Several techniques have been proposed for splitting single-view data sets into multiple views. For instance, Wang et al. (2008b) suggested to generate k random projections of the data, and use these as the views for k different classifiers. Zhang and Zheng (2009) proposed to project the data onto a lower-dimensional subspace using principal component analysis and to construct the pseudo-views by greedily selecting the transformed features with maximal variance. Yaslan and Cataltepe (2010) do not transform the data to a different basis, but select the features for each view iteratively, with preference given to features with high mutual information with respect to the given labels.
Further approaches to apply algorithms resembling co-training to data sets where no explicit views are available focus on other ways of introducing diversity among the classifiers. For example, one can use different hyperparameters for the supervised algorithms (Wang and Zhou 2007; Zhou and Li 2005a), or use different algorithms altogether (Goldman and Zhou 2000; Xu et al. 2012; Zhou and Goldman 2004). Wang and Zhou (2007) provided both theoretical and empirical analyses on why co-training can work in single-view settings. They showed that the diversity between the learners is positively correlated with their joint performance. Zhou and Li (2005b) proposed tri-training, where three classifiers are alternately trained. When two of the three classifiers agree on their prediction for a given data point, that data point is passed to the other classifier along with the respective label. Crucially, tri-training does not rely on probabilistic predictions of individual classifiers, and can thus be applied to a much broader range of supervised learning algorithms.
The authors of the tri-training approach proposed to extend it to more than three learners—notably, to random forests (Li and Zhou 2007). The approach, known as co-forest, starts by training the decision trees independently on all labelled data. Then, in each iteration, each classifier receives pseudo-labelled data based on the joint prediction of all other classifiers on the unlabelled data: if the fraction of classifiers predicting a class \(\hat{y}_i\) for an unlabelled data point \(\mathbf {x}_i\) exceeds a certain threshold, the pseudo-labelled data point \((\mathbf {x}_i, y_i)\) is passed to the classifier. The decision trees are then all re-trained on their labelled and pseudo-labelled data. In the next iteration, all previously pseudo-labelled data is treated as unlabelled again. We note that, as the number of trees approaches infinity, this approach becomes a form of self-training.
Co-forest includes a mechanism for reducing the influence of possibly mislabelled data points in the pseudo-labelling step by weighting the newly labelled data based on prediction confidence. Deng and Zu Guo (2011) attempted to further prevent the influence of possibly mislabelled data points by removing “suspicious” pseudo-labellings. After each pseudo-labelling step, the prediction for each pseudo-labelled data point \(\mathbf {x}_i\) is compared to the (pseudo-)labels of its k nearest neighbours (both labelled and pseudo-labelled); in case of a mismatch, the pseudo-label is removed from \(\mathbf {x}_i\).
We note that in existing literature concerning co-forest, the size of the forest has always been limited to six trees. It has been empirically shown that, in supervised random forests, performance can substantially improve as the number of trees is increased (Oshiro et al. 2012). Therefore, it is likely that increasing the number of trees in co-forest will substantially affect relative performance compared to random forests.
4.2.3 Co-regularization
Co-training methods reduce disagreement between classifiers by passing information between them, in the form of pseudo-labelled data. Furthermore, the implicit objective of co-training is to minimize the error rate of the ensemble of classifiers. Sindhwani et al. proposed to make these properties explicit in a single objective function (Sindhwani et al. 2005; Sindhwani and Rosenberg 2008). They propose co-regularization, a regularization framework in which both the ensemble quality and the disagreement between base learners are simultaneously optimized. The key idea is to use an objective function comprised of two terms: one that penalizes incorrect predictions made by the ensemble, and another that directly penalizes different predictions of the base classifiers. To handle per-view noise within this framework, Yu et al. (2011) introduced Bayesian co-training, which uses a graphical model for combining data from multiple views and a kernel-based method for co-regularization. This model was extended to handle different noise levels per data point by Christoudias et al. (2009).
Co-training can be seen as a greedy optimization strategy for the co-regularization objective. The two components of the objective function are minimized in an alternating fashion: the prediction error of the ensemble is minimized by training the base learners independently, and the disagreement between classifiers is minimized by propagating predictions from one classifier to the others as if they were ground truth. We note, however, that the general co-regularization objective does not have to be optimized using a wrapper method, and many co-regularization algorithms use different approaches (see, e.g. Sindhwani and Rosenberg 2008; Yu et al. 2011).
4.3 Boosting
Ensemble classifiers consist of multiple base classifiers, which are trained and then used to form combined predictions (Zhou 2012). The simplest form of ensemble learning trains k base classifiers independently and aggregates their predictions. Beyond this simplistic approach, two main branches of supervised ensemble learning exist: bagging and boosting (Zhou 2012). In bagging methods, each base learner is provided with a set of l data points, which are sampled, uniformly at random with replacement, from the original data set (bootstrapping). The base classifiers are trained independently. When training is completed, their outputs are aggregated to form the prediction of the ensemble. In boosting methods, on the other hand, each base learner is dependent on the previous base learners: it is provided with the full data set, but with weights applied to the data points. The weight of a data point \(x_i\) is based on the performance of the previous base learners on \(x_i\), such that larger weights get assigned to data points that were incorrectly classified. The final prediction is obtained as a linear combination of the predictions of the base classifiers.
Technically, boosting methods construct a weighted ensemble of classifiers \(h_t\) in a greedy fashion. Let \(F_{T-1}(\mathbf {x}) = \sum _{t=1}^{T-1} \alpha _t \cdot h_t(\mathbf {x})\) denote the ensemble of classifiers \(h_t\) with weight \(\alpha _t\) at time \(T-1\). Furthermore, let \(\ell (\hat{y}, y)\) denote the loss function for predicting label \(\hat{y}\) for a data point with true label y. In each iteration of the algorithm, an additional classifier \(h_T\) is added to the ensemble with a certain weight \(\alpha _T\), such that the cost function
is minimized. Note that, at time T, the ensemble \(F_{T-1}\) is fixed. With particular choices of loss functions, such as \(\ell (\hat{y},y) = \exp (-\hat{y} \cdot y)\), the optimization problem yields a weighted classification problem for determining \(h_T\), and allows us to express the optimal \(\alpha _T\) in terms of the loss of \(h_T\) on the training data.
By definition, base learners in bagging methods are trained independently. Therefore, the only truly semi-supervised bagging method would apply self-training to individual base learners. Co-training, however, can be seen to be closely related to bagging methods: the only way classifiers interact is by the exchange of pseudo-labelled data; other than that, the classifiers can be trained independently and simultaneously. However, most co-training methods do not use bootstrapping, a defining characteristic of bagging methods. In boosting, on the other hand, there is an inherent dependency between base learners. Consequently, boosting methods can be readily extended to the semi-supervised setting, by introducing pseudo-labelled data after each learning step; this idea gives rise to the class of semi-supervised boosting methods.
Semi-supervised boosting methods have been studied extensively over the past two decades. The success achieved by supervised boosting methods, such as AdaBoost (Freund and Schapire 1997), gradient boosting, and XGBoost (Chen and Guestrin 2016), provides ample motivation for bringing boosting to the semi-supervised setting. Furthermore, the pseudo-labelling approach of self-training and co-training can be easily extended to boosting methods.
4.3.1 SSMBoost
The first effort towards semi-supervised boosting methods was made by Grandvalet et al., who extended AdaBoost to the semi-supervised setting. They proposed a semi-supervised boosting algorithm (Grandvalet et al. 2001), which they later extended and motivated from the perspective of gradient boosting (d’Alché Buc et al. 2002). A loss function is defined for unlabelled data, based on the predictions of the current ensemble and on the predictions of the base learner under construction. Experiments were conducted with multiple loss functions; the authors reported the strongest results using the expected loss of the new, combined classifier. The weighted error \(\epsilon _t\) for base classifier \(h_t\) is thus adapted to include the unlabelled data points, causing the weight term \(\alpha _t\) to depend on the unlabelled data as well.
Crucially, SSMBoost does not assign pseudo-labels to the unlabelled data points. As a result, it requires semi-supervised base learners to make use of the unlabelled data and is therefore intrinsically semi-supervised, in contrast to most other semi-supervised boosting algorithms, which are wrapper methods. Nevertheless, SSMBoost is included here, because it forms the foundation for all other forms of semi-supervised boosting algorithms, which do not require semi-supervised base learners.
4.3.2 ASSEMBLE
The ASSEMBLE algorithm, short for Adaptive Supervised Ensemble, pseudo-labels the unlabelled data points after each iteration, and uses these pseudo-labelled data points in the construction of the next classifier, thus alleviating the need for semi-supervised base learners (Bennett et al. 2002). As shown by its authors, ASSEMBLE effectively maximizes the classification margin in function space.
Since pseudo-labels are used in ASSEMBLE, it is not trivial to decide which unlabelled data points to pass to the next base learner. Bennett et al. (2002) proposed to use bootstrapping—i.e. sampling, uniformly at random, with replacement, l data points from the \(l + u\) labelled and unlabelled data points.
4.3.3 SemiBoost
The semi-supervised boosting algorithm SemiBoost addresses the problem of selecting data points to be used by the base learners by relying on the manifold assumption, utilizing principles from graph-based methods (Mallapragada et al. 2009). Each unlabelled data point is assigned a pseudo-label, and the corresponding prediction confidence is calculated based on a predefined neighbourhood graph that encodes similarity between data points. Then, a subset of these pseudo-labelled data points is added to the set of labelled data points for training the next base learner. The probability of a sample being selected for this subset is proportional to its prediction confidence. SemiBoost was successfully applied to object tracking in videos by Grabner et al. (2008).
SemiBoost uses the standard boosting classification model, expressing the final label prediction as a linear combination of the predictions of the individual learners. Its cost function, however, is highly dissimilar from the previously described semi-supervised boosting methods. Mallapragada et al. (2009) argue that a successful labelling of the test data should conform to the following three requirements. Firstly, the predicted labels of the unlabelled data should be consistent for unlabelled data points that are close to each other. Secondly, the predicted labels of the unlabelled data should be consistent with the labels of nearby labelled data points. And, thirdly, the predicted labels for the labelled data points should correspond to their true labels. These requirements are expressed in the form of a constrained optimization problem, where the first two are captured by the objective function, and the last is imposed as a constraint. In other words, the SemiBoost algorithm uses boosting to solve the optimization problem
where \(\mathcal {L}_U\) and \(\mathcal {L}_L\) are the cost functions expressing the inconsistency across the unlabelled and the combined labelled and unlabelled data, respectively, and \(\lambda \in \mathbb {R}\) is a constant governing the relative weight of the cost terms; A is an \(n \times n\) symmetric matrix denoting the pairwise similarities between data points. Lastly, \(F_T\) denotes the joint prediction function of the ensemble of classifiers at time T. We note that the optimization objective in Eq. 1 is very similar to the cost functions encountered in graph-based methods (see Sects. 6.3 and 7) in that it favours classifiers that consistently label data points on the same manifold. In graph-based methods, however, no distinction is generally made between labelled-unlabelled and unlabelled-unlabelled pairs.
4.3.4 Other semi-supervised boosting methods
The three previously discussed methods form the core of semi-supervised boosting research. Further work in the area includes RegBoost, which, like SemiBoost, includes local label consistency in its objective function (Chen and Wang 2011). In RegBoost, this term is also dependent on the estimated local density of the marginal distribution p(x). Several attempts have been made to extend the label consistency regularization to the multiclass setting (Tanha et al. 2012; Valizadegan et al. 2008).
5 Unsupervised preprocessing
We now turn to a second category of inductive methods, known as as unsupervised preprocessing, which, unlike wrapper methods and intrinsically semi-supervised methods, use the unlabelled data and labelled data in two separate stages. Typically, the unsupervised stage comprises either the automated extraction or transformation of sample features from the unlabelled data (feature extraction), the unsupervised clustering of the data (cluster-then-label), or the initialization of the parameters of the learning procedure (pre-training).
5.1 Feature extraction
Since the early days of machine learning, feature extraction has played an important role in the construction of classifiers. Feature extraction methods attempt to find a transformation of the input data such that the performance of the classifier improves or such that its construction becomes computationally more efficient. Feature extraction is an expansive research topic that has been covered by several books and surveys. We focus on a small number of particularly prominent techniques and refer the reader to the existing literature on feature extraction methods for further information (see, e.g. Guyon and Elisseeff 2006; Sheikhpour et al. 2017).
Many feature extraction methods operate without supervision, i.e. without taking into account labels. Principal component analysis, for example, transforms the input data to a different basis, such that they are linearly uncorrelated, and orders the principal components based on their variance (Wold et al. 1987). Other traditional feature extraction algorithms operate on the labelled data and try to extract features with high predictive power (see, e.g. Guyon and Elisseeff 2006).
Recent semi-supervised feature extraction methods have mainly been focused on finding latent representations of the input data using deep neural networks (in Sect. 6.2.1, we further discuss neural networks). The most prominent example of this is the autoencoder: a neural network with one or more hidden layers that has the objective of reconstructing its input. By including a hidden layer with relatively few nodes, usually called the representation layer, the network is forced to find a way to compactly represent its input data. Once the network is trained, features are provided by the representation layer. A schematic representation of a standard autoencoder is provided in Fig. 4.
The network can be considered to consist of two parts: the encoder h, which maps an input vector \(\mathbf {x}\) to its latent representation \(h(\mathbf {x})\), and the decoder g, which attempts to map the latent representation back to the original \(\mathbf {x}\). The network is trained by optimizing a loss function penalizing the reconstruction error: a measure of inconsistency between the input \(\mathbf {x}\) and the corresponding reconstruction \(g(h(\mathbf {x}))\). Once the network is trained, the latent representation of any \(\mathbf {x}\) can be found by simply propagating it through the encoder part of the network to obtain \(h(\mathbf {x})\). A popular type of autoencoders is the denoising autoencoder, which is trained on noisy versions of the input data, penalizing the reconstruction error of the reconstructions against the noiseless originals (Vincent et al. 2008). Another variant, the contractive autoencoder, directly penalizes the sensitivity of the autoencoder to perturbations in the input (Rifai et al. 2011b).
Autoencoders attempt to find a lower-dimensional representation of the input space without sacrificing substantial amounts of information. Thus, they inherently act on the assumption that the input space contains lower-dimensional substructures on which the data lie. Furthermore, when applied as a preprocessing step to classification, they assume that two samples on the same lower-dimensional substructure have the same label. These observations indicate that the assumptions underlying autoencoders are closely related to the semi-supervised manifold assumption.
In some domains, data is not inherently represented as a meaningful feature vector. Since many common classification methods require such a representation, feature extraction is a necessity in those cases. The feature extraction step, then, consists of finding an embedding of the given object into a vector space by taking into account the relations between different input objects. Examples of such approaches can be found in natural language processing (Collobert et al. 2011; Mikolov et al. 2013) and network science (Grover and Leskovec 2016; Perozzi et al. 2014; Wang et al. 2016).
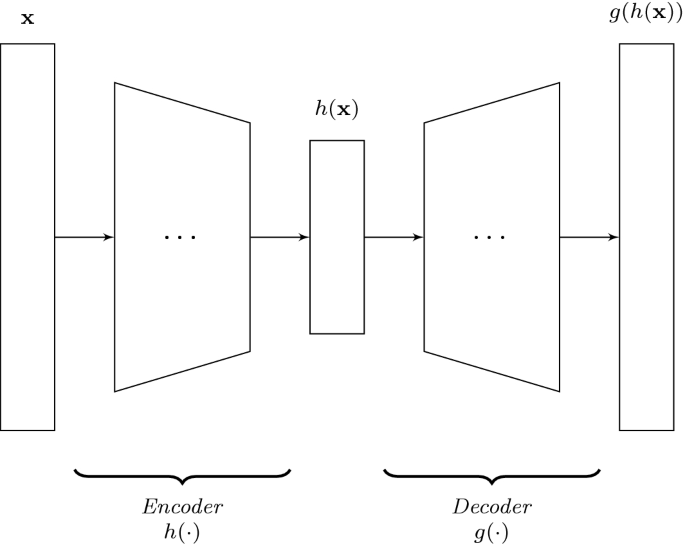
Simplified representation of an autoencoder. The rectangles correspond to layers within the network; the trapeziums represent the encoder and decoder portions of the network, which can consist of multiple layers
5.2 Cluster-then-label
Clustering and classification have traditionally been regarded as relatively disjoint research areas. However, many semi-supervised learning algorithms use principles from clustering to guide the classification process. Cluster-then-label approaches form a group of methods that explicitly join the clustering and classification processes: they first apply an unsupervised or semi-supervised clustering algorithm to all available data, and use the resulting clusters to guide the classification process.
Goldberg et al. (2009) first cluster the labelled data and a subset of the unlabelled data. A classifier is then trained independently for each cluster on the labelled data contained in it. Finally, the unlabelled data points are classified using the classifiers for their respective clusters. In the clustering step, a graph is constructed over the data points using the Hellinger distance; size-constrained spectral clustering is then applied to the resulting graph. Since the clustering is only used to segment the data, after which individual learners are applied to each cluster, the approach supports any supervised base learner.
Demiriz et al. (1999) first cluster the data in a semi-supervised manner, favouring clusters with limited label impurity (i.e. a high degree of consistency in the labels of the data points within a given cluster), and use the resulting clusters in classification. Dara et al. (2002) proposed a more elaborate preprocessing step, applying self-organizing maps (Kohonen 1998) to the labelled data in an iterative fashion. The unlabelled data points are then mapped, yielding a cluster assignment for each of them. If the cluster to which an unlabelled data point \(x_i\) is mapped contains only data points with the same label, that label is also assigned to \(x_i\). This process can be iterated, after which the resulting label assignments can be used to train an inductive classifier (in the work of Dara et al., a multilayer perceptron). We note that this approach can be regarded as a wrapper method (see Sect. 4).
5.3 Pre-training
In pre-training methods, unlabelled data is used to guide the decision boundary towards potentially interesting regions before applying supervised training.
This approach naturally applies to deep learning methods, where each layer of the hierarchical model can be considered a latent representation of the input data. The most commonly known algorithms corresponding to this paradigm are deep belief networks and stacked autoencoders. Both methods are based on artificial neural networks and aim to guide the parameters (weights) of a network towards interesting regions in model space using the unlabelled data, before fine-tuning the parameters with the labelled data.
Pre-training approaches have deep roots in the field of deep learning. Since the early 2000s, neural networks with multiple hidden layers (deep neural networks) have been gaining an increasing amount of attention. However, due to their high number of tunable parameters, training these networks has often been challenging: convergence tended to be slow, and trained networks were prone to poor generalization (Erhan et al. 2010). Early on, these problems were commonly addressed by employing unsupervised pre-training methods. Since then, this has been mostly superseded by the application of weight sharing, regularization methods and different activation functions. Consequently, the work we cover in this section mainly stems from the first decade of the 2000s. However, the underlying principles still apply, and are still used in other methods (such as ladder networks, see Sect. 6.2.2).
Deep belief networks consist of multiple stacked restricted Boltzmann machines (RBMs), which are trained layer-by-layer with unlabelled data in a greedy fashion (Hinton et al. 2006). The resulting weights are then used as the initialization for a deep neural network with the same architecture augmented by an additional output layer, enabling the model to be trained in a supervised manner on the labelled data.
Stacked autoencoders are very similar to deep belief networks, but they use autoencoders as their base models instead of RBMs. The autoencoders are trained layer-by-layer, where the encoding \(h(\mathbf {x})\) produced by each autoencoder is passed as the input to the next autoencoder, which is then trained to reconstruct it with minimal error. Finally, these trained autoencoders are combined, an output layer is added (as in deep belief networks), and the resulting network is trained on the labelled data in a supervised manner. The paradigm works with multiple types of autoencoders, including denoising and contractive autoencoders (Vincent et al. 2008; Rifai et al. 2011b).
Based on an empirical analysis of deep belief networks and stacked autoencoders, Erhan et al. (2010) suggested that unsupervised pre-training guides the neural network model towards regions in model space that provide better generalization. Deep neural networks are often motivated from the perspective that they learn a higher-level representation of the data at each layer. Thus, each layer of the network can be considered to contain a different representation of the input data. Both deep belief networks and stacked autoencoders attempt to guide the model in the extraction of these hierarchical representations, pushing the model towards the extraction of representations that are deemed informative. From that perspective, pre-training methods are closely related to the unsupervised feature extraction methods described earlier: they both use unlabelled data in an attempt to extract meaningful information from the input data. Crucially, however, the parameters used for unsupervised preprocessing can be changed in the supervised fine-tuning phase of pre-training methods, whereas they remain fixed after the unsupervised phase of feature extraction approaches.
6 Intrinsically semi-supervised methods
We now turn our attention to inductive learning algorithms that directly optimize an objective function with components for labelled and unlabelled samples. These methods, which we call intrinsically semi-supervised, do not rely on any intermediate steps or supervised base learners. Usually, they are extensions of existing supervised methods to include unlabelled samples in the objective function.
Generally, these methods rely either explicitly or implicitly on one of the semi-supervised learning assumptions (see Sect. 2.1). For instance, maximum-margin methods rely on the low-density assumption, and most semi-supervised neural networks rely on the smoothness assumption. We begin with an overview of the earliest intrinsically semi-supervised classification methods, namely maximum-margin methods. Next, we discuss perturbation-based methods, which directly incorporate the smoothness assumption. These encompass most semi-supervised neural networks. Then, we consider manifold-based techniques, which either explicitly or implicitly approximate the manifolds on which the data lie. Finally, we consider generative models.
6.1 Maximum-margin methods
Maximum-margin classifiers attempt to maximize the distance between the given data points and the decision boundary. This approach corresponds to the semi-supervised low-density assumption: when the margin between all data points and the decision boundary is large (except for some outliers), the decision boundary must be in a low-density area (Ben-David et al. 2009). Conceptually, maximum-margin methods thus lend themselves well to extension to the semi-supervised setting: one can incorporate knowledge from the unlabelled data to determine where the density is low and thus, where a large margin can be achieved.
6.1.1 Support vector machines
The most prominent example of a supervised maximum-margin classifier is the support vector machine (SVM): a classification method that attempts to maximize the distance from the decision boundary to the points closest to it, while encouraging data points to be classified correctly. It was one of the first maximum-margin approaches to be proposed in the semi-supervised setting, and it has been studied extensively since. We briefly introduce supervised SVMs, but the reader to machine learning book by Bishop (2006) for a more extensive introduction.
The objective of an SVM is to find a decision boundary that maximizes the margin, which is defined as the distance between the decision boundary and the data points closest to it. The term is also commonly used to describe the area extruding from the decision boundary in which no data points lie. The soft-margin SVM is a popular variant of SVMs that allows data points to violate the margin (i.e. lie between the corresponding margin boundary and the decision boundary, or even be misclassified) at a certain cost. SVMs supports implicit mapping of objects to higher-dimensional feature spaces using the so-called kernel trick.
Formally, when training an SVM, we endeavour to find a weight vector \(\mathbf {w} \in \mathbb {R}^d\) with minimal magnitude and a bias variable \(b \in \mathbb {R}\), such that \(y_i \cdot (\mathbf {w}^{\intercal } \cdot \mathbf {x}_i + b) \ge 1 - \xi _i\) for all data points \(\mathbf {x}_i \in X_L\). Here, \(\xi _i \ge 0\) is called the “slack variable” for \(x_i\), which allows \(x_i\) to violate the margin at some cost, which is incorporated into the objective function. The corresponding optimization problem can be formulated as follows:
where \(C \in \mathbb {R}\) is a constant scaling factor for the penalization of data points violating the margin. If C is large, the optimal margin will generally be narrow, and if C is small, the optimal margin will generally be wide. Thus, C acts as a regularization parameter, governing the trade-off between the complexity of the decision boundary and prediction accuracy on the training set.
The concept of semi-supervised SVMs, or S3VMs, is similar: we want to maximize the margin, and we want to correctly classify the labelled data. However, in the semi-supervised setting, an additional objective becomes relevant: we also want to minimize the number of unlabelled data points that violate the margin. Since the labels of the unlabelled data points are unknown, those that violate (i.e. lie within) the margin are penalized based on their distance to the closest margin boundary.
The intuitive extension of the optimization problem for S3VMs thus becomes

where \(C' \in \mathbb {R}\) is the margin violation cost associated with unlabelled data points.
S3VMs were proposed by Vapnik (1998), who motivated the problem from a more transductive viewpoint: instead of optimizing only over the weight vector, bias and slack variables, he proposed to also optimize over the label predictions \(\hat{\mathbf {y}}_U\). The constraint for the unlabelled data was formulated similarly to that for labelled data, but with the predicted labels \(\hat{\mathbf {y}}_U\). Though different at first sight, this formulation is equivalent to optimization problem 2 above, since any labelling \(\hat{\mathbf {y}}_U\) can only be optimal if, for each \(\hat{y}_i \in \hat{\mathbf {y}}_U\), \(\mathbf {x}_i\) is on the correct side of the decision boundary (i.e. \(\hat{y}_i \cdot (\mathbf {w}^{\intercal } \cdot \mathbf {x}_i + b) \ge 0\)). Otherwise, a better solution could be obtained by simply inverting the labelling of \(x_i\).
The extension of SVMs to the semi-supervised setting carries one significant disadvantage: the optimization problem encountered when training S3VMs becomes non-convex and NP-hard. Consequently, most efforts in the study of S3VMs have been focused on training them efficiently in practice.
Initial efforts showed promising results in applying S3VMs, but only to small data sets. For instance, Bennett and Demiriz (1999) proposed to use the L1 norm instead of the L2 norm in the objective function and posed the problem as a mixed integer programming problem. The earliest widely used optimization approach was introduced by Joachims (1999), whose approach for solving the optimization problem starts with a random assignment of \(\hat{\mathbf {y}}_U\) and a low value for \(C'\). Each iteration of the algorithm then consists of three steps. First, the supervised SVM optimization problem corresponding to the current label assignment \(\hat{\mathbf {y}}_U\) is solved. Next, the algorithm inverts the labels of each pair of data points for which this inversion improves the objective function, until no more such pairs exist. Finally, \(C'\) is increased. The algorithm terminates when \(C'\) reaches a predefined value specified by the user.
Other approaches to solving S3VMs have been put forward. For instance, several studies have proposed convex relaxations of the objective function, which can be solved using semidefinite programming methods. The earliest such approach was introduced by de Bie and Cristianini (2004, 2006) and later extended to the multiclass setting by Xu and Schuurmans (2005). However, due to their time complexity, these approaches do not scale to large amounts of data.
Chapelle et al. (2008) provided an overview of optimization procedures for S3VMs up until 2008 and broadly categorize S3VM optimization methods into two categories: combinatorial methods, finding the label assignment \(\hat{\mathbf {y}}_U\) that minimizes the objective function, and continuous methods, directly solving the optimization problem using label assignments \(\hat{y}_i = \text {sign}(\mathbf {w}^{\intercal } \cdot \mathbf {x}_i + b)\). All the approaches we have thus far described fall into the combinatorial category. However, the formulation in optimization problem 2 corresponds to the continuous approach; it underlies, for example, the concave-convex procedure, which decomposes the non-convex objective function into a convex and a concave component, and iteratively solves the optimization problem by replacing the concave component with a linear approximation at the current solution (Chapelle et al. 2008; Collobert et al. 2006).
Other continuous methods make use of the fact that problem 2 can be reformulated as an optimization problem without constraints. This stems from the fact that, if a labelled point \(\mathbf {x}_i \in X_L\) does not violate the margin, then \(\xi _i = 0\) in the optimal solution. If it does violate the margin, then \(\xi _i = 1 - y_i \cdot (\mathbf {w}^{\intercal } \cdot \mathbf {x}_i + b)\). For an unlabelled data point \(\mathbf {x}_i \in X_U\), \(\xi _i = 0\) if it does not violate the margin, and otherwise, \(\xi _i = 1 - |\mathbf {w}^{\intercal } \cdot \mathbf {x}_i + b|\). Thus, the optimization problem can be reformulated as
where \(f(\mathbf {x}_i) = \mathbf {w}^{\intercal } \cdot \mathbf {x}_i + b\).
This approach underlies \(\nabla \text {TSVM}\) by Chapelle and Zien (2005), which is based on a smooth approximation of the object function in Eq. 3 obtained by squaring the loss for the labelled data points, and by approximating the loss for the unlabelled data points with an exponential function. This optimization problem is then solved by gradient descent, where \(C'\) is gradually increased from some value close to zero to its intended value. Chapelle et al. (2006a) take a similar approach, where they keep \(C'\) fixed and use a continuous approach to transform the objective function from using only the labelled data to the final objective function.
As is the case for most semi-supervised learning methods, S3VMs are not guaranteed to perform better than their supervised counterparts (Singh et al. 2009). Specifically, if one of the underlying assumptions of the semi-supervised learning method is violated, there is a large risk of degrading performance when introducing the unsupervised objective. In the case of S3VMs, many highly diverse decision boundaries may exist that pass through a low-density area and achieve reasonable classification performance on the labelled data. Consequently, one can expect the generalization performance of such classifiers to exhibit significant variance.
Li and Zhou (2015) proposed to mitigate this problem by considering a diverse set of low-density separators and choosing the separator that performs best under the worst possible ground truth. Like all S3VM variants, their method is premised on the assumption that the optimal decision boundary lies in a low-density area. Their algorithm, called S4VM (safe S3VM), consists of two stages. Firstly, a diverse set of low-density decision boundaries is constructed. To this end, the authors propose to minimize a cost function that penalizes the pairwise similarity between the label predictions associated with the decision boundaries, using deterministic annealing and a heuristic sampling method. Secondly, the decision boundary with maximal worst-case performance gain over the supervised decision boundary is chosen as the result of S4VM training. This problem formulation limits the probability that the solution found by a S4VM exhibits performance worse than the corresponding supervised SVM.
The performance gain is formulated as the resulting increase in the number of correctly labelled data points minus the increase in the number of incorrectly labelled data. The latter term is multiplied by a factor \(\lambda \in \mathbb {R}\), governing the amount of risk of performance degradation one wishes to take. Formally, this is captured by a scoring function \(J(\hat{\mathbf {y}}, \mathbf {y}, \mathbf {y}^\text {svm})\) for a set of predicted labels \(\hat{\mathbf {y}}\), ground truth \(\mathbf {y}\), and supervised SVM predictions \(\mathbf {y}^\text {svm}\) defined as
where gain and lose denote the increases in correctly and incorrectly labelled data points, respectively. The optimal label assignment \(\bar{\mathbf {y}}\) in the worst-case true labelling can then be found as
where \(\mathcal {M}\) is the set of all candidate label assignments such that the corresponding decision boundary cuts through a low-density area. Due to the optimization over all possible label assignments, this optimization problem is NP-hard. Li and Zhou (2015) proposed a convex relaxation of the problem to effectively find a good candidate solution. Based on the assumption that the true label assignment is indeed in this set, they proved that, if \(\lambda \ge 1\), the performance of S4VM is never lower than that of the corresponding SVM. They validated this finding empirically, and showed that their implementation achieves performance improvements over standard SVMs similar to other S3VM approaches, but that, contrary to those, performance never significantly degrades relative to supervised SVMs.
The formulation of the second stage of the optimization procedure is not limited to support vector machines; indeed, it could theoretically be applied to any other semi-supervised learning algorithm. Li and Zhou (2015) additionally propose to perform both stages simultaneously in a deterministic annealing approach.
6.1.2 Gaussian processes
The notion of margin maximization is directly incorporated into support vector machines, and it should thus not come as a surprise that they are easily extended to the semi-supervised setting. Less obviously, similar efforts have been made with other supervised methods as well. Notably, Lawrence and Jordan (2005) have extended Gaussian processes to handle unlabelled data.
Gaussian processes are a family of non-parametric models that estimate the posterior probability over the function f mapping points in the input space to a continuous output space. When used for binary classification purposes, which are the focus of the paper by Lawrence and Jordan (2005), this output is in turn mapped to the label space \(\mathcal {Y} = \{-1, 1\}\). In the learning phase, f is established such that the likelihood of observing the data points \(((\mathbf {x}_i, y_i))_{i=1}^l\) is maximized. The resulting model can be considered an l-dimensional Gaussian distribution over the label vector \(\mathbf {y}\) of the input data points, where l is the number of labelled data points. Predictions for previously unseen data points \(\mathbf {x}^*\) can then be made by the model by evaluating the posterior probability of the respective class label, conditioned on the observed data points X, their associated labels \(\mathbf {y}\), and the observed data point \(\mathbf {x}^*\). The associated covariance matrix is the Gram matrix obtained from all \(l + 1\) data points using some kernel function k.
Lawrence and Jordan (2005) extended Gaussian processes for binary classification to the semi-supervised case by incorporating the unlabelled data points into the likelihood function. Specifically, the likelihood for an unlabelled data point \(\mathbf {x}\) is low when it is close to the decision boundary (i.e. when \(f(\mathbf {x})\) is close to 0), and high when it is far away from the decision boundary. The space of possible labels is expanded to include a null category; the posterior probability of this null category is high around the decision boundary. By imposing the constraint that unlabelled data points can never be mapped to the null category, the model is explicitly discouraged from choosing a decision boundary that passes through a high-density area of unlabelled data points. In other words, unlabelled data points should be far away from the decision boundary.
This extension of Gaussian processes to the semi-supervised setting has an interesting side effect: contrary to supervised Gaussian processes, introducing additional (unlabelled) data can increase the posterior variance. In other words, additional data can increase uncertainty. This effect stems from the observation that the likelihood function for a single unlabelled data point \(\mathbf {x}^*\) can be bimodal if \(f(\mathbf {x}^*)\) is close to 0.
6.1.3 Density regularization
Another way of encouraging the decision boundary to pass through a low-density area is to explicitly incorporate the amount of overlap between the estimated posterior class probabilities into the cost function. When there is a large amount of overlap, the decision boundary passes through a high-density area, and when there is a small amount of overlap, it passes through a low-density area. Several approaches have been proposed to use this assumption to regularize the objective function used in the context of classification.
Grandvalet and Bengio (2005) proposed to formalize this in the maximum a posteriori (MAP) framework by imposing a prior on the model parameters, favouring parameters inducing small class overlap in the predictive model (additionally, see Chapelle et al. 2006b). In particular, they used Shannon’s conditional entropy as a measure of class overlap. The prior is weighted by a constant \(\lambda \in \mathbb {R}\). The resulting objective is generally non-convex. The authors proposed solving the optimization problem by means of deterministic annealing. This entropy regularization method can be applied to any supervised learning method based on maximum-likelihood; the authors conducted experiments using logistic regression.
Corduneanu and Jaakkola (2003) proposed to directly incorporate an estimate of p(x), the distribution over the input data, into the objective function. They add a cost term to the objective function that reflects the belief that, in high-density areas, the posterior probability of y conditioned on x should not vary too much. To this end, they cover the entire input space \(\mathcal {X}\) with multiple, possibly overlapping, small regions; the cost term is then calculated as the sum of the mutual information between labels and inputs in each of these regions, weighted by the estimated density in the region. Their work is an extension of earlier work by Szummer and Jaakkola (2003).
Liu et al. (2013, 2015) proposed to incorporate the prior density into the node splitting criterion of decision trees. When selecting the hyperplane for splitting the data at a node in a decision tree, their approach penalizes high-density areas, using Gaussian kernel density estimators to approximate p(x). They conducted experiments with random forests consisting of 100 of the resulting semi-supervised decision trees and observed significant performance improvements over supervised random forests for several data sets. Levatić et al. (2017) introduced a more generic framework for using unlabelled data in the splitting criterion by constructing an impurity measure for unlabelled data. In their experiments, they promoted feature consistency within the data subsets on each side of the splitting boundary, penalizing empirical variance for numerical data and the Gini impurity for nominal data. We note that the specific categorization of these methods within our taxonomy depends on the choice of splitting criterion.
6.1.4 Pseudo-labelling as a form of margin maximization
Depending on the base learner used, the self-training approach described in Sect. 4 can also be regarded a margin-maximization method. For instance, when using self-training with supervised SVMs, the decision boundary is iteratively pushed away from the unlabelled samples. Even though the unlabelled data are not explicitly incorporated into the loss function, this amounts to exploiting the low-density assumption, as done in the case of S3VMs.
6.2 Perturbation-based methods
The smoothness assumption entails that a predictive model should be robust to local perturbations in its input. This means that, when we perturb a data point with a small amount of noise, the predictions for the noisy and the clean inputs should be similar. Since this expected similarity is not dependent on the true label of the data points, we can make use of unlabelled data.
Many different methods exist for incorporating the smoothness assumption into a given learning algorithm. For instance, one could apply noise to the input data points, and incorporate the difference between the clean and the noisy predictions into the loss function. Alternatively, one could implicitly apply noise to the data points by perturbing the classifier itself. These two approaches give rise to the category of perturbation-based methods.
Perturbation-based methods are often implemented with neural networks. Due to their straightforward incorporation of additional (unsupervised) loss terms into their objective function, they are extendable to the semi-supervised setting with relative ease. In recent years, neural networks have received renewed interest, due their successful application in various application areas (see, e.g. Collobert et al. 2011; Krizhevsky et al. 2012; LeCun et al. 2015). As a result, interest in semi-supervised neural networks has risen as well. In particular, neural networks with many layers, so-called deep neural networks, have given rise to interesting extensions to the semi-supervised setting. These intrinsically semi-supervised neural networks differ from the neural networks used for feature extraction, which we discussed in Sect. 5.1: the unlabelled data is incorporated directly into the optimization objective, rather than being used in a separate preprocessing step. Before continuing our discussion of such methods, we provide a short, general introduction to neural networks targeted at readers who are not too familiar with them. For a more extensive introduction to (deep) neural networks, we refer the interested reader to the recent book by Goodfellow et al. (2016).
6.2.1 Neural networks
A neural network is a formal system that computes an output vector by propagating an input vector through a network of simple processing elements with weighted connections between them. These simple processing elements are called nodes, and each of them contains an activation function that ultimately determines its output. In the feedforward networks we are considering here, nodes are usually grouped together into layers, where nodes from each layer are only connected to nodes from adjacent layers. The output vector is calculated by propagating the input vector through the weighted connections of the network. The output of each node, commonly referred to as its activation, is calculated by applying its activation function to the weighted sum of its inputs.
In supervised neural networks, the network weights are generally optimized to calculate the desired output vector for a given input vector. Considering the classification task, let \(f: \mathbb {R}^d \mapsto \mathbb {R}^{|\mathcal {Y}|}\) denote the vector-valued function modelled by a neural network, mapping an input vector \(\mathbf {x} \in \mathbb {R}^d\) to a \(|\mathcal {Y}|\)-dimensional output vector, where \(\mathcal {Y}\) denotes the set of possible classes. The function f is modelled by a neural network consisting of one or multiple layers; nodes in consecutive layers are connected by weighted edges. The weights are stored in a weight matrix W, where the element at position (i, j) denotes the weight of the edge between nodes i and j. We use \(f(\mathbf {x}; W)\) to denote the output obtained by propagating the input \(\mathbf {x}\) through the network and evaluating the activations of the final layer.
A loss function \(\ell \) is then defined, calculating the cost associated with output layer activations \(f(\mathbf {x};W)\) for a data point \(\mathbf {x}\) with true label y. The complete cost function is then defined as
The explicit notion of the parametrization of f by W is often omitted for conciseness.
The weights in W are iteratively optimized by passing input samples through the network and propagating the share of one or more samples in the cost \(\mathcal {L}\) backwards through the network. In this process, known as backpropagation, the weights are updated, using gradient descent or a similar method to iteratively minimize the cost (Goodfellow et al. 2016). To achieve good performance (in terms of loss), the network generally needs to pass multiple times over the entire training set, and each such pass is known as an epoch.
In the literature on neural networks, various notation styles are used. In particular, some of the articles we discuss use \({\varvec{\theta }}\) to denote the network weights, and denote the output of the corresponding network by \(f_{{\varvec{\theta }}}(\mathbf {x})\). In discussing these articles, we use this notation style when we deem it essential for maintaining relatability between the respective article and this survey.
6.2.2 Semi-supervised neural networks
The simplicity and efficiency of the backpropagation algorithm for a great variety of loss functions make it attractive to simply add an unsupervised component to \(\mathcal {L}\). This approach, which can be considered a form of regularization over the unlabelled data, is employed by virtually all semi-supervised deep learning methods. Furthermore, the hierarchical nature of representations in deep neural networks make them a viable candidate for other semi-supervised approaches. If deeper layers in the network express increasingly abstract representations of the input sample, one can argue that unlabelled data could be used to guide the network towards more informative abstract representations. Approaches based on this argument can be readily implemented in deep neural networks through the smoothness assumption, giving rise to so-called perturbation-based semi-supervised neural networks.
6.2.3 Ladder networks
The first such approach is the ladder network, proposed by Rasmus et al. (2015). It extends a feedforward network to incorporate unlabelled data by using the feedforward part of the network as the encoder of a denoising autoencoder, adding a decoder, and including a term in the cost function to penalize the reconstruction cost. The underlying idea is that latent representations that are useful for input reconstruction can also facilitate class prediction.
Consider a feedforward network with K hidden layers and weights W. We denote the inputs of a layer k (after normalization) as \(\mathbf {z}^{k}\), and the layer’s activations (i.e. after applying the activation function) as \(\mathbf {h}^{k}\). Note that for conciseness, when referring to layer inputs and activations, we do not explicitly mention the input data \(\mathbf {x}_i\), nor the parametrization W (e.g. we write \(\mathbf {h}^{k}\) for the activation vector of the k-th layer in a neural network with weights W for data point \(\mathbf {x}_i\)). In a regular feedforward network, the loss for a given data point \(\mathbf {x}_i\) is calculated by comparing the activations of the final layer \(f(\mathbf {x}_i) = \mathbf {h}^{K}\) to the corresponding label \(y_i\) with \(\ell (f(\mathbf {x}_i), y_i)\). As is shown in Eq. 4, the final cost function for the network is then \(\mathcal {L}(W) = \sum _{i = 1}^l \ell (f(\mathbf {x}_i), y_i)\).
Ladder networks add an additional term to \(\mathcal {L}\), in order to penalize the sensitivity of the network to small perturbations of the input. This is achieved by treating the entire network as the encoder part of a denoising autoencoder: isotropic Gaussian noise with mean zero and fixed variance is added to the input samples, and the existing feedforward network is treated as the encoder part. A decoder is then added alongside it, which is supposed to take the final-layer representation \(\mathbf {h}^{K}\) of a noisy data point \(\tilde{\mathbf {x}}\), and transform it to reconstruct \(\mathbf {x}\). To achieve this goal, a reconstruction cost is added to the cost function of the network. This inherently unsupervised cost term penalizes the difference between the input data points and their reconstructions generated by the network; it applies to both labelled and unlabelled data.
Although the autoencoder component of ladder networks is highly similar to regular denoising autoencoders, it differs from those in two ways. Firstly, a ladder network injects noise not only at the first layer, but at every layer. We denote the noisy inputs of a layer k as \(\tilde{\mathbf {z}}^{k}\), and the resulting activations as \(\tilde{\mathbf {h}}^{k}\). The supervised loss component for each sample ‘omes \(\ell (\tilde{\mathbf {h}}^{K}, y)\): the loss function is evaluated against the output for the noisy sample. Note that, in the testing phase, no noise is induced at any point in the network.
Secondly, ladder networks utilize a different reconstruction cost calculation. Where regular denoising autoencoders only penalize the difference between the clean input \(\mathbf {x}\) and the reconstructed version \(\hat{\mathbf {x}}\) of the noisy input \(\tilde{\mathbf {x}}\), the ladder network also penalizes local reconstructions of the hidden representations of the data. To do so, they enforce the decoder to have K layers, the same number of layers as the original network (the encoder). Each of these layers is also required to have the same number of nodes as the corresponding layer in the encoder. As a data point passes through the encoder, noise is added to the layer inputs at each layer. Then, at each layer in the decoder, the reconstructed representation \(\hat{\mathbf {z}}^{k}\) is compared to the hidden representation \(\mathbf {z}^{k}\) of the clean input \(\mathbf {x}\) at layer k in the encoder. This, of course, requires each data point to pass through the network twice: once without noise (to obtain \(\mathbf {z}\)), and once with noise (to obtain \(\tilde{\mathbf {z}}\) and the reconstructed \(\hat{\mathbf {z}}\)).
The final semi-supervised cost function of ladder networks then becomes
where \(\text {ReconsCost}(\cdot , \cdot )\) is defined as the squared L2 norm of the difference between the two normalized latent vectors and summed over the labelled and unlabelled data. For a detailed diagram of the information flow in ladder networks, which uses the same notation we do, we refer the reader to Figure 1 in the ladder network study by Pezeshki et al. (2016, p. 4).
Through their penalization of reconstruction errors, ladder networks effectively attempt to push the network towards extracting interesting latent representations of the data. The method is premised on the assumption that a latent representation \(\mathbf {h}^{K}\) that is useful for reconstructing \(\mathbf {x}\) can also facilitate the prediction of the corresponding class label. Rasmus et al. (2015) showed that ladder networks achieve state-of-the-art results on image data sets with partially labelled data, including MNIST. Interestingly, they also reported improvements when using only labelled data. Prémont-Schwarz et al. (2017) extended the ladder network architecture to the recurrent setting by adding connections between the encoders and decoders of successive instances of the network.
Rasmus et al. also proposed a simpler, computationally more efficient variant of ladder networks. This method, generally referred to as the \(\Gamma \)-model, only includes the reconstruction cost for the last layer. Therefore, no full decoder needs to be constructed. The \(\Gamma \)-model was empirically shown to provide substantial performance improvements over the corresponding fully-supervised model.
Pezeshki et al. (2016) conducted an extensive empirical study of the different components of ladder networks. Their study revealed that the reconstruction cost at the first layer of the neural network, combined with the introduction of noise in that layer, has critical impact on overall performance. We note that this architecture differs from the \(\Gamma \)-model, which only considers the last, rather than the first, layer of the network when assessing reconstruction error.
6.2.4 Pseudo-ensembles
Instead of explicitly perturbing the input data, one can also perturb the neural network model itself. Robustness in the model can then be promoted by imposing a penalty on the difference between the activations of the perturbed network and those of the original network for the same input. Bachman et al. (2014) proposed a general framework for this approach, where an unperturbed parent model with parameters \({\varvec{\theta }}\) is perturbed to obtain one or more child models. In this framework, which they call pseudo-ensembles, the perturbation is obtained from a noise distribution \(\Xi \). The perturbed network \(\tilde{f}_{{\varvec{\theta }}}(x; \xi )\) is then generated based on the unperturbed parent network \(f_{{\varvec{\theta }}}(x)\) and a sample \(\xi \) from the noise distribution. The semi-supervised cost function then consists of a supervised part and an unsupervised part. The former captures the loss of a perturbed network for labelled input data, and the latter the consistency across perturbed networks for the unlabelled data points.
Based on this framework, Bachman et al. (2014) proposed a semi-supervised cost function. Consider a neural network with K layers, and let \(f_{{\varvec{\theta }}}^k(x)\) and \(\tilde{f}_{{\varvec{\theta }}}^k(x; \xi )\) denote the k-th layer activations of the unperturbed and the perturbed network, respectively. The cost function of the pseudo-ensemble for neural networks then becomes
where the consistency loss \(\mathcal {V}_k\) penalizes differences between the activations of the unperturbed and perturbed networks at the k-th layer for the same input; \(\lambda _k\) is the relative weight of that particular cost term.Footnote 2 Bachman et al. propose to gradually increase each \(\mathbf {\lambda }_k\) over time, in effect placing more weight on the supervised objective in early iterations. One particularly prominent method of inducing noise is dropout, which randomly sets weights to zero (i.e. removes connections in the neural network) in each training iteration (Srivastava et al. 2014). In its originally proposed form, it was only applied to the supervised loss component. However, Wager et al. (2013) and Bachman et al. (2014) showed that dropout can be readily applied to unlabelled data as well.
The framework proposed by Bachman et al. is not limited to semi-supervised settings: the supervised term in the loss function can be applied to any supervised learning problem. Furthermore, a similar approach could be applied to other learning algorithms than neural networks, although the per-layer activation comparison would have to be replaced by a suitable alternative. Of course, since neural networks are entirely parametrized by connection weights, they offer a relatively straightforward implementation of model perturbation.
6.2.5 \(\Pi \)-model
Instead of comparing the activations of the unperturbed parent model with those of the perturbed models in the cost function, one can also compare the perturbed models directly. A simple variant of this approach, where two perturbed neural network models are trained, was suggested by Laine and Aila (2017). They use dropout (Srivastava et al. 2014) as the perturbation process, and penalize the differences in the final-layer activations of the two networks using squared loss. The weight of the unsupervised term in the cost function starts at zero, and is gradually increased. This approach, which they name the \(\Pi \)-model, can be seen as a simple variant of pseudo-ensembles.
6.2.6 Temporal ensembling
Since the noise process used in the methods described thus far is stochastic, the entire neural network model can be considered a stochastic model. With the \(\Pi \)-model, the network is regularized by penalizing the difference in output of two perturbed network models, drawn from the same distribution, on the same input. This idea can be extended to more than two perturbed models. Such an approach was taken by Sajjadi et al. (2016), who additionally perturbed the input data with random transformations. Of course, such pairwise comparisons will increase the running time of each training iteration quadratically in the number of perturbations. Pseudo-ensembles solve this problem by comparing the perturbed network activations to the activations of the unperturbed network model.
In the same paper in which they propose the \(\Pi \)-model, Laine and Aila (2017) propose a different approach to combining multiple perturbations of a network model: they compare the activations of the neural network at each epoch to the activations of the network at previous epochs. In particular, after each epoch, they compare the output of the network to the exponential moving average of the outputs of the network in previous epochs. Since the connection weights are changed in each iteration, this cannot be considered a form of pseudo-ensembling, but it is conceptually related, in that the network output is smoothed over multiple model perturbations.
This approach—dubbed temporal ensembling, because it penalizes the difference in the network outputs at different points in time during the training process—can be considered an extension of the \(\Pi \)-model. However, instead of comparing \(f_{{\varvec{\theta }}}(\mathbf {x};\xi )\) to \(f_{{\varvec{\theta }}}(\mathbf {x};\xi ')\) for \(\xi , \xi ' \sim \Xi \), it uses comparisons to the exponential moving average of final-layer activations in previous epochs. Since the loss function for unlabelled data points depends on the network output in previous iterations, temporal ensembling is closely related to pseudo-labelling methods, such as the pseudo-label approach (Lee 2013) and self-training. The crucial difference, however, is that the entire set of final-layer activations is compared to the activations of the previous network model, whereas self-training approaches and pseudo-label convert these outputs to a single, hard prediction (the pseudo-label).
6.2.7 Mean teacher
When training a neural network using temporal ensembling, unlabelled data points are incorporated into the learning process at large intervals. Since the activations for each input are only generated once per epoch, it takes a long time for the activations of unlabelled data points to influence the inference process. Tarvainen and Valpola (2017) attempted to overcome this problem by considering moving averages over connection weights, instead of moving averages over network activations.
Specifically, they suggested calculating the exponential moving average of weights at each training iteration, and compared the resulting final-layer activations to the final-layer activations when using the latest set of weights. Furthermore, they imposed noise on the input data to increase robustness. Formally, consider a neural network with weights \(W_t\) at iteration t, and a set of averaged weights \(\hat{W}_t\). The loss function \(\ell \) for an unlabelled input, then, is calculated as \(\ell (\mathbf {x}) = ||f(\tilde{\mathbf {x}};\hat{W}_t) - f(\tilde{\mathbf {x}}';W_t)||^2\), where \(\tilde{\mathbf {x}}\) and \(\tilde{\mathbf {x}}'\) are two noise-augmented versions of \(\mathbf {x}\). After calculating \(W_{t+1}\) using backpropagation, \(\hat{W}_{t+1}\) is calculated by \(\hat{W}_{t+1} = \alpha \cdot \hat{W}_t + (1 - \alpha ) \cdot W_{t+1}\), where \(\alpha \) is the decay rate. They name the model with averaged weights \(\hat{W}\) the teacher model, and the latest model with weights \(W_t\) the student model. This terminology has since been adopted in the literature when constructing semi-supervised neural networks.
6.2.8 Virtual adversarial training
Most of the perturbation-based approaches we have discussed thus far aim to promote robustness to small perturbations in the input. In doing so, they do not take into account the directionality of the perturbation: the injected noise is generally isotropic. However, it has been suggested in several studies that the sensitivity of neural networks to perturbations in the input is often highly dependent on the direction of these perturbations (Szegedy et al. 2013; Goodfellow et al. 2014b).
Miyato et al. (2018) proposed a regularization procedure that takes the perturbation direction into account. For each data point, labelled or unlabelled, they approximate the perturbation to the corresponding input data that would yield the largest change in network output (the so-called advesarial noise). They then incorporate a term into the loss function that penalizes the difference in the network outputs for the perturbed and unperturbed input data. For the unperturbed data point, the weights from the previous optimization iteration are used. Formally, the adversarial loss function for a sample \(\mathbf {x}\) can be defined as
where D is some divergence measure, \({\varvec{\gamma }}^{adv}\) is the adversarial noise, and \(\hat{W}\) are the previous network weights. Their approach is called virtual adversarial training, after the supervised adversarial training method proposed by Goodfellow et al. (2014b). In the latter approach, the outputs for the perturbed input are compared to the respective true outputs, rather than to the outputs of the network for the unperturbed input. As such, regular adversarial training can only be applied in a supervised setting. Adversarial training and virtual adversarial training both bear close similarity to contractive autoencoders: there, the sensitivity of the network to perturbations in the inputs is penalized by directly assessing the derivatives of the network outputs with respect to the inputs (Rifai et al. 2011b).
Park et al. (2018) combined concepts from virtual adversarial training with the \(\Pi \)-model (see Sect. 6.2.5). Instead of perturbing the unlabelled data points with adversarial noise, they apply an adversarial dropout mask to the network weights. First, they sample a random dropout mask \(\epsilon ^s\). Then, within some maximum distance from \(\epsilon ^s\), they find the dropout mask \(\epsilon ^{adv}\) that maximizes the difference between the unperturbed network output and the network output when the dropout mask is applied. Their loss function, then, is defined as
where the network is parameterized by the weights W as well as the dropout mask. Park et al. (2018) reported small performance improvements over virtual adversarial training and the \(\Pi \)-model.
6.2.9 Semi-supervised mixup
The perturbation-based neural networks we have discussed thus far rely on a particularly strong instantiation of the smoothness assumption: they encourage the predictions of the network to be identical for minor perturbations in the input, regardless of the direction of the perturbation. Recently, several researchers have considered the possibility of applying larger perturbations to the input. In this scenario, the direction of the perturbation generally does matter: when the perturbation points towards the decision boundary, the neural network outputs (but not necessarily the resulting class assignment) should typically change more than when it points away from the decision boundary.
This approach was formalized in the supervised mixup method, which was proposed by Zhang et al. (2018). They postulate that, in a robust classifier, the predictions for a linear combination of feature vectors should be a linear combination of their labels. They incorporate this by training on augmented data points in addition to the original labelled samples. To this end, they randomly select pairs of data points \((\mathbf {x}, \mathbf {y})\) and \((\mathbf {x}', \mathbf {y}')\) during training, and sample an interpolation factor \(\lambda \) from a symmetric beta distribution \(Beta(\alpha , \alpha )\), where \(\alpha \) is a predetermined hyperparameter. The network is then trained in a supervised manner on the linearly interpolated data point \((\hat{\mathbf {x}}, \hat{\mathbf {y}})\), where
In their experiments, Zhang et al. (2018) report substantial performance improvements in several training scenarios. Their best results are achieved when the beta distribution hyperparameter, \(\alpha \), is relatively low, causing the distribution to be strongly biased towards the extremes (i.e., \(\lambda =0\) and \(\lambda =1\)). Consequently, a large majority of interpolated samples will lie very close to either of the two selected data points.
The interpolation used in mixup can be applied to unlabelled samples as well, by interpolating the predicted labels rather than the true labels. Verma et al. (2019) combined mixup with the mean teacher approach (see Sect. 6.2.7), determining the target label for the augmented data point as the linear interpolation of the predictions of the teacher model. Interestingly, the interpolation was only applied to pairs of unlabelled data points, and not to mixed pairs of labelled and unlabelled data points. Berthelot et al. (2019) proposed a semi-supervised neural network composed of several supervised and semi-supervised components, including a semi-supervised extension of mixup. In selecting data points for interpolation, they do not distinguish between labelled and unlabelled data points. For labelled data points, the true label is then used in interpolation; for unlabelled data points, the predicted label is used.
Mixup exhibits similarities to graph-based methods (see Sects. 6.3 and 7): rather than employing pointwise perturbations, they apply perturbations based on combinations of different data points. Unlike in graph-based methods, however, the pairwise similarity between data points is not taken into account. The precise implications of this remain an interesting avenue for future research.
6.3 Manifolds
Perturbation-based methods make direct use of the smoothness assumption, penalizing differences in the behaviour of a classifier under slight changes in the input or in the classifier itself. However, one can imagine that not all minor changes to the input should yield similar outputs. In particular, if the data lie on lower-dimensional manifolds, one can expect the classifier to be insensitive only to minor changes along the manifold. This observation corresponds to the manifold assumption, which forms the basis of a significant body of intrinsically semi-supervised learning algorithms.
An m-dimensional manifold is a subspace of the original input space that locally resembles Euclidean space \(\mathbb {R}^m\). Reiterating the definition from Sect. 2, the manifold assumption states that (a) the input space is composed of multiple lower-dimensional manifolds on which all data points lie and (b) data points lying on the same lower-dimensional manifold have the same label. Formally, the first part of the manifold assumption states that each conditional probability distribution p(x|y) has a structure corresponding to the union of one or more Riemannian manifolds \(\mathcal {M}\). The second part, then, states that points on the same Riemannian manifold \(\mathcal {M}\) should have the same label. If these assumptions hold, information about the manifolds present in the input space can prove useful to classification.
In this section, we consider two general types of methods that are based on the manifold assumption. Firstly, we consider manifold regularization techniques, which define a graph over the data points and implicitly penalize differences in predictions for data points with small geodesic distance. Secondly, we consider manifold approximation techniques, which explicitly estimate the manifolds \(\mathcal {M}\) on which the data lie and optimize an objective function accordingly.
6.3.1 Manifold regularization
Consider a labelled data point \(\mathbf {x}_i\) and an unlabelled data point \(\mathbf {x}_j\), and assume that \(\mathbf {x}_i\) lies on some manifold \(\mathcal {M}\). If \(\mathbf {x}_j\) also lies on \(\mathcal {M}\), the manifold assumption implies that it is likely to have the same label as \(\mathbf {x}_i\). Furthermore, assuming that the data is concentrated on lower-dimensional manifolds, we can expect there to be more data points \(\mathbf {x}^*\) located on \(\mathcal {M}\).
If we have sufficiently many data points, we can thus expect there to be some “path”, a so-called geodesic, from \(\mathbf {x}_j\) to \(\mathbf {x}_i\), passing through other labelled or unlabelled samples, such that each path segment is relatively short. We can formalize this notion of a path by defining a graph over all data points, connecting pairs of data points that are close together in the original input space with an edge. Edge weights may be used to express the degree of similarity. This is the key principle underlying graph-based methods, which also form the basis of transductive semi-supervised learning (see Sect. 7).
Following this motivation, Belkin et al. (2005, 2006) formulated a general framework for regularizing inductive learners based on manifolds. They considered a kernel \(K: \mathcal {X} \times \mathcal {X} \mapsto \mathbb {R}\) with a corresponding hypothesis space \(\mathcal {H}_K\) and an associated norm \(||\cdot ||_K\). For supervised problems, then, they formulated the following general optimization problem:
for some loss function \(\ell \) on labelled data. Here, \(\gamma \) denotes the relative influence of the smoothing term. This objective function simultaneously penalizes misclassifications and promotes smoothness of the predictive function. For the semi-supervised setting, they added an unsupervised regularization term that penalizes differences in label assignments for pairs of data points that have a direct edge between them in the graph. Implicitly, they thereby encourage data points on the same manifold to receive the same label prediction.
This unsupervised regularization term gives rise to the class of manifold regularization methods. Consider a similarity graph with symmetric weighted adjacency matrix W, where \(W_{ij}\) denotes the similarity between data points \(\mathbf {x}_i\) and \(\mathbf {x}_j\) (\(W_{ij} = 0\) if the points are not connected). Let D denote the degree matrix, which is a diagonal matrix with \(D_{ii} = \sum _{j=1}^n W_{ij}\). The manifold regularization term \(||f||_I^2\) is then defined as
The regularization term can be expressed as \(\mathbf {f}^{\intercal } \cdot L \cdot \mathbf {f}\), where \(L = D - W\) is the graph Laplacian, and \(\mathbf {f} \in \mathbb {R}^n\) is the vector of evaluations of f for each \(\mathbf {x}_i\). The final optimization problem, including the manifold regularization term from Eq. 5, becomes
where \(\gamma _U\) determines the relative influence of the manifold regularization term.
This general framework leads to semi-supervised extensions of popular supervised learning algorithms, such as Laplacian support vector machines (LapSVMs), where the loss function \(\ell \) is defined as the hinge loss, i.e. \(\ell (\hat{y}, y) = \max \{1 - y\hat{y}, 0\}\). The supervised objective of LapSVMs maximizes the margin, and the unsupervised objective maximizes consistency of predictions along the estimated manifolds. In the paper proposing this framework, Belkin et al. (2006) suggested to solve the resulting loss minimization problem in its dual form, similar to popular solving techniques for supervised SVMs, in time \(O(n^3)\). Melacci and Belkin (2011) suggested solving the optimization problem in its primal form. Combining an early stopping criterion with a preconditioned conjugate gradient, they reduced the time complexity to \(O(c \cdot n^2)\) for some c that is empirically shown to be significantly smaller than n. Qi et al. (2012) suggested to extend twin SVMs, which optimize two SVM-like objective functions to yield two non-parallel decision boundaries (one for each class) (Jayadeva et al. 2007), to include the LapSVM regularization term. Sindhwani et al. (2005); Sindhwani and Rosenberg (2008) extend manifold regularization to the co-regularization framework (see Sect. 4.2). They proposed to construct two classifiers using an objective function similar to that of LapSVMs for two different views. Niyogi (2008) provided some theoretical analysis on the manifold regularization framework and analyzed its usefulness in semi-supervised learning.
Zhu and Lafferty (2005) proposed to incorporate a manifold regularization term in a generative model. They expressed the data-generating distribution as a mixture model, where the manifold is locally approximated by a mixture model component. Their loss function consists of a regularizer over the graph and a generative component. Weston et al. (2008) incorporated a manifold regularization term into deep neural networks. They proposed several methods to incorporate the manifold structure using an auxiliary embedding task, which encourages the latent representations in the neural network to be similar for similar inputs. Furthermore, they suggested to include a regularization term that explicitly pushes the latent representations of non-similar data points (defined as not being neighbours in the underlying graph) further apart. This approach was applied to hyperspectral image classification by Ratle et al. (2010). More recently, Luo et al. (2018) employed a loss function that encourages data points with the same label, either predicted (for unlabelled data points) or true (for labelled data points), to have similar latent representations in the penultimate layer. Additionally, it encourages the latent representations of data points with different predicted labels to be dissimilar.
The graph construction process is non-trivial and involves many hyperparameters. For instance, one can use a variety of connectivity criteria and edge weighting schemes. This makes the performance of manifold regularization methods highly dependent on hyperparameter settings. Geng et al. (2012) attempted to overcome this problem by first selecting a set of candidate Laplacians using different hyperparameter settings. They then posed the optimization problem as finding the linear combination of Laplacians that minimizes the manifold regularization objective. Formally, let there be m candidate Laplacians \(L_1, \dots , L_m\). Assume that the optimal manifold \(L^*\) lies in the convex hull of \(L_1, \dots , L_m\), i.e. \(L^* = \sum _{j=1}^m \mu _j \cdot L_j\) with \(\sum _{j=1}^m \mu _j = 1\) and \(\mu _j \ge 0\) for \(j = 1, \dots , m\). Since each \(L_j\) is a valid graph Laplacian, their linear combination is a valid graph Laplacian as well. Using exponential weights in the Laplacian, the manifold regularization term \(||f||_I^2\) then becomes
where \(||f||_{I(j)}^2\) is the manifold regularization term for candidate Laplacian \(L_j\). This final regularization term is then used in the original optimization problem from Eq. 6, with the addition of a regularization term \(||\mu ||^2\) to prevent the optimizer from overfitting to one manifold, and the constraint that \(\sum _{j=1}^m \mu _j = 1\). The objective function is then optimized with respect to \(\mu \) and f, which Geng et al. proposed to do in an EM-like fashion (i.e. fixing one and optimizing the other alternatingly). Their approach, which they call ensemble manifold regularization, was demonstrated to be superior to LapSVMs when applied to the SVM objective function on both synthetic and real-world data sets (Geng et al. 2012).
Aside from the methods proposed by Geng et al. (2012) and Luo et al. (2018), graph construction methods have mainly been studied in the context of transductive semi-supervised learning. We cover these methods extensively in Sect. 7.
6.3.2 Manifold approximation
Manifold regularization techniques introduce a regularization term that directly captures the fact that manifolds locally represent lower-dimensional Euclidean space. However, one can also consider a two-stage approach, where the manifold is first explicitly approximated and then used in a classification task. This is the approach taken by manifold approximation techniques, which construct an explicit representation of the manifold. We note that such approaches have a close relation to, and can in some cases even be considered as, semi-supervised preprocessing (see Sect. 5).
Rifai et al. (2011a) developed such an approach, where the manifolds are first estimated using contractive autoencoders (CAE, see Rifai et al. 2011a), and then used by a supervised training algorithm. CAEs are a variant of autoencoders that, in addition to the normal reconstruction cost term in autoencoders, penalize the derivatives of the output activations with respect to the input values. By doing so, they penalize the sensitivity of the learned features to small perturbations in the input without relying on sampling these perturbations (like denoising autoencoders do). Rifai et al. (2011b) claim that CAEs do not merely penalize sensitivity to small perturbations in the input, but that they penalize small perturbations of the input data along the manifold. They argue that this effect occurs due to the balance of promoting reconstruction and penalizing sensitivity to inputs. In other words, they claim to act directly on the manifold assumption.
The loss function \(\mathcal {L}\) utilized by contractive autoencoders with reconstruction cost \(\ell (\cdot , \cdot )\) is
where \(||J||_F\) is the Frobenius norm of the Jacobian matrix of the outputs with respect to the inputs, i.e. the sum of the squared partial derivatives of each output activation with respect to each input value. Rifai et al. additionally proposed to penalize the Hessian of the output values. Due to the computational complexity of exactly calculating the Hessian, they propose to approximate it as the difference between the Jacobians corresponding to small perturbations of the input.
Using singular value decomposition, they estimate the tangent plane at each input point to approximate the actual manifolds. As a result, the distance between two data points along the manifold can be estimated and subsequently used in classification, e.g. via a k-nearest neighbour algorithm. Additionally, they suggested to use a deep neural network pre-trained with multiple, stacked contractive autoencoders, where an additional term is added to the loss function to explicitly penalize sensitivity of the outputs to perturbations along the tangent plane.
A manifold can be described as a collection of overlapping charts, each having a simple geometry, that jointly cover the entire manifold. Such a collection of charts is known as an atlas. Pitelis et al. (2013, 2014) suggested to approximate these charts explicitly, associating each with an affine subspace. They alternate between assigning data points to charts, and choosing the affine subspace best matching the data for each chart. The charts are initialized using principal component analysis on a set of random subspaces. From this, a set of charts and a soft assignment of points to charts is obtained (since points can be associated with more than one chart). Finally, from these charts and soft assignments, kernels are generated that are then used in SVM-based supervised learning.
6.4 Generative models
The aforementioned methods are all discriminative: their only goal is to infer a function that can classify data points. In some cases, they produce probabilistic predictions; in others, they only yield the most likely class to assign. In all cases, they approach the classification problem without explicitly modelling any of the data-generating distributions. In contrast, the primary goal of methods based on generative models is to model the process that generated the data. When such a generative model is conditioned on a given label y, it can also be used for classification.
6.4.1 Mixture models
If prior knowledge about p(x, y) is available, generative models can be very powerful. For instance, consider the case where we know that our data p(x, y) is composed of a mixture of k Gaussian distributions, each of which corresponds to a certain class. Most discriminative methods would not be able to properly incorporate this prior information. Instead, one would be best served by simply fixing the model as a mixture of k Gaussian components. Each component \(j = 1, \dots , k\) has three parameters: a weight \(\pi _j\) (where \(\sum _{j=1}^k \pi _j = 1\)), mean vector \({\varvec{\mu }}_j\), and covariance matrix \({\varvec{\Sigma }}_j\). The most likely parameters can then be inferred, for example via expectation-maximization (Dempster et al. 1977). This model is generative: it models the distribution p(x, y), from which samples \((\mathbf {x}, y)\) can be drawn. The model can then also be used for classification: since the inference procedure yields an estimate \(\hat{p}(x|y)\) of the conditional distribution p(x|y), one can simply assign to an unlabelled data point \(\mathbf {x}_i \in X_U\) the class c that maximizes \(\hat{p}(\mathbf {x}_i | y_i = c) \cdot p(y_i = c)\). In the case of Gaussian mixture models described earlier, \(p(y_i = c) = \pi _c\).
The application of mixture models to generative modelling comes with several caveats (Cozman et al. 2003; Zhu 2008). Firstly, the mixture model should be identifiable: each distinct parameter choice for the mixture model should determine a distinct joint distribution, up to a permutation of the mixture components. Secondly, mixture models hinge on the critical assumption that the assumed model is correct. If the model is not correct, i.e. the true distribution p(x, y) does not conform with the assumed model, unlabelled data may hurt performance rather than improve it.
In real-world applications, the model correctness assumption rarely holds. Therefore, using mixture models for generative modelling can prove difficult. Some approaches exist to mitigate these problems; for example, Nigam et al. (2000) vary the influence of unlabelled data in EM. However, the rigidity of mixture models has caused attention to shift to more flexible classes of generative models.
6.4.2 Generative adversarial networks
Recently, a new type of learning paradigm known as generative adversarial networks (GAN) has been proposed, based on the idea of simultaneously constructing generative and discriminative learners (Goodfellow et al. 2014a). Generally implemented using neural networks, this approach simultaneously trains a generative model, tasked with generating data points that are difficult to distinguish from real data, and a discriminative classifier, tasked with predicting whether a given data point is ‘real’ or ‘fake’ (i.e. artificially generated).
The discriminator D, with parameters \({\varvec{\theta }}^{(D)}\), and generator G, with parameters \({\varvec{\theta }}^{(G)}\), are trained simultaneously to optimize a single objective function. Crucially, the discriminator’s goal is to minimize the objective function, whereas the generator’s goal is to maximize it. The discriminative function D expresses the probability that a data point \(\mathbf {x}\) is real; the generative function G generates a data point \(\mathbf {x}\) from a noise vector \(\mathbf {z}\) sampled from some distribution \(p(\mathbf {z})\). The cost function then consists of two terms; the first of these expresses the ability of the discriminator to identify true data points as such, and its optimization involves only the discriminator. The second term expresses the discriminator’s ability to identify fake data points, and its optimization involves both the discriminator and the generator. Formally, treating the real data as samples from some underlying probability distribution \(p(\mathbf {x})\), the optimization problem can be formulated as
where the parametrizations of D by \({\varvec{\theta }}^{(D)}\) and G by \({\varvec{\theta }}^{(G)}\) are omitted for conciseness.
The generator and the discriminator are trained in an alternating fashion. In each training step, multiple real data points are taken from the training data, and multiple fake data points are generated using G by sampling from \(p(\mathbf {z})\). The respective parameters \({\varvec{\theta }}^{(D)}\) and \({\varvec{\theta }}^{(R)}\) of the discriminator and the generator are then adjusted independently to optimize the empirical objective function over the batches of samples using gradient descent (Goodfellow 2017).
GANs are naturally unsupervised: they consist of a generative model, trained on unlabelled data, in combination with a discriminative classifier used to assess the quality of the generator. However, extensions exist to support classification in GANs. Proposed but not implemented in the original GAN paper (Goodfellow et al. 2014a), these methods also use a generator and a discriminator, but train the discriminator to identify different classes instead of only distinguishing real from fake data points. As such, GANs naturally extend to the semi-supervised case: the purely discriminative component of the loss term (the first cost term in Eq. 7) can easily be extended to incorporate true labels when these are known.
Springenberg (2015) proposed to extend the GAN discriminator to use \(|\mathcal {Y}|\) outputs, corresponding to the \(|\mathcal {Y}|\) possible classes. In their method, named CatGAN, they adapt the GAN cost function to include a cross-entropy cost term that penalizes misclassifications of real data by the discriminator. The ability of the discriminator to distinguish real from fake data points is assessed by considering the entropy of its outputs: for fake data, the discriminator should be uncertain of the class to assign, whereas it should be certain of its prediction for real data points. Furthermore, they add a cost term to encourage the generator to assign equal probability of generation to each class. We note that CatGAN can also be used in an unsupervised setting, by leaving out the cross-entropy cost term.
Salimans et al. (2016) extended GANs to the semi-supervised setting by using \(|\mathcal {Y}|+1\) outputs, where outputs \(1, \dots , |\mathcal {Y}|\) correspond to the individual classes, and output \(|\mathcal {Y}|+1\) is used to indicate fake data points. The loss function is adapted to include the cross-entropy loss of the prediction given the true label for the labelled data points. Otherwise, the loss function does not need to be changed significantly: when presented with an unlabelled data point, the discriminator’s estimate of the data point not being fake can be calculated as \(\sum _{c=1}^{|\mathcal {Y}|} D_c(\mathbf {x})\) for data point \(\mathbf {x}\), where \(D_c(\mathbf {x})\) is the value of output c of the discriminator. Odena (2016) independently proposed the same idea around the same time. Dai et al. (2017) provided some theoretical analysis of this framework. They argued that, for the method to improve performance over the discriminator by itself, the distribution modelled by the generator should complement the true data distribution: it should assign high probability density to regions in the input space that have low density in the true distribution.
Instead of using the discriminator for determining both the class and the authenticity of data points, one can also use a separate discriminative model for each task. This is the approach taken in triple adversarial networks, where one discriminator is used for classifying data points, and another is tasked with distinguishing real from fake data (Li et al. 2017).
For an extensive overview of GANs, their applications and their extensions, we refer the reader to the summary of the 2016 NIPS tutorial on GANs by Goodfellow (2017).
6.4.3 Variational autoencoders
Aside from GANs, further efforts have been made in recent years towards constructing semi-supervised deep generative models. One notable example is the proposal of variational autoencoders (VAE) and their application to semi-supervised learning.
Proposed by Kingma and Welling (2013), variational autoencoders are a type of latent variable model that treats each data point \(\mathbf {x}\) as being generated from a vector of latent variables \(\mathbf {z}\). Traditional latent variable models, such as autoencoders, generally yield a model with a highly complex distribution \(p(\mathbf {z})\), which makes it very difficult to use them for sampling. Contrastingly, VAEs constrain \(p(\mathbf {z})\) to be a simple distribution, such as a standard multivariate Gaussian distribution, from which sampling is straightforward. The transformation from \(p(\mathbf {z})\) to some more complex distribution \(p(\mathbf {x}|\mathbf {z})\) is then left to a decoder.
At training time, an encoder is used to determine the parameters of a distribution \(p(\mathbf {z}|\mathbf {x})\) based on a data point \(\mathbf {x}\). To generate reconstructions of \(\mathbf {x}\), latent vectors \(\mathbf {z}\) can then be sampled from this distribution and passed through the decoder. The decoder and encoder are jointly trained, minimizing a combined cost function consisting of (1) the Kullback-Leibler divergence between the posterior distribution \(p(\mathbf {z}|\mathbf {x})\) and some simple prior distribution \(p(\mathbf {z})\), and (2) the reconstruction cost of the output of the autoencoder for input data. The first term is crucial: it allows the decoder to be used as a generative model, taking in latent vectors that are directly sampled from \(p(\mathbf {z})\).
For brevity, we do not go into too much detail regarding the training procedure of VAEs, which includes a nontrivial backpropagation step due to the sampling procedure; instead, we refer the reader to the VAE tutorial by Doersch (2016).
Kingma et al. (2014) propose a two-step model to use VAEs for semi-supervised learning. In the first step, a VAE is trained on both the unlabelled and labelled data to extract meaningful latent representations from data points. By itself, this can be seen as an unsupervised preprocessing step, allowing the latent representations to be used by any supervised classifier. In the second step, they implement a VAE in which the latent representation is augmented with the label vector \(\mathbf {y}_i\), which contains the one-hot-encoded true labels for labelled data points and is treated as an additional latent variable for unlabelled data. In addition to the decoder, a classification network is introduced that infers the label predictions (Kingma et al. 2014).
7 Transductive methods
The semi-supervised learning methods described in the previous sections were all inductive algorithms: their primary goal was to use both labelled and unlabelled data to construct a procedure capable of providing label predictions for data points in the entire input space. In inductive learners, we can therefore clearly distinguish between a training phase and a testing phase: in the training phase, labelled data \((X_L, \mathbf {y}_L)\) and unlabelled data \(X_U\) are used to construct a classifier. In the testing phase, this classifier is used to independently classify the unlabelled or other, previously unseen data points.
In this section, we discuss transductive algorithms, which constitute the second major class of semi-supervised learning methods. Unlike inductive algorithms, transductive algorithms do not produce a predictor that can operate over the entire input space. Instead, transductive methods yield a set of predictions for the set of unlabelled data points provided to the learning algorithm. Contrary to the inductive setting, we thus cannot distinguish between a training phase and a testing phase: transductive algorithms are provided with labelled data \((X_L, \mathbf {y}_L)\) and unlabelled data \(X_U\), and output exclusively predictions \(\hat{\mathbf {y}}_U\) for the unlabelled data.
Transductive methods typically define a graph over all data points, both labelled and unlabelled, encoding the pairwise similarity of data points with possibly weighted edges (Zhu 2005). An objective function is then defined and optimized, in order to achieve two goals:
- 1.
For labelled data points, the predicted labels should match the true labels.
- 2.
Similar data points, as defined via the similarity graph, should have the same label predictions.
In other words, these methods encourage consistent predictions for similar data points while taking into account the known labels. A close similarity exists between these methods and the inductive manifold-based methods from Sect. 6.3. Both methods construct a graph over the data points and use pairwise similarity between data points to approximate more complex structures. The only major difference between them is that the inductive methods seek to obtain a classifier that can operate across the entire input space, whereas transductive methods only yield predictions for a given set of unlabelled data points. Collectively, these methods are often referred to as graph-based methods (Zhu 2008).
In Sect. 6.3, we focused on the interpretation and motivation of graph-based techniques from the theoretical perspective of manifolds. The development of transductive graph-based methods, however, has generally been driven directly by the two optimization criteria outlined above. This section, in which we discuss transductive semi-supervised learning, follows that line of reasoning.
7.1 A general framework for graph-based methods
Graph-based semi-supervised learning methods generally involve three separate steps: graph creation, graph weighting and inference (Jebara et al. 2009; Liu et al. 2012). In the first step, nodes (representing data points) in the graph are connected to each other, based on some similarity measure. In the second step, the resulting edges are weighted, yielding a weight matrix. The first two steps together are commonly referred to as the graph construction phase. After graph construction, we have a graph consisting of a set of nodes \(V = \{v_1, \dots , v_n\}\), corresponding to the data points, and an \(n \times n\) weight matrix W containing the edge weights for all pairs of nodes, where an edge weight of zero indicates that no edge is present. In the remainder of this section, we use the terms node and data point interchangeably in the context of graph-based methods.
Once the graph is constructed, it is used to obtain predictions \(\hat{\mathbf {y}}_U\) for the unlabelled data points. The general form of objective functions for transductive graph-based methods contains one component for penalizing predicted labels that do not match the true label, and another component for penalizing differences in the label predictions for connected data points. Formally, given a supervised loss function \(\ell \) for the labelled data and an unsupervised loss function \(\ell _U\) for pairs of labelled or unlabelled data points, transductive graph-based methods attempt to find a labelling \(\hat{\mathbf {y}}\) that minimizes
where \(\lambda \) governs the relative importance of the supervised term. Furthermore, some graph-based methods impose an additional unary regularization term on the unlabelled predictions. This general framework for graph-based methods allows for a multitude of variations in each of its steps. The formulation is commonplace in graph-based methods, and most graph-based inference algorithms can be shown to fit into this framework (Bengio et al. 2006; Subramanya and Talukdar 2014). It is also present in the manifold regularization framework (Belkin et al. 2005) discussed in Sect. 6.3.
For graph construction, most graph-based methods rely on the local similarity between data points in the input space, connecting data points with similar features. In that case, they implicitly rely on the smoothness assumption in addition to the manifold assumption. A parallel can be drawn between such graph-based methods and supervised nearest-neighbour methods. The latter predict the label of an unlabelled data point by looking at the labels of similar (i.e. nearby) labelled data points; graph-based methods also consider the similarity between pairs of unlabelled data points. Using that information, labels can be propagated transitively from a labelled data point to an unlabelled data point through other data points, both labelled and unlabelled. In that light, some graph-based methods can be seen as semi-supervised extensions to nearest-neighbour methods.
The spectrum of graph-based semi-supervised learning methods can be effectively structured based on the different approaches in the two main phases, i.e. graph construction and inference. Early work on graph-based methods focused mainly on the second phase, leaving graph construction a scarcely studied topic. Zhu (2008) noted that this imbalance might be unjust, and that graph construction can have significant impact on classifier performance. Later work has addressed this imbalance, and graph construction has since become an area of substantial research interest (de Sousa et al. 2013).
Graph-based transductive methods were introduced in the early 2000s, and graph-based inference methods were particularly intensively studied during the subsequent decade. A substantial portion of the research conducted in this field is covered in the semi-supervised learning survey by Zhu (2008) and in the doctoral thesis of Zhu (2005). Furthermore, Subramanya and Talukdar (2014) recently published a book on graph-based methods.
Following the general chronological order of research in the field of graph-based methods, we begin by outlining different approaches to solving the inference problem. After that, we provide an overview of research on graph construction.
7.2 Inference in graphs
The inference process in transductive methods consists of forming predictions \(\hat{\mathbf {y}}_U\) for the unlabelled data points \(X_U\). If the predicted labels of the labelled data are not fixed to the true labels in the inference process, optimization proceeds over the entire set of predicted labels \(\hat{\mathbf {y}}\).
Many approaches have been suggested for tackling the optimization of Expression 8; generally, these differ in the specific choices of the loss functions \(\ell \) and \(\ell _U\) and the trade-off parameter \(\lambda \). Furthermore, some methods infer only the most likely label assignment \(\hat{\mathbf {y}}\), while others estimate the marginal probability distributions. Jointly, these variations give rise to a plethora of different graph-based inference methods.
Although the general objective function from Expression 8 applies to the multiclass setting as well, many graph-based methods do not naturally extend beyond binary classification. The inference methods we focus on in the following mostly consider the binary classification case.
7.2.1 Hard label assignments: graph min-cut
The first graph-based semi-supervised classification method was proposed by Blum and Chawla (2001), who experimented with graph construction using a k-nearest neighbours algorithm and the \(\epsilon \)-neighbourhood (connecting pairs of data points with distance smaller than \(\epsilon \)). They kept the edge weights fixed and uniform, but experimented with changing the weight of edges between unlabelled data points relative to other edges.
Once the graph is constructed, the optimization problem is approached from a min-cut perspective. Specifically, a single source node \(v_+\) is added and connected with infinite weight to the positive data points, and a single sink node \(v_-\), connected with infinite weight to the negative data points. Determining the minimum cut, then, corresponds to finding a set of edges with minimal combined weight that, when removed, result in a graph with no paths from the source node to the sink node. All unlabelled nodes in the resulting graph that are in the component containing \(v_+\) are labelled as positive, and all unlabelled nodes that are in the component containing \(v_-\) are labelled as negative.
The min-cut approach can be seen to minimize the general objective function of Expression 8 as \(\lambda \) approaches infinity (fixing the predictions on labelled data points to their true labels) and \(\ell _U(\hat{y}_i, \hat{y}_j) = \mathbb {1}_{\{\hat{y}_i \ne \hat{y}_j\}}\), where \(\mathbb {1}\) is the indicator function. Note that, assuming labels 0 and 1 are used, the loss function for unlabelled data corresponds to quadratic cost, i.e. \(\mathbb {1}_{\{\hat{y}_i \ne \hat{y}_j\}} = (\hat{y}_i - \hat{y}_j)^2\). We can write the corresponding objective function as
Note that this objective function can be written in an alternate form, using the graph Laplacian \(L = D - W\) (where D is the diagonal matrix containing the degree for node i at \(D_{ii}\)) as follows:
Pang and Lee (2004) used the min-cut approach for classification in the context of sentiment analysis. They note that, instead of fixing the predicted labels of labelled data to their true labels, one can also assign finite weight to the edges connecting the source and sink nodes to the labelled data points, indicating confidences in either classification from the perspective of the individual data point.
The min-cut approach can easily lead to degenerate cuts, yielding a solution where almost all unlabelled data fall within the same graph component. This behaviour originates from the fact that more balanced cuts generally have more potential edges to cut: when a cut yields a split into negative nodes \(V^-\) and positive nodes \(V^+\), the number of edges to cut is potentially \(|V^+| \cdot |V^-|\). Joachims (2003) proposed to normalize the objective function of min-cut based on this potential number of edges being cut, using spectral methods to solve the resulting optimization problem.
Since the min-cut algorithm optimizes over a binary vector, it does not permit the extraction of marginal probabilities. To solve this problem, Blum et al. (2004) proposed to construct an ensemble of min-cut classifiers, each finding the minimum cut on a randomly perturbed version of the constructed graph, obtained by adding noise to the edge weights. The prediction probabilities are then simply calculated as the fraction of classifiers predicting a given label.
7.2.2 Probabilistic label assignments: Markov random fields
The lack of a principled, efficient way of estimating classification probabilities is a fundamental disadvantage of the min-cut approach to graph-based inference. In many cases, we wish to estimate the probability \(P(y_i = c)\) that an unlabelled data point \(\mathbf {x}_i\) has label c. Standard min-cut, however, only provides hard classifications (i.e. it only outputs class labels and no probabilities). Approaching graph-based methods from the perspective of Markov random fields provides a potential solution to this problem. In the following, with a slight abuse of notation, we use X and x to denote random variables and their realizations, respectively, rather than data points.
The Hammersley-Clifford theorem states that a probability distribution \(P(X = x)\) for random variables \(X_1, \dots , X_n\) corresponds to a Markov random field if a graph G exists such that the joint probability function \(P(X = x)\) can be factorized over the (maximal) cliques of G (Hammersley and Clifford 1971). In other words, \(P(X=x)\) corresponds to a Markov random field formed by G if
where Z is a normalization constant, \(C_G\) is the set of cliques in G, \(\psi _c\) is an arbitrary function, and \(x_c\) contains the realizations of random variables in clique c.
Using the Hammersley-Clifford theorem, we can show that the general minimization for graph-based methods, formulated in Expression 8, can be expressed in the form of a Markov random field. Let G denote the graph with weight matrix W obtained in the graph construction phase, and let \(\hat{Y} = (\hat{Y}_1, \dots , \hat{Y}_n)\) be a collection of random variables corresponding to the predicted labels (i.e. 0 or 1) for data points \(\mathbf {x}_1, \dots , \mathbf {x}_n\). We extend G by connecting each node \(\hat{Y}_i\) corresponding to a labelled data point \(\mathbf {x}_i\) to an auxiliary node \(Y'_i\), corresponding to a random variable which can only attain the true label \(y_i\). We denote the entire collection of random variables, or nodes, as \(Y = \hat{Y} \cup Y'\), where \(Y'\) contains all auxiliary nodes.Footnote 3 Since the auxiliary nodes can only attain the corresponding true label, \(P(Y = \mathbf {y}) = P(\hat{Y} = \hat{\mathbf {y}})\), where \(\hat{\mathbf {y}}\) is the set of predictions for our (labelled and unlabelled) data.
This situation is depicted in Fig. 5. The filled nodes \(\hat{Y}\) and the edges between them correspond to the original graph G; the unfilled nodes marked with plus and minus signs represent the auxiliary nodes \(Y'\), and are connected only to the corresponding filled node.

Example of an undirected graphical model for graph-based classification. Filled nodes and edges between them correspond to the original graph G. Unfilled nodes with plus and minus signs correspond to auxiliary nodes connected to labelled data
Recall that a clique is a subset of nodes within which every pair of nodes is connected by an edge. A maximal clique, then, is a clique that cannot be expanded, i.e. to which no nodes can be added such that the resulting subset of nodes also forms a clique. We note that every pair of nodes that is connected by an edge is part of at least one clique. Thus, if we can find an expression of the form
for \(P(\hat{Y} = \hat{\mathbf {y}})\), the probability distribution corresponds to a Markov random field. We proceed to show that we can express the cost function from Expression 8 such that minimizing it corresponds to maximizing the probability \(P(\hat{Y} = \hat{\mathbf {y}})\). We can distinguish between two different types of edges: those between two normal nodes u, v from \(\hat{Y}\), and those between a normal node and its auxiliary node (u from \(\hat{Y}\), v from \({Y}'\), or vice versa). Let us define \(\psi (\cdot )\) for these two cases independently:
The probability \(P(\hat{Y} = \hat{\mathbf {y}})\) then becomes
where the normalization constant Z can be calculated by summing over all possible configurations of Y. Although this is computationally too expensive for all practical purposes, the normalization constant is irrelevant in the context of maximum-likelihood estimation. The negative logarithm of the unnormalized probability, then, is exactly equal to the general loss function for graph-based methods from Expression 8. Maximizing the probability \(P(Y = \mathbf {y})\), we obtain the mode of the Markov random field, i.e. its most likely configuration. This solution is exactly the solution found when minimizing the min-cut objective (Blum and Chawla 2001).
In the inductive semi-supervised classification setting, classifier predictions are independent, i.e. \(P(\hat{Y} = \hat{\mathbf {y}}) = p(Y_1 = \hat{y}_1) \cdot p(\hat{Y}_2 = \hat{y}_2) \cdot \ldots \cdot p(\hat{Y}_n = \hat{y}_n)\). In transductive, graph-based methods, however, this is generally not the case: predictions are dependent on each other. Therefore, the most probable label assignment \(\hat{\mathbf {y}}\) generally does not correspond to the label assignment minimizing the expected error rate. To find the latter, each data point \(\mathbf {x}_i\) would have to be assigned the label that maximizes the marginal probability for that data point. Unfortunately, finding the marginal probabilities of a random field is not trivial.
Zhu and Ghahramani (2002b) attempted the calculation of the marginal probabilities via Markov chain Monte Carlo (MCMC) sampling. They experimented with Metropolis and Swendsen-Wang sampling and reported low computational efficiency. Shental and Domany (2005) used a multicanonical MCMC method to compute the marginal probabilities.
7.2.3 Efficient probabilistic label assignments: Gaussian random fields
There is no closed-form solution for calculating the marginal probabilities in the Markov random field with binary labels described previously. However, when the random variables \(\hat{Y}\) are relaxed to take real values, a closed-form solution exists. This approach was proposed by Zhu et al. (2003); it involves fixing the labels of the labelled data points and using quadratic cost for the pairs of predictions \(\hat{y}_i, \hat{y}_j \in \mathbb {R}\). This results in an objective function identical to that used in the min-cut formulation (see Expression 9), except for the relaxation of the predictions to real numbers.
Using real-valued predictions with a quadratic loss function, the exponential form for \(P(\hat{Y} = \hat{\mathbf {y}})\) is a multivariate Gaussian distribution. Thus, a closed-form solution for the mode of the field, which equals its mean, exists. Furthermore, the marginal probability distribution \(P(\hat{Y}_i = \hat{y}_i)\) is Gaussian as well, allowing for computation of the label predictions minimizing the error rate. This is why the random field is called a Gaussian random field.
Recall from Sect. 6.3 that we defined the graph Laplacian as \(L = D - W\), where D is the degree matrix (i.e. a diagonal matrix with the vertex degrees on the diagonal). Zhu et al. (2003) showed that the prediction function is harmonic, i.e. \(L \cdot \hat{\mathbf {y}} = 0\) at unlabelled data points, and is equal to the true label at labelled data points. The predicted label at each unlabelled data point is equal to the average of the predictions of its neighbours, i.e.
where \(N(v_i)\) denotes the neighbourhood of node \(v_i\), that is, \({N(v_i) = \{v_j: W_{ij} \ne 0\}}\). Furthermore, the solution is unique and \(\hat{y}_i \in [0,1]\) for each i. Thus, label predictions can be easily obtained from the solution using thresholding.
Computation of the marginals of the Markov random field involves an inversion of the submatrix \(L_U\) corresponding to the unlabelled data points in the graph Laplacian. This is computationally expensive for large numbers of unlabelled data points. Several other approaches have been proposed for finding the solution to the harmonic function, including loopy belief propagation and a conjugate gradient method (Zhu et al. 2003).
Before proposing the Gaussian random fields approach to graph-based methods, Zhu and Ghahramani (2002a) introduced the label propagation algorithm for inference on graphs. It is an iterative algorithm that computes soft label assignments \(\hat{y}_i \in \mathbb {R}\) by pushing (propagating) the estimated label at each node to its neighbouring nodes based on the edge weights. In other words, the new estimated label at each node is calculated as the weighted sum of the labels of its neighbours. In matrix notation, let
denote the transition matrix. The label propagation algorithm then consists of two steps, which are repeated until the label assignment \(\hat{\mathbf {y}}\) converges. Starting with an initial label assignment \(\hat{\mathbf {y}}\), which is random for the unlabelled data points and equal to the true labels for the labelled data points:
- 1.
Propagate labels from each node to the neighbouring nodes: \(\hat{\mathbf {y}} = A^{\intercal } \cdot \hat{\mathbf {y}}\).
- 2.
Reset the predictions of the labelled data points to the corresponding true labels.
Zhu (2005) showed that the algorithm is guaranteed to converge to the harmonic function solution described earlier. They also showed that the label propagation approach can be interpreted as a random walk with transition matrix A, which stops when a labelled node is hit. Wu et al. (2012a) cast this procedure in a framework they call partially absorbing random walks, where they, instead of deterministically stopping when a labelled node is hit, stochastically determine whether to stop (absorb) or continue the random walk. The label propagation approach is closely related to the Markov random walks approach by Szummer and Jaakkola (2002). Belkin et al. (2004) considered a similar objective function and provided some theoretical analysis. Azran (2007) proposed a random walk approach, where walks originate in unlabelled nodes and the labelled nodes are absorbing states. The probability that an unlabelled data points attains a certain label is then derived from the probability that a walk starting from the unlabelled node ends up in a labelled node of the corresponding class, as the length of the random walk approaches infinity.
7.2.4 Handling label noise and irregular graphs: local and global consistency
The Gaussian random fields method has two drawbacks (Subramanya and Talukdar 2014). Firstly, since the true labels are clamped to the labelled data points, it does not handle label noise well. Secondly, in irregular graphs, the influence of nodes with a high degree is relatively large. An approach closely related to the Gaussian random fields method that addresses these two issues was proposed by Zhou et al. (2004). It is commonly known as the local and global consistency (LGC) method, referring to the observation that graph-based methods promote consistency of labels on manifolds (global) and nearby in the input space (local). Note that, in the following, we assume \(\mathcal {Y} = \{-1, 1\}\).
To address the first issue, LCF does not clamp the true labels to the labelled data points, but rather penalizes the squared error between the true label and the estimated label. The second issue is addressed by regularizing the penalty term for unlabelled data points by the node degrees. Furthermore, predictions for the unlabelled data points are regularized by pulling them towards zero (Bengio et al. 2006). We can write the corresponding objective function in the general form as
where \(\lambda _U\) governs the weight of the penalization of inconsistencies in label predictions between neighbours in the graph.
Note that, like for the min-cut and MRF objectives, the last term of the objective function can be expressed using matrix notation. The only difference is that LGC uses the normalized graph Laplacian \(\tilde{L} = D^{-\frac{1}{2}} \cdot L \cdot D^{-\frac{1}{2}}\) instead of the unnormalized Laplacian \(L = D - W\) in that term. Like Gaussian random fields, this formalization admits a closed-form solution and a relatively efficient iterative approach to optimization. In this algorithm, the label vector \(\hat{\mathbf {y}}_{t+1}\) at iteration \(t+1\) is calculated based on that at iteration t, using the update rule
where \(\mathbf {y}\) is 0 for the unlabelled data points, and \(\alpha \) governs the relative importance of the calculated label vector versus the base label vector \(\mathbf {y}\). This algorithm is often referred to as label spreading.
7.2.5 Further research on graph-based inference
The previously described approaches, and in particular label propagation, have been the de facto standard approach to the inference phase in graph-based semi-supervised classification. Several variants and extensions to the approach have been proposed, which we briefly summarize here.
Baluja et al. (2008) applied graph-based methods to recommender systems (in particular, video suggestions to users). They proposed adsorption, a heuristic algorithm for predicting the label \(\hat{y}_i\) of node i by performing a random walk starting at node \(v_i\). At each step in the random walk, the process can either continue to the next step (continue), accept the label of a labelled node as the prediction (injection), or explicitly predict no label (abandonment). The last option corresponds to a dummy prediction, which specifically indicates that the learning algorithm is unable to produce a confident prediction. The option chosen by the algorithm is dependent on two hyperparameters governing the relative frequencies of the three options. Heuristic approaches to hyperparameter optimization have been proposed by Baluja et al. (2008) and Talukdar et al. (2008). The algorithm has been successfully applied to video recommendation, but is difficult to analyze theoretically, due to its many heuristic components. Talukdar and Crammer (2009) found that there is no objective function that is minimized by the adsorption algorithm, and proposed a modification to the algorithm for which such an objective function does exist.
The previously described graph-based methods can be sensitive to class imbalance (Zhu 2008). Several approaches have been proposed to mitigate this problem. Zhu et al. (2003) suggested to adjust the classification threshold such that the predicted label proportions correspond to predefined label proportions. Wang et al. (2008a) developed an optimization scheme that is less sensitive to noise in the true labels and that mitigates the problem of sensitivity to class imbalance by altering the influence of labelled samples based on the label proportions. They modified the objective function to optimize over real-valued predictions as well as binary label assignments; their approach penalizes the difference between real-valued and binary predictions. It then proceeds to optimize the objective function by optimizing, in an alternating fashion, the real-valued and binary label assignments. Later, Wang et al. (2013) considered the same approach from a graph max-cut perspective.
In structured output learning, the labels of data points cannot be captured using simple binary or real-valued representations. For instance, the output labels might be better represented with histograms or probability distributions in some cases (e.g. when predicting the relative traffic density at a location over a 24-hour cycle). Subramanya and Bilmes (2008, 2011) propagate discrete probability distributions through a graph, based on the KL-divergence between the distributions of different nodes. As an alternative to KL-divergence, Solomon et al. (2014) proposed to use the Wasserstein distance to measure the similarity between the discrete distributions of neighbouring nodes.
7.3 Graph construction
Arguably, graph construction is the most important aspect of graph-based methods: in order for inference to work, the constructed graph must accurately capture local similarities. Initial research on graph-based methods was chiefly focused on the inference phase, and graph construction was not well-studied (Zhu 2008). In recent years, however, this has changed. Extensive experiments have been conducted on different graph construction algorithms, and new methods have been introduced (de Sousa et al. 2013; Jebara et al. 2009; Subramanya and Talukdar 2014).
Since the nodes of the graph correspond to the data points (both labelled and unlabelled), the graph construction phase amounts to forming edges between nodes (yielding the adjacency matrix) and attaching weights to them (yielding the weight matrix). In many cases, the similarity measure governing the connectivity between nodes is also used to construct the weight matrix.
7.3.1 Adjacency matrix construction
The first step in constructing the graph is the creation of an adjacency matrix, whose elements indicate the presence of edges between pairs of nodes. Three popular methods for determining edges exist and are outlined below. We note that the first two methods, \(\epsilon \)-neighbourhood and k-nearest neighbours, are local in the sense that a set of neighbours can be determined independently for each node. In other words, the construction of a neighbourhood for a node \(v_i\) does not influence neighbourhood construction for another node \(v_j\) (unless \(v_i\) is a neighbour of \(v_j\)). The third method, b-matching, on the other hand, optimizes a global objective, and nodes that are far apart can significantly influence each other’s connectivity.
\(\epsilon \)-neighbourhood. One of the first methods to be used in graph construction was the \(\epsilon \)-neighbourhood method, which simply connects each node to all nodes to which the distance is at most \(\epsilon \) (Blum and Chawla 2001). In other words, an edge between \(\mathbf {x}_i\) and \(\mathbf {x}_j\) is created if, and only if, \(d(\mathbf {x}_i, \mathbf {x}_j) \le \epsilon \), where \(d(\cdot , \cdot )\) is some distance measure (usually Euclidean distance). The structure of the resulting graph is highly dependent on the choice of \(\epsilon \) and the distance measure. Furthermore, since \(\epsilon \) is fixed, it does not work well if the scale of patterns varies across the given input data. Because of these limitations, the \(\epsilon \)-neighbourhood method is rarely used in practice (de Sousa et al. 2013; Jebara et al. 2009).
k-nearest neighbours. The most common graph construction method for transductive methods is the k-nearest neighbours method, where each node is connected to its k nearest neighbours in the input space according to some distance measure (Blum and Chawla 2001). Using vanilla k-nearest neighbours, however, gives rise to a problem: since k-nearest neighbours is not symmetric, some additional processing is often required to obtain an undirected graph. Two options are commonly considered: one (symmetrick-nearest neighbours) constructs an edge if i is in the k-neighbourhood of j or vice versa, and the other (mutualk-nearest neighbours) constructs an edge if i and j are both in each other’s k-neighbourhood (de Sousa et al. 2013). The difference between the \(\epsilon \)-neighbours and k-nearest neighbours methods has been extensively studied by Maier et al. (2009) in the context of clustering methods.
b-matching. The postprocessing step used when constructing the graph with k-nearest neighbours generally results in a graph where not all nodes have exactly k neighbours. When symmetric k-nearest neighbours is used, it often occurs that some nodes have much higher degrees than others. Jebara et al. (2009) showed that this can negatively impact the final performance of the classifier. They proposed an edge construction method that enforces the regularity of the constructed graph, i.e. ensures that each node has the same number of neighbours, and that the nodes have exactly the requested number of edges. Their approach is inspired by matching, a concept from graph theory where one tries to find a subset of edges in a graph such that the edges do not share any vertices. In their method, referred to as b-matching, the objective is to find the subset of edges in the complete graph such that (1) each node has degree b and (2) the sum of the edge weights is maximized.
Note that, in the original study by Jebara et al. (2009), instead of maximizing the sum of edge weights, the objective is to minimize the sum of the distances between the remaining edges. However, since they define the distance matrix C as \(C_{ij} = \sqrt{W_{ii} + W_{jj} - 2W_{ij}}\), these notions are equivalent. The corresponding optimization problem is formulated as
It can be shown that this corresponds to the optimization problem solved by the k-nearest neighbour algorithm, with the addition of the constraint \(A_{ij} = A_{ji}\), which ensures that a symmetric graph is constructed without the need for a postprocessing step. However, the most efficient known algorithm for the b-matching optimization problem has time complexity \(O(n^{2.5})\) and requires several assumptions that are not always satisfied in real-world scenarios (Huang and Jebara 2011).
7.3.2 Graph weighting
The graph weighting phase, which forms the second step of graph construction, determines the weights for the edges in the graph. In many cases, the weights correspond to the similarity measure used for constructing the edges. For instance, a Gaussian kernel is often used to determine the connectivity of the graph via k-nearest neighbours as well as the edge weights. In that case, the graph construction process is usually considered as consisting of weighting and sparsification. First, a complete adjancency matrix K is constructed using some kernel function k for all pairs of nodes such that \(K_{ij} = k(\mathbf {x}_i, \mathbf {x}_j )\); then, the weight matrix W is obtained by sparsification, i.e. by removing edges from K.
Several methods for edge weighting have been suggested in the literature. One of the most popular weighting schemes is Gaussian edge weighting (de Sousa et al. 2013; Jebara et al. 2009), where
and \(\sigma ^2\) is the variance of the Gaussian kernel. Note that this corresponds to an isotropic Gaussian kernel; a non-isotropic Gaussian kernel can also be used. Hein and Maier (2007) suggested a local variant of Gaussian edge weighting for k-nearest neighbour graph construction, where the variance for a pair of nodes i and j is based on the maximum distance to i and j’s nearest neighbours. They define the weight as
where \(h_i = \max _{v_k \in N(v_i)} ||\mathbf {x}_i - \mathbf {x}_k||^2\), i.e. the maximum squared distance between i and its neighbours. Blum and Chawla (2001) suggested altering the importance of different features in the similarity calculation based on their information gain. Jebara et al. (2009) experimented with binary weights, where \(W_{ij} = 1\) if nodes i and j are connected, and \(W_{ij} = 0\) otherwise. We note that, in all weighting schemes described above, \(W_{ij} = 0\) for unconnected nodes.
The approaches described above determine edge weights \(W_{ij}\) based solely on the pairwise similarity of nodes \(\mathbf {x}_i\) and \(\mathbf {x}_j\). However, it is also possible to take the entire neighbourhood of a node into account when determining edge weights. Wang and Zhang (2008) introduced the linear neighbourhood propagation (LNP) algorithm, which is based on the assumption that the graph should be constructed such that any data point \(\mathbf {x}_i\) can be approximated as a linear combination of its neighbours, i.e.
for some vector \({\varvec{\epsilon }}_i\) of low magnitude. In this equation, the unknowns are the weights \(W_{ij}\) of the contributions of each neighbour to the approximation of \(\mathbf {x}_i\). The approach by Wang and Zhang consists of estimating W such that the difference between the approximated and true data points is minimized, while ensuring that the weights are positive and that the edge weights for each node sum to 1. This leads to the following optimization problem:
where \(\tilde{\mathbf {x}}_i = \sum _{v_j \in N(v_i)} W_{ij} \cdot \mathbf {x}_j\) is the reconstruction of \(\mathbf {x}_i\). This formulation is identical to locally linear embedding (Roweis and Saul 2000), with the addition of the two constraints. LNP can be solved via a series of quadratic programming problems (one for each node). Crucially, this depends on the fact that edge weight symmetry is not enforced, i.e. it is not necessarily the case that \(W_{ij} = W_{ji}\); because of this, the weights \(W_{ij}\) are independent of \(W_{kj}\) for \(k \ne i\).
Karasuyama and Mamitsuka (2013) combined locally linear embedding with a local similarity measure to obtain the edge weights. In particular, given a pre-constructed graph (for instance, using the k-nearest neighbour algorithm), they calculate the weight between two connected nodes using a Gaussian kernel with diagonal covariance matrix. This matrix is constructed by finding the coefficients that minimize the local reconstruction error.
Liu and Chang (2009) construct the weight matrix with a modification of the symmetric k-nearest neighbours method: two nodes are connected if either of them is in the other’s k-neighbourhood, but the weight of the two connections is summed if they are both in each other’s neighbourhoods. In other words, the modified weight matrix W is constructed based on the original weight matrix \(\hat{W}\) as follows:
de Sousa et al. (2013) compared the influence of several of these methods on the performance of transductive algorithms. In particular, they compared Gaussian weighting (where edges are weighted using an isotropic Gaussian kernel), the locally normalized Gaussian weighting approach by Hein and Maier (2007), and LNP (Wang and Zhang 2008); somewhat surprisingly, their best results were obtained using Gaussian weighting.
7.3.3 Simultaneous graph construction and weighting
The LNP algorithm described earlier (see Sect. 7.3.2) assumes that the graph structure (i.e. the set of edges) is known and fixed, and determines the edge weights for each node locally, based on the assumption that each node can be reconstructed as a linear combination of its neighbours. Instead of fixing the graph structure, however, one can also simultaneously infer the graph structure and edge weights by linearly reconstructing nodes based on all other nodes.
Such an approach was first proposed by Yan and Wang (2009), based on the sparse coding approach formulated for face recognition by Wright et al. (2009). The idea is to find, for each node \(\mathbf {x}_i\), a coefficient vector \(\mathbf {a} \in \mathbb {R}^n\) denoting the contributions of all other nodes to the reconstruction of \(\mathbf {x}_i\). This reconstruction is then calculated as \(\tilde{\mathbf {x}}_i = (X')^{\intercal } \cdot \mathbf {a}\), where \(X' \in \mathbb {R}^{n \times d}\) denotes the full data matrix, but with a row of zeroes at index i (since a node cannot contribute to its own reconstruction). Note that, unlike the LNP reconstruction from Problem 10 above, where only predetermined neighbours contribute to the reconstruction, here, all \(n-1\) other nodes can be used. The corresponding basic optimization problem attempts to minimize, for each data point, the norm of the error vector \({\varvec{\epsilon }}_i = \tilde{\mathbf {x}}_i - \mathbf {x}_i\), expressing the difference between the reconstruction and the true data. Crucially, unlike LNP, which makes use of the L2 norm and thus promotes non-sparse solutions, Yan and Wang (2009) use the L1 norm.
To avoid an underdetermined system of equations in some cases, the final optimization problem penalizes both the norm of the reconstruction coefficients and the noise vector. Let \(B = [(X')^{\intercal }, I_d]\) be the concatenation of the data matrix X and the \(d \times d\) identity matrix \(I_d\). Each data point \(\mathbf {x}_i\) can then be expressed as \(\mathbf {x}_i = B \cdot \mathbf {a}'\). Here, \(\mathbf {a}'\) consists of the coefficient vector \(\mathbf {a} = [a'_1, \dots , a'_n]\) and the error vector \({\varvec{\epsilon }} = [a'_{n+1}, \dots , a'_{n + d}]\). The final optimization problem for finding the optimal coefficients is then defined as follows for each node \(\mathbf {x}_i\):
where \(||\cdot ||_1\) is the L1 norm. Now, let \(\mathbf {a}_i\) denote the coefficient vector found for node i. The final graph is then constructed by simply adding an edge between nodes i and j if, and only if, \(a_{ij} \ne 0\), and setting the edge weights to the magnitude of the coefficient, i.e. \(W_{ij} = |a_{ij}|\). We note that this approach does not yield an undirected graph. A variant of the sparse coding method was proposed by He et al. (2011), who impose a constraint that all coefficients be non-negative to the objective from Problem 11 above.
The coefficient vector \(\mathbf {a}\) can be seen as an encoding of \(\mathbf {x}_i\). From this perspective, one would expect similar data points to have similar encodings. Zhuang et al. (2012) captured this assumption by constructing a matrix A from all encodings \(\mathbf {a}_1, \dots , \mathbf {a}_n\) and regularizing the objective function by the rank of A. Based on a well-known clustering method called low-rank representation (Liu et al. 2010a), the regularization term penalizes coefficient matrices of high rank. The low-rankness of the matrix captures global structures in the data, while sparsity captures the local structure among data points. The resulting optimization problem, which includes the non-negativity constraint and penalizes the L0 norm of the coefficients, is NP-hard; Zhuang et al. (2012) proposed a convex relaxation leading to an objective function identical to the sparse coding objective function from Problem 11, but with the addition of the non-negativity constraint and a surrogate for the rank-regularization term.
Although this approach achieves good empirical results, the motivation for using the contribution coefficients \(\mathbf {a}\) as graph weights remains somewhat unclear. As an alternative, Li and Fu (2013, 2015) use the reconstruction coefficients of pairs of data points to measure their similarity. In particular, they build a matrix of encoding vectors that is sparse and of low rank, and base the similarity of data points on the distance between their encodings. Additionally, they impose the constraint that all nodes have equal degree, to promote sparsity and regularity of the graph.
7.4 Scalable transductive learning
Many of the graph construction and inference methods discussed thus far suffer from a lack of scalability (Liu et al. 2012). Graph construction methods commonly have time complexity \(O(n^2)\) (for instance, k-nearest neighbours has time complexity \(O(k \cdot n^2)\)); inference methods generally have time complexity \(O(n^3)\) for obtaining exact solutions and O(n) for approximate solutions. This can make it difficult to apply graph-based methods in real-world applications with large quantities of unlabelled data. Liu et al. (2012) provided an overview of approaches for making graph-based methods more scalable.
To tackle the scalability problem, several approaches have been proposed for efficiently constructing smaller graphs on which inference can then be performed. These approaches rely on finding a set of \(m \ll n\)prototype or anchor points to express the structure in the given data more compactly. These anchor points are used in the inference phase, after which unlabelled data points are classified based on the inferred labels of nearby anchor points.
A commonly used approach called anchor graph regularization was proposed by Liu et al. (2010b). Their method seeks to find a set of anchor points \(\mathbf {u}_1, \dots , \mathbf {u}_k\) and corresponding label assignments so that each data point can be expressed as a linear combination of the labels of nearby anchor points. They choose the positions of the anchor points using k-means clustering, and construct a graph connecting each data point to its closest anchors. The corresponding weights are defined via locally linear embedding (see Sect. 7.3.2); these are then used to construct a graph over all data points. The inference process indirectly optimizes the predictions for the data points, by optimizing a graph-based objective function defined over the predictions for the anchor points. Zhang et al. (2009) proposed to use a low-rank approximation of the adjacency matrix in the unsupervised cost term in the inference phase.
7.5 From transduction to induction
To obtain a prediction for a previously unseen data point, transductive algorithms need to be rerun in their entirety. Since transductive methods are often computationally expensive, this is undesirable in many real-world problem scenarios, where on-the-fly classification for new data points is required. The issue of adapting and extending transductive algorithms for inductive classification has not been studied extensively in the literature, but some potential solutions have been proposed.
The first type of approach is to find the optimal label prediction for previously unseen data points based on the objective function of the transductive algorithm. Such approaches fix the transductive predictions, and use the resulting graph to predict the label of previously unseen data points (Bengio et al. 2006; Zhu 2008). Considering the general objective function from Expression 8, the optimal label assignment for the new data point \(\mathbf {x}_i\) can be calculated efficiently: assuming we can calculate the graph weights \(W_{ij}\) for \(j = 1, \dots , n\), we can optimize the objective function with respect to only the predicted label of the new data point. The label assignment \(\hat{y}_i\) minimizing the cost function is then given by the weighted majority vote of the neighbours of the data point:
The second type of approach for building an inductive classifier is to treat the pseudo-labelled predictions as true labels, and to train a supervised classifier based on these predictions. This approach was taken by Kveton et al. (2010), who used the min-cut approach to obtain the optimal labels, and trained a supervised SVM using the combined labelled and unlabelled data. One can consider using a transductive approach with probability estimates, such that unlabelled samples can be weighted in the supervised learning algorithm. This approach can also be applied to inductive learners that have a computationally expensive prediction phase: we can train an inductive semi-supervised learning method on all available data, and pass its predictions for the unlabelled data along with the labelled data to a computationally more efficient classifier (Urner et al. 2011). The efficient predictor can then be used to make predictions on new, previously unseen data points.
7.6 Classification in network data
In some real-world problems, data is inherently represented as a graph. Such data, which is commonly referred to as network data, arises in the context of social networks, scientific collaboration, spreading of infectious diseases, company structures, etc. In such networks, nodes generally represent entities (such as people), and edges represent relations between them (such as friendship). The field that studies such data is commonly known as network science (Barabási 2016).
In such network data, graph-based transductive methods are highly appropriate candidates for performing inference. Node classification in particular can be considered a regular transductive semi-supervised learning task, and is broadly applied to problems in social network analysis and natural language processing (Tan et al. 2011; Yang et al. 2016). Although there is a considerable amount of overlap between these fields, the semi-supervised learning and network science communities have operated rather independently. Of course, significant differences also exist between data that is inherently given in the form of a network and graphs that are inferred from input vectors based on some similarity measure.
Sen et al. (2008) provided an overview of inference techniques for node classification in network data. They emphasized the difference between local classification, where each node is classified individually based on its neighbours (possibly iteratively), and global classification, where a global, joint objective function is optimized. They specifically consider the iterative classification algorithm, which constructs a local, supervised classifier for each node and assigns to the node the most likely label based on its neighbours and their labels (Lu and Getoor 2003; Neville and Jensen 2000). This procedure is iterated until the predictions in the entire network stabilize. Yang et al. (2016) proposed a neural network-based approach that simultaneously predicts the label of a node and its context, i.e. (properties of) nearby nodes in the network, using node embedding.
They extended this approach to the inductive setting, by expressing the embedding as a function of the features of a given node (and not its context). The context is predicted using a random walk; similar approaches to that problem have been previously studied (Perozzi et al. 2014; Tang et al. 2015). Several approaches have been suggested to generalize convolutional neural network architectures to network data (see, e.g. Bruna et al. 2014; Duvenaud et al. 2015; Kipf and Welling 2016).
Network-based methods generally attempt to find a way to represent given network data as vectors, allowing for inductive inference (Yang et al. 2016). Interestingly, this can be considered the inverse task of what most semi-supervised graph-based methods attempt to do, which is to construct a graph based on vector data. These complementary approaches highlight the difference between ‘standard’, tabular data and data specified natively in the form of a network.
8 Related areas
Although the vast majority of semi-supervised learning research has been focussed on semi-supervised classification, other problems have also been studied. Semi-supervised regression, where the label space \(\mathcal {Y}\) is real-valued instead of categorical, is particularly closely related to semi-supervised classification; we cover it in limited detail below. Semi-supervised clustering, which can be considered the counterpart of semi-supervised classification, is also covered in some detail later in this section.
Some other areas related to semi-supervised classification are not covered in this survey. They include the field of active learning, where the learning algorithm can query the user for the labels of previously unlabelled data points. Consequently, new labelled data can be obtained. Since labelling data is generally costly, the challenge lies in the selection of unlabelled data points whose labels would be most informative (Settles 2012). We also do not cover learning from positive and unlabelled data, which is a special case of semi-supervised learning where the algorithm has access to a set of unlabelled data points, but where all labelled data points belong to a single class (see, e.g. Liu et al. 2002; Denis et al. 2005; Elkan and Noto 2008).
8.1 Semi-supervised regression
In classification problems, the label space \(\mathcal {Y}\) is categorical; in regression problems, on the other hand, the output value space is continuous. Although classification and regression problems are both concerned with predicting output values for input data points, most semi-supervised classification methods cannot be naturally applied to the regression setting.
A class of methods that can be rather easily extended to the regression setting is that of graph-based methods (see Sect. 7). Many such methods model a real-valued function in an intermediate step and incorporate the real-valued predictions in a regularization term in the objective function. These real-valued predictions can be readily utilized in the regression scenario (see, e.g. Belkin et al. 2004; Cortes and Mohri 2007).
The second class of methods that is naturally equipped to deal with regression problems is the class of wrapper methods (see Sect. 4). Although relatively little research has been conducted in this direction, wrapper methods such as self-training and co-training to regression methods can be readily applied in a semi-supervised regression setting. In fact, as in the case of supervised classification methods, any supervised regressor can be used within a wrapper method. Zhou and Li (2005a) proposed a co-training algorithm for semi-supervised regression. They construct two k-nearest neighbour regressors on the labelled data, which then iteratively pass pseudo-labelled data to each other. The labelling confidence, which is used to select data points to pseudo-label, is based on the performance of the regressors obtained when adding the pseudo-labelled data point to the training set, as measured on the labelled data.
8.2 Semi-supervised clustering
Semi-supervised classification is a relatively well-defined task, where one is presented with fully labelled data as well as completely unlabelled data. In semi-supervised clustering, however, the supervised information can take different forms. For instance, there can be must-link (two samples are known to be in the same cluster) and cannot-link (two samples are known to be in different clusters) constraints (Lange et al. 2005). It is also possible that some cluster assignments are known beforehand.
An example for incorporation of the latter type of information is the use of labelled data for cluster seeding. Basu et al. (2002) proposed to initialize the clusters based on the data points for which cluster assignments are known. For every cluster, they initialize the cluster centroid for the k-means algorithm to the mean feature values of the data points known to belong to that cluster. They also proposed an alternative of this approach, where the cluster assignments of the labelled data points are kept fixed in the k-means procedure.
Like semi-supervised regression, semi-supervised clustering is a relatively small research area when compared to semi-supervised classification. For a more extensive overview of semi-supervised clustering methods, we refer the reader to the recent survey by Bair (2013) and the older survey on clustering methods by Grira et al. (2004).
9 Conclusions and future perspectives
In this survey, we have presented an overview of the field of semi-supervised learning. Covering methods from the early 2000s and more recent advances, our survey constitutes an up-to-date review of this important topic within machine learning. Furthermore, we have presented a new taxonomy for semi-supervised classification methods, distinguishing between the primary objective of the approach (transductive versus inductive learning) and the way unlabelled data is used (i.e. wrapper methods, unsupervised preprocessing, and intrinsically semi-supervised methods).
Early research in the field of semi-supervised learning mainly focused on wrapper methods (Sect. 4) and semi-supervised extensions of traditional supervised algorithms (such as SVMs, see Sect. 6). Graph-based methods (Sects. 6.3 and 7) have been extensively researched over the past two decades. They are perhaps the most intuitive semi-supervised learning method, explicitly incorporating the similarity of different unlabelled data points in a principled way. However, they still pose computational challenges. In recent years, semi-supervised learning has developed along similar lines as supervised learning: notably, there has been a strong focus on semi-supervised neural networks, in the form of unsupervised preprocessing (Sect. 5.3) as well as semi-supervised regularization (Sect. 6.2). Additionally, deep generative models have been extended to the semi-supervised setting (Sect. 6.4).
From our perspective, one of the most important issues to be resolved in semi-supervised learning is the potential performance degradation caused by the introduction of unlabelled data. Although this has received relatively little attention in the literature (likely due to publication bias, as noted by Zhu 2008), many semi-supervised learning methods only perform better than their supervised counterparts or base learners in specific cases (Li and Zhou 2015; Singh et al. 2009). In other cases, the supervised baselines used for empirically evaluating the performance of semi-supervised learning methods are relatively weak, causing a skewed perspective on the benefits of incorporating unlabelled data (Oliver et al. 2018). Moreover, the potential performance degradation is generally much more significant than the potential improvement, especially in machine learning problems where strong performance is achieved with purely supervised learning. We believe that this is one of the main reasons for the dearth of applications of semi-supervised learning methods in practice when compared to supervised learning.
Notable exceptions are the recent advances in semi-supervised neural networks, which are generally perturbation-based (see Sect. 6.2). They incorporate the relatively weak smoothness assumption (i.e. minor variations in the input space should only cause minor variations in the output space). Empirically, these methods have been shown to consistently outperform their supervised counterparts. A considerable advantage of using neural networks for semi-supervised learning is that it is relatively straightforward to incorporate unsupervised loss terms into the cost function, which can then be optimized using backpropagation. This flexibility also accomodates the incorporation of more complex cost terms, facilitating, for example, graph-based regularization. For these reasons, we expect that the popularity of semi-supervised neural networks will continue to grow for the foreseeable future.
A second potential remedy for the lack of robustness of semi-supervised learning methods lies in the application of automated machine learning (AutoML) to the semi-supervised setting. Recently, there has been a steep increase in interest in the automatic selection and configuration of learning algorithms for a given classification problem. These approaches include meta-learning and neural architecture search as well as automated algorithm selection and hyperparameter optimization. While AutoML techniques have been prominently and successfully applied to supervised learning (see, e.g. Elsken et al. 2019; Feurer et al. 2015; Thornton et al. 2013), there has been no application to semi-supervised learning so far.
Another important step towards the adoption of semi-supervised in practice is the development of standardized software packages. Several highly popular toolkits exist for supervised learning, such as scikit-learn (Pedregosa et al. 2011), but there is much less standardization in the field of semi-supervised learning. We note that some generic toolkits do exist; the KEEL software package includes a semi-supervised learning module (Triguero et al. 2017), and implementations of some transductive graph-based methods exist in scikit-learn. For neural networks, it is typically relatively straightforward to implement semi-supervised loss terms within popular software packages such as PyTorch (Paszke et al. 2017) and TensorFlow (Abadi et al. 2016).
Lastly, we expect the strong distinction between clustering and classification to fade. Fundamentally, both approaches can be seen as special cases of semi-supervised in which either only labelled data or only unlabelled data is present. When we can confidently reason about the connections between the marginal distribution p(x) and the conditional distribution p(y|x), learning algorithms can make effective use of unlabelled as well as labelled data. The recent rise in popularity of generative models (see Sect. 6.4) can be seen as evidence for this paradigm shift.
Ultimately, we expect the incorporation of unlabelled data to be a vital step in the progress of machine learning and its applications. To uncover the intricate and complex structures underlying the data model, the machine needs to be able to infer patterns between observations about which it receives no explicit labelling information. Semi-supervised learning, which aims to provide mechanisms to build such connections, will be an important tool towards this end.
Notes
We note that the collections of data points referred to here are technically lists. However, following common usage, in this survey, we refer to them as ‘sets’ and, in a slight abuse of notation, apply standard set-theoretic concepts to them.
Bachman et al. (2014) consider distributions over the input data and consequently use expectations in their formalism; for consistency within this survey, we replaced these expectations by averages over the given data.
We note that technically, \(\hat{Y}\), \(Y'\) and Y are lists rather than sets, but—following common practice in the machine learning literature—use set notation in the following.
References
Abadi, M., Barham, P., Chen, J., Chen, Z., Davis, A., Dean, J., Devin, M., Ghemawat, S., Irving, G., & Isard, M., et al. (2016). Tensorflow: A system for large-scale machine learning. In 12th USENIX symposium on operating systems design and implementation (OSDI 16) (pp. 265–283).
Abney, S. (2002). Bootstrapping. In Proceedings of the 40th annual meeting on association for computational linguistics, association for computational linguistics (pp. 360–367).
Anderberg, M. R. (1973). Cluster analysis for applications. Cambridge: Academic Press.
Azran, A. (2007). The rendezvous algorithm: Multiclass semi-supervised learning with Markov random walks. In Proceedings of the 24th international conference on machine learning (pp. 49–56).
Bachman, P., Alsharif, O., & Precup, D. (2014). Learning with pseudo-ensembles. In Advances in neural information processing systems (pp. 3365–3373).
Bair, E. (2013). Semi-supervised clustering methods. Wiley Interdisciplinary Reviews: Computational Statistics, 5(5), 349–361.
Balcan, M. F., Blum, A., & Yang, K. (2005). Co-training and expansion: Towards bridging theory and practice. In Advances in neural information processing systems (pp. 89–96).
Baluja, S., Seth, R., Sivakumar, D., Jing, Y., Yagnik, J., Kumar, S., Ravichandran, D., & Aly, M. (2008). Video suggestion and discovery for youtube: Taking random walks through the view graph. In Proceedings of the 17th international conference on world wide web (pp. 895–904). ACM.
Barabási, A. L. (2016). Network science. Cambridge: Cambridge University Press.
Basu, S., Banerjee, A., & Mooney, R. (2002). Semi-supervised clustering by seeding. In Proceedings of the 19th international conference on machine learning (pp. 27–34).
Belkin, M., Matveeva, I., & Niyogi, P. (2004). Regularization and semi-supervised learning on large graphs. In Proceedings of the international conference on computational learning theory (pp. 624–638). Springer.
Belkin, M., Niyogi, P., & Sindhwani, V. (2005). On manifold regularization. In Proceedings of the 10th international conference on artificial intelligence and statistics (pp. 17–24).
Belkin, M., Niyogi, P., & Sindhwani, V. (2006). Manifold regularization: A geometric framework for learning from labeled and unlabeled examples. Journal of Machine Learning Research, 7, 2399–2434.
Ben-David, S., Lu, T., Pál, D., & Sotáková, M. (2009). Learning low density separators. In Proceedings of the 12th international conference on artificial intelligence and statistics (pp. 25–32).
Bengio, Y., Delalleau, O., & Le Roux, N. (2006). Chapter 11. Label propagation and quadratic criterion. In O. Chapelle, B. Schölkopf, & A. Zien (Eds.), Semi-supervised learning (pp. 193–216). Cambridge: The MIT Press.
Bennett, K. P., & Demiriz, A. (1999). Semi-supervised support vector machines. In Advances in neural information processing systems (pp. 368–374).
Bennett, K. P., Demiriz, A., & Maclin, R. (2002). Exploiting unlabeled data in ensemble methods. In Proceedings of the 8th ACM SIGKDD international conference on knowledge discovery and data mining (pp. 289–296). ACM.
Berthelot, D., Carlini, N., Goodfellow, I., Papernot, N., Oliver, A., & Raffel, C. (2019). Mixmatch: A holistic approach to semi-supervised learning. arXiv:1905.02249.
Bishop, C. M. (2006). Pattern recognition and machine learning. Berlin: Springer.
Blum, A., & Chawla, S. (2001). Learning from labeled and unlabeled data using graph mincuts. In Proceedings of the 18th international conference on machine learning (pp. 19–26).
Blum, A., Lafferty, J., Rwebangira, M. R., & Reddy, R. (2004). Semi-supervised learning using randomized mincuts. In Proceedings of the 21st international conference on machine learning (p. 13).
Blum, A., & Mitchell, T. (1998). Combining labeled and unlabeled data with co-training. In Proceedings of the 11th annual conference on computational learning theory (pp. 92–100). ACM.
Bruna, J., Zaremba, W., Szlam, A., & LeCun, Y. (2014). Spectral networks and locally connected networks on graphs. In International conference on learning, representations.
Chapelle, O., Chi, M., & Zien, A. (2006a). A continuation method for semi-supervised SVMs. In Proceedings of the 23rd international conference on machine learning (pp. 185–192).
Chapelle, O., Schölkopf, B., & Zien, A. (2006b). Semi-supervised learning (1st ed.). Cambridge: The MIT Press.
Chapelle, O., Sindhwani, V., & Keerthi, S. S. (2008). Optimization techniques for semi-supervised support vector machines. Journal of Machine Learning Research, 9, 203–233.
Chapelle, O., & Zien, A. (2005). Semi-supervised classification by low density separation. In Proceedings of the 10th international workshop on artificial intelligence and statistics (pp. 57–64).
Chen, K., & Wang, S. (2011). Semi-supervised learning via regularized boosting working on multiple semi-supervised assumptions. IEEE Transactions on Pattern Analysis and Machine Intelligence, 33(1), 129–143.
Chen, M., Chen, Y., & Weinberger, K. Q. (2011). Automatic feature decomposition for single view co-training. In Proceedings of the 28th international conference on machine learning (pp. 953–960).
Chen, T., & Guestrin, C. (2016). Xgboost: A scalable tree boosting system. In Proceedings of the 22nd ACM SIGKDD international conference on knowledge discovery and data mining (pp. 785–794). ACM.
Christoudias, C. M., Urtasun, R., Kapoorz, A., & Darrell, T. (2009). Co-training with noisy perceptual observations. In Proceedings of the 2009 IEEE conference on computer vision and pattern recognition (pp. 2844–2851). IEEE.
Collobert, R., Sinz, F., Weston, J., & Bottou, L. (2006). Large scale transductive SVMs. Journal of Machine Learning Research, 7, 1687–1712.
Collobert, R., Weston, J., Bottou, L., Karlen, M., Kavukcuoglu, K., & Kuksa, P. (2011). Natural language processing (almost) from scratch. Journal of Machine Learning Research, 12, 2493–2537.
Corduneanu, A., & Jaakkola, T. (2003). On information regularization. In Proceedings of the 19th conference on uncertainty in artificial intelligence (pp. 151–158). Morgan Kaufmann Publishers Inc.
Cortes, C., & Mohri, M. (2007). On transductive regression. In Advances in neural information processing systems (pp. 305–312).
Cozman, F. G., Cohen, I., & Cirelo, M. C. (2003) Semi-supervised learning of mixture models. In Proceedings of the 20th international conference on machine learning (pp. 99–106).
Culp, M., & Michailidis, G. (2008). An iterative algorithm for extending learners to a semi-supervised setting. Journal of Computational and Graphical Statistics, 17(3), 545–571.
Dai, Z., Yang, Z., Yang, F., Cohen, W. W., & Salakhutdinov, R.R. (2017). Good semi-supervised learning that requires a bad gan. In Advances in neural information processing systems (pp. 6510–6520).
d’Alché Buc, F., Grandvalet, Y., & Ambroise, C. (2002). Semi-supervised marginboost. Advances in Neural Information Processing Systems, 1, 553–560.
Dara, R., Kremer, S. C., & Stacey, D. A. (2002). Clustering unlabeled data with SOMs improves classification of labeled real-world data. In Proceedings of the international joint conference on neural networks (Vol. 3, pp. 2237–2242). IEEE.
Dasgupta, S., Littman, M. L., & McAllester, D. A. (2002). PAC generalization bounds for co-training. In Advances in neural information processing systems (pp. 375–382).
de Bie, T., & Cristianini, N. (2004). Convex methods for transduction. In Advances in neural information processing systems (pp. 73–80).
de Bie, T., & Cristianini, N. (2006). Semi-supervised learning using semi-definite programming. In O. Chapelle, B. Schölkopf, & A. Zien (Eds.), Semi-supervised learning (pp. 119–135). Cambridge: The MIT Press.
de Sousa, C. A. R., Rezende, S. O., & Batista, G. E. (2013) Influence of graph construction on semi-supervised learning. In Proceedings of the joint European conference on machine learning and knowledge discovery in databases (pp. 160–175). Springer.
Demiriz, A., Bennett, K. P., & Embrechts, M. J. (1999). Semi-supervised clustering using genetic algorithms. In Artificial Neural Networks in Engineering (pp. 809–814).
Dempster, A. P., Laird, N. M., & Rubin, D. B. (1977). Maximum likelihood from incomplete data via the EM algorithm. Journal of the Royal statistical society, Series B, 39, 1–38.
Deng, C., & Zu Guo, M. (2011). A new co-training-style random forest for computer aided diagnosis. Journal of Intelligent Information Systems, 36(3), 253–281.
Denis, F., Gilleron, R., & Letouzey, F. (2005). Learning from positive and unlabeled examples. Theoretical Computer Science, 348(1), 70–83.
Doersch, C. (2016). Tutorial on variational autoencoders. arXiv:1606.05908.
Dópido, I., Li, J., Marpu, P. R., Plaza, A., Dias, J. M. B., & Benediktsson, J. A. (2013). Semisupervised self-learning for hyperspectral image classification. IEEE Transactions on Geoscience and Remote Sensing, 51(7), 4032–4044.
Du, J., Ling, C. X., & Zhou, Z. H. (2011). When does cotraining work in real data? IEEE Transactions on Knowledge and Data Engineering, 23(5), 788–799.
Dua, D., & Graff, C. (2019). UCI machine learning repository. Retrieved September 12, 2019 from http://archive.ics.uci.edu/ml.
Duvenaud, D. K., Maclaurin, D., Iparraguirre, J., Bombarell, R., Hirzel, T., Aspuru-Guzik, A., & Adams, R. P. (2015). Convolutional networks on graphs for learning molecular fingerprints. In Advances in neural information processing systems (pp. 2224–2232).
Elkan, C., & Noto, K. (2008). Learning classifiers from only positive and unlabeled data. In Proceedings of the 14th ACM SIGKDD international conference on knowledge discovery and data mining (pp. 213–220). ACM.
Elsken, T., Metzen, J. H., & Hutter, F. (2019). Neural architecture search: A survey. Journal of Machine Learning Research, 20(55), 1–21.
Erhan, D., Bengio, Y., Courville, A., Manzagol, P. A., Vincent, P., & Bengio, S. (2010). Why does unsupervised pre-training help deep learning? Journal of Machine Learning Research, 11, 625–660.
Feurer, M., Klein, A., Eggensperger, K., Springenberg, J., Blum, M., & Hutter, F. (2015). Efficient and robust automated machine learning. In Advances in neural information processing systems (pp. 2962–2970).
Freund, Y., & Schapire, R. E. (1997). A decision-theoretic generalization of on-line learning and an application to boosting. Journal of Computer and System Sciences, 55(1), 119–139.
Geng, B., Tao, D., Xu, C., Yang, L., & Hua, X. S. (2012). Ensemble manifold regularization. IEEE Transactions on Pattern Analysis and Machine Intelligence, 34(6), 1227–1233.
Goldberg, A. B., Zhu, X., Singh, A., Xu, Z., & Nowak, R. D. (2009). Multi-manifold semi-supervised learning. In Proceedings of the 12th international conference on artificial intelligence and statistics (pp. 169–176).
Goldman, S., & Zhou, Y. (2000) Enhancing supervised learning with unlabeled data. In Proceedings of the 17th international conference on machine learning (pp. 327–334).
Goodfellow, I. (2017). NIPS 2016 tutorial: Generative adversarial networks. arXiv:1701.00160.
Goodfellow, I., Bengio, Y., & Courville, A. (2016). Deep learning. Cambridge: The MIT Press.
Goodfellow, I., Pouget-Abadie, J., Mirza, M., Xu, B., Warde-Farley, D., Ozair, S., Courville, A., & Bengio, Y. (2014a). Generative adversarial nets. In Advances in neural information processing systems (pp. 2672–2680).
Goodfellow, I., Shlens, J., & Szegedy, C. (2014b). Explaining and harnessing adversarial examples. arXiv:1412.6572.
Grabner, H., Leistner, C., Bischof, H. (2008). Semi-supervised on-line boosting for robust tracking. Proceedings of the 10th European conference on computer vision (pp. 234–247).
Grandvalet, Y., & Bengio, Y. (2005). Semi-supervised learning by entropy minimization. In Advances in neural information processing systems (pp. 529–536).
Grandvalet, Y., d’Alché Buc, F., & Ambroise, C. (2001). Boosting mixture models for semi-supervised learning. International conference on artificial neural networks (pp. 41–48).
Grira, N., Crucianu, M., & Boujemaa, N. (2004). Unsupervised and semisupervised clustering: A brief survey. In 7th ACM SIGMM international workshop on multimedia information retrieval.
Grover, A., & Leskovec, J. (2016). node2vec: Scalable feature learning for networks. In Proceedings of the 22nd ACM SIGKDD international conference on knowledge discovery and data mining (pp. 855–864). ACM.
Guyon, I., & Elisseeff, A. (2006). An introduction to feature extraction. In I. Guyon, M. Nikravesh, S. Gunn, & L. A. Zadeh (Eds.), Feature extraction (pp. 1–25). Berlin: Springer.
Haffari, G. R., & Sarkar, A. (2007). Analysis of semi-supervised learning with the Yarowsky algorithm. In Proceedings of the 23rd conference on uncertainty in artificial intelligence (pp. 159–166).
Hammersley, J. M., & Clifford, P. (1971). Markov fields on finite graphs and lattices. Retrieved October 27, 2019 from http://www.statslab.cam.ac.uk/~grg/books/hammfest/hamm-cliff.pdf.
He, R., Zheng, W. S., Hu, B. G., & Kong, X. W. (2011). Nonnegative sparse coding for discriminative semi-supervised learning. In Proceedings of the 2011 IEEE conference on computer vision and pattern recognition (pp. 2849–2856). IEEE.
Hein, M., & Maier, M. (2007). Manifold denoising. In Advances in neural information processing systems (pp. 561–568).
Hinton, G. E., Osindero, S., & Teh, Y. W. (2006). A fast learning algorithm for deep belief nets. Neural Computation, 18(7), 1527–1554.
Huang, B., & Jebara, T. (2011). Fast b-matching via sufficient selection belief propagation. In Proceedings of the 14th international conference on artificial intelligence and statistics (pp. 361–369).
Jayadeva, K. R., & Chandra, S. (2007). Twin support vector machines for pattern classification. IEEE Transactions on Pattern Analysis and Machine Intelligence, 29(5), 905–910.
Jebara, T., Wang, J., & Chang, S. F. (2009) Graph construction and b-matching for semi-supervised learning. In Proceedings of the 26th annual international conference on machine learning (pp. 441–448).
Joachims, T. (1999). Transductive inference for text classification using support vector machines. In Proceedings of the 16th international conference on machine learning (Vol. 99, pp. 200–209).
Joachims, T. (2003). Transductive learning via spectral graph partitioning. In Proceedings of the 20th international conference on machine learning (pp. 290–297).
Karasuyama, M., & Mamitsuka, H. (2013) Manifold-based similarity adaptation for label propagation. In Advances in neural information processing systems (pp. 1547–1555).
Kingma, D. P., Mohamed, S., Rezende, D. J., & Welling, M. (2014). Semi-supervised learning with deep generative models. In Advances in neural information processing systems (pp. 3581–3589).
Kingma, D. P., & Welling, M. (2013). Auto-encoding variational Bayes. In International conference on learning, representations.
Kipf, T. N., & Welling, M. (2016). Semi-supervised classification with graph convolutional networks. arXiv:1609.02907.
Kiritchenko, S., & Matwin, S. (2001). Email classification with co-training. In Proceedings of the 2001 conference of the centre for advanced studies on collaborative research (P. 8). IBM press.
Kohonen, T. (1998). The self-organizing map. Neurocomputing, 21(1–3), 1–6.
Krizhevsky, A. (2009). Learning multiple layers of features from tiny images. Master’s thesis, University of Toronto, Department of Computer Science.
Krizhevsky, A., Sutskever, I., & Hinton, G. E. (2012). Imagenet classification with deep convolutional neural networks. In Advances in neural information processing systems (pp. 1097–1105).
Kveton, B., Valko, M., Rahimi, A., & Huang, L. (2010). Semi-supervised learning with max-margin graph cuts. In Proceedings of the 13th international conference on artificial intelligence and statistics (pp. 421–428).
Laine, S., & Aila, T. (2017). Temporal ensembling for semi-supervised learning. In International conference on learning, representations.
Lange, T., Law, M. H., Jain, A. K., & Buhmann, J. M. (2005). Learning with constrained and unlabelled data. In Proceedings of the 2005 IEEE conference on computer vision and pattern recognition (Vol. 1, pp. 731–738). IEEE.
Lawrence, N. D., & Jordan, M. I. (2005). Semi-supervised learning via Gaussian processes. In Advances in neural information processing systems (pp. 753–760).
LeCun, Y., Bengio, Y., & Hinton, G. (2015). Deep learning. Nature, 521(7553), 436.
Lee, D. H. (2013). Pseudo-label: The simple and efficient semi-supervised learning method for deep neural networks. In Proceedings of the 30th ICML workshop on challenges in representation learning (Vol. 3, p. 2).
Leistner, C., Saffari, A., Santner, J., Bischof, H. (2009). Semi-supervised random forests. In Proceedings of the IEEE 12th international conference on computer vision (pp. 506–513). IEEE.
Levatić, J., Ceci, M., Kocev, D., & Džeroski, S. (2017). Semi-supervised classification trees. Journal of Intelligent Information Systems, 49(3), 461–486.
Li, C., Xu, K., Zhu, J., & Zhang, B. (2017). Triple generative adversarial nets. arXiv:1703.02291.
Li, M., & Zhou, Z. H. (2007). Improve computer-aided diagnosis with machine learning techniques using undiagnosed samples. IEEE Transactions on Systems, Man, and Cybernetics—Part A: Systems and Humans, 37(6), 1088–1098.
Li, S., & Fu, Y. (2013). Low-rank coding with b-matching constraint for semi-supervised classification. In Proceedings of the 23rd international joint conference on artificial intelligence (pp. 1472–1478).
Li, S., & Fu, Y. (2015). Learning balanced and unbalanced graphs via low-rank coding. IEEE Transactions on Knowledge and Data Engineering, 27(5), 1274–1287.
Li, Y. F., & Zhou, Z. H. (2015). Towards making unlabeled data never hurt. IEEE Transactions on Pattern Analysis and Machine Intelligence, 37(1), 175–188.
Liu, B., Lee, W. S., Yu, P. S., & Li, X. (2002). Partially supervised classification of text documents. In Proceedings of the 19th international conference on machine learning (Vol. 2, pp. 387–394).
Liu, G., Lin, Z., & Yu, Y. (2010a). Robust subspace segmentation by low-rank representation. In Proceedings of the 27th international conference on machine learning (pp. 663–670).
Liu, W., & Chang, S. F. (2009). Robust multi-class transductive learning with graphs. In Proceedings of the 2009 IEEE conference on computer vision and pattern recognition (pp. 381–388). IEEE.
Liu, W., He, J., & Chang, S. F. (2010b). Large graph construction for scalable semi-supervised learning. In Proceedings of the 27th international conference on machine learning (pp. 679–686).
Liu, X., Song, M., Tao, D., Liu, Z., Zhang, L., Chen, C., & Bu, J. (2013). Semi-supervised node splitting for random forest construction. In Proceedings of the 2013 IEEE conference on computer vision and pattern recognition (pp. 492–499). IEEE.
Liu, W., Wang, J., & Chang, S. F. (2012). Robust and scalable graph-based semisupervised learning. Proceedings of the IEEE, 100(9), 2624–2638.
Liu, X., Song, M., Tao, D., Liu, Z., Zhang, L., Chen, C., et al. (2015). Random forest construction with robust semisupervised node splitting. IEEE Transactions on Image Processing, 24(1), 471–483.
Lu, Q., Getoor, L. (2003). Link-based classification. In Proceedings of the 20th international conference on machine learning (pp. 496–503).
Luo, Y., Zhu, J., Li, M., Ren, Y., & Zhang, B. (2018). Smooth neighbors on teacher graphs for semi-supervised learning. In Proceedings of the IEEE conference on computer vision and pattern recognition (pp. 8896–8905).
Maier, M., Luxburg, U. V., & Hein, M. (2009). Influence of graph construction on graph-based clustering measures. In Advances in neural information processing systems (pp. 1025–1032).
Mallapragada, P. K., Jin, R., Jain, A. K., & Liu, Y. (2009). Semiboost: Boosting for semi-supervised learning. IEEE Transactions on Pattern Analysis and Machine Intelligence, 31(11), 2000–2014.
Melacci, S., & Belkin, M. (2011). Laplacian support vector machines trained in the primal. Journal of Machine Learning Research, 12, 1149–1184.
Mihalcea, R. (2004). Co-training and self-training for word sense disambiguation. In Proceedings of the 8th conference on computational natural language learning.
Mikolov, T., Sutskever, I., Chen, K., Corrado, G. S., & Dean, J. (2013) Distributed representations of words and phrases and their compositionality. In Advances in neural information processing systems (pp. 3111–3119).
Miyato, T., Maeda, S. I., Koyama, M., & Ishii, S. (2018). Virtual adversarial training: A regularization method for supervised and semi-supervised learning. IEEE Transactions on Pattern Analysis and Machine Intelligence, 41(8), 1979–1993.
Netzer, Y., Wang, T., Coates, A., Bissacco, A., Wu, B., & Ng, A.Y. (2011). Reading digits in natural images with unsupervised feature learning. In NIPS workshop on deep learning and unsupervised feature learning.
Neville, J., & Jensen, D. (2000). Iterative classification in relational data. In Proceedings of the 17th AAAI workshop on learning statistical models from relational data (pp. 13–20).
Nigam, K., & Ghani, R. (2000). Analyzing the effectiveness and applicability of co-training. In Proceedings of the 9th international conference on information and knowledge management (pp. 86–93). ACM.
Nigam, K., McCallum, A., Mitchell, T. (2006). Semi-supervised text classification using EM. In Semi-Supervised Learning (pp. 33–56).
Nigam, K., McCallum, A. K., Thrun, S., & Mitchell, T. (2000). Text classification from labeled and unlabeled documents using EM. Machine Learning, 39(2), 103–134.
Niyogi, P. (2008). Manifold regularization and semi-supervised learning: Some theoretical analyses. Journal of Machine Learning Research, 14(1), 1229–1250.
Odena, A. (2016). Semi-supervised learning with generative adversarial networks. arXiv:1606.01583.
Oliver, A., Odena, A., Raffel, C., Cubuk, E. D., Goodfellow, I. J. (2018). Realistic evaluation of deep semi-supervised learning algorithms. arXiv:1804.09170.
Oshiro, T. M., Perez, P. S., & Baranauskas, J. A. (2012). How many trees in a random forest? In Proceedings of the international workshop on machine learning and data mining in pattern recognition (pp. 154–168). Springer.
Pang, B., & Lee, L. (2004). A sentimental education: Sentiment analysis using subjectivity summarization based on minimum cuts. In Proceedings of the 42nd annual meeting on association for computational linguistics, association for computational linguistics (p. 271).
Park, S., Park, J., Shin, S., & Moon, I. (2018). Adversarial dropout for supervised and semi-supervised learning. In Proceedings of the thirty-second AAAI conference on artificial intelligence (pp. 3917–3924).
Paszke, A., Gross, S., Chintala, S., Chanan, G., Yang, E., DeVito, Z., Lin, Z., Desmaison, A., Antiga, L., & Lerer, A. (2017). Automatic differentiation in pytorch. In NIPS Autodiff workshop.
Pedregosa, F., Varoquaux, G., Gramfort, A., Michel, V., Thirion, B., Grisel, O., et al. (2011). Scikit-learn: Machine learning in python. Journal of Machine Learning Research, 12, 2825–2830.
Perozzi, B., Al-Rfou, R., & Skiena, S. (2014). Deepwalk: Online learning of social representations. In Proceedings of the 20th ACM SIGKDD international conference on knowledge discovery and data mining (pp. 701–710). ACM.
Pezeshki, M., Fan, L., Brakel, P., Courville, A., & Bengio, Y. (2016). Deconstructing the ladder network architecture. In Proceedings of the 33rd international conference on machine learning (pp. 2368–2376).
Pitelis, N., Russell, C., & Agapito, L. (2013). Learning a manifold as an atlas. In Proceedings of the 2013 IEEE conference on computer vision and pattern recognition (pp. 1642–1649). IEEE.
Pitelis, N., Russell, C., & Agapito, L. (2014). Semi-supervised learning using an unsupervised atlas. In Proceedings of the joint European conference on machine learning and knowledge discovery in databases (pp. 565–580). Springer.
Prémont-Schwarz, I., Ilin, A., Hao, T., Rasmus, A., Boney, R., & Valpola, H. (2017). Recurrent ladder networks. In: I. Guyon, U. V. Luxburg, S. Bengio, H. Wallach, R. Fergus, S. Vishwanathan, R. Garnett (eds.), Advances in neural information processing systems (pp. 6009–6019).
Provost, F., & Domingos, P. (2003). Tree induction for probability-based ranking. Machine Learning, 52(3), 199–215.
Qi, Z., Tian, Y., & Shi, Y. (2012). Laplacian twin support vector machine for semi-supervised classification. Neural Networks, 35, 46–53.
Rasmus, A., Berglund, M., Honkala, M., Valpola, H., & Raiko, T. (2015). Semi-supervised learning with ladder networks. In Advances in neural information processing systems (pp. 3546–3554).
Ratle, F., Camps-Valls, G., & Weston, J. (2010). Semisupervised neural networks for efficient hyperspectral image classification. IEEE Transactions on Geoscience and Remote Sensing, 48(5), 2271–2282.
Rifai, S., Dauphin, Y. N., Vincent, P., Bengio, Y., & Muller, X. (2011a). The manifold tangent classifier. In Advances in neural information processing systems (pp. 2294–2302).
Rifai, S., Vincent, P., Muller, X., Glorot, X., & Bengio, Y. (2011b). Contractive auto-encoders: Explicit invariance during feature extraction. In Proceedings of the 28th international conference on machine learning (pp. 833–840).
Rosenberg, C., Hebert, M., & Schneiderman, H. (2005). Semi-supervised self-training of object detection models. In Proceedings of the 7th IEEE workshop on applications of computer vision (pp. 29–36).
Roweis, S. T., & Saul, L. K. (2000). Nonlinear dimensionality reduction by locally linear embedding. Science, 290(5500), 2323–2326.
Sajjadi, M., Javanmardi, M., & Tasdizen, T. (2016). Regularization with stochastic transformations and perturbations for deep semi-supervised learning. In Advances in neural information processing systems (pp. 1163–1171).
Salimans, T., Goodfellow, I., Zaremba, W., Cheung, V., Radford, A., & Chen, X. (2016). Improved techniques for training gans. In Advances in neural information processing systems (pp. 2234–2242).
Sen, P., Namata, G., Bilgic, M., Getoor, L., Galligher, B., & Eliassi-Rad, T. (2008). Collective classification in network data. AI Magazine, 29(3), 93.
Settles, B. (2012). Active learning. Synthesis Lectures on Artificial Intelligence and Machine Learning, 6(1), 1–114.
Sheikhpour, R., Sarram, M. A., Gharaghani, S., & Chahooki, M. A. Z. (2017). A survey on semi-supervised feature selection methods. Pattern Recognition, 64, 141–158.
Shental, N., & Domany, E. (2005). Semi-supervised learning—A statistical physics approach. In Proceedings of the 22nd ICML workshop on learning with partially classified training data.
Sindhwani, V., Niyogi, P., & Belkin, M. (2005). A co-regularization approach to semi-supervised learning with multiple views. In Proceedings of the 22nd ICML workshop on learning with multiple views (pp. 74–79).
Sindhwani, V., & Rosenberg, D. S. (2008). An RKHS for multi-view learning and manifold co-regularization. In Proceedings of the 25th international conference on machine learning (pp. 976–983).
Singh, A., Nowak, R., & Zhu, X. (2009) Unlabeled data: Now it helps, now it doesn’t. In Advances in neural information processing systems (pp. 1513–1520).
Solomon, J., Rustamov, R., Guibas, L., & Butscher, A. (2014) Wasserstein propagation for semi-supervised learning. In Proceedings of the 31st international conference on machine learning (pp. 306–314).
Springenberg, J. T. (2015). Unsupervised and semi-supervised learning with categorical generative adversarial networks. arXiv:1511.06390.
Srivastava, N., Hinton, G. E., Krizhevsky, A., Sutskever, I., & Salakhutdinov, R. (2014). Dropout: a simple way to prevent neural networks from overfitting. Journal of Machine Learning Research, 15(1), 1929–1958.
Subramanya, A., & Bilmes, J. (2008). Soft-supervised learning for text classification. In Proceedings of the conference on empirical methods in natural language processing, association for computational linguistics (pp. 1090–1099).
Subramanya, A., & Bilmes, J. (2011). Semi-supervised learning with measure propagation. Journal of Machine Learning Research, 12, 3311–3370.
Subramanya, A., & Talukdar, P. P. (2014). Graph-based semi-supervised learning. Synthesis Lectures on Artificial Intelligence and Machine Learning, 8(4), 1–125.
Szegedy, C., Zaremba, W., Sutskever, I., Bruna, J., Erhan, D., Goodfellow, I., et al. (2013). Intriguing properties of neural networks. arXiv:1312.6199.
Szummer, M., & Jaakkola, T. (2002) Partially labeled classification with Markov random walks. In Advances in neural information processing systems (pp. 945–952).
Szummer, M., & Jaakkola, T. S. (2003) Information regularization with partially labeled data. In Advances in neural information processing systems (pp. 1049–1056).
Talukdar, P. P., & Crammer, K. (2009). New regularized algorithms for transductive learning. In Proceedings of the joint European conference on machine learning and knowledge discovery in databases (pp. 442–457). Springer.
Talukdar, P. P., Reisinger, J., Paşca, M., Ravichandran, D., Bhagat, R., & Pereira, F. (2008). Weakly-supervised acquisition of labeled class instances using graph random walks. In Proceedings of the conference on empirical methods in natural language processing, association for computational linguistics (pp. 582–590).
Tan, C., Lee, L., Tang, J., Jiang, L., Zhou, M., & Li, P. (2011). User-level sentiment analysis incorporating social networks. In Proceedings of the 17th ACM SIGKDD international conference on knowledge discovery and data mining (pp. 1397–1405). ACM.
Tang, J., Qu, M., Wang, M., Zhang, M., Yan, J., & Mei, Q. (2015). Line: Large-scale information network embedding. In Proceedings of the 24th international conference on world wide web, international world wide web conferences steering committee (pp. 1067–1077).
Tanha, J., van Someren, M., & Afsarmanesh, H. (2012). An adaboost algorithm for multiclass semi-supervised learning. In Proceedings of the 12th IEEE international conference on data mining (pp. 1116–1121). IEEE.
Tanha, J., van Someren, M., & Afsarmanesh, H. (2017). Semi-supervised self-training for decision tree classifiers. International Journal of Machine Learning and Cybernetics, 8(1), 355–370.
Tarvainen, A., & Valpola, H. (2017) Weight-averaged consistency targets improve semi-supervised deep learning results. In Advances in neural information processing systems (pp. 1195–1204).
Thornton, C., Hutter, F., Hoos, H. H., & Leyton-Brown, K. (2013) Auto-weka: Combined selection and hyperparameter optimization of classification algorithms. In Proceedings of the 19th ACM SIGKDD international conference on knowledge discovery and data mining (pp. 847–855). ACM.
Triguero, I., García, S., & Herrera, F. (2015). Self-labeled techniques for semi-supervised learning: Taxonomy, software and empirical study. Knowledge and Information Systems, 42(2), 245–284.
Triguero, I., González, S., Moyano, J. M., García López, S., Alcalá Fernández, J., Luengo Martín, J., et al. (2017). KEEL 3.0: An open source software for multi-stage analysis in data mining. International Journal of Computational Intelligence Systems, 10, 1238–1249.
Urner, R., Ben-David, S., & Shalev-Shwartz, S. (2011). Access to unlabeled data can speed up prediction time. In Proceedings of the 27th international conference on machine learning (pp. 641–648).
Valizadegan, H., Jin, R., & Jain, A. K. (2008). Semi-supervised boosting for multi-class classification. In Joint European conference on machine learning and knowledge discovery in databases (pp. 522–537). Springer.
Vapnik, V. (1998). Statistical learning theory (Vol. 1). New York: Wiley.
Verma, V., Lamb, A., Kannala, J., Bengio, Y., & Lopez-Paz, D. (2019). Interpolation consistency training for semi-supervised learning. arXiv:1903.03825.
Vincent, P., Larochelle, H., Bengio, Y., Manzagol, P. A. (2008). Extracting and composing robust features with denoising autoencoders. In Proceedings of the 25th international conference on machine learning (pp. 1096–1103).
Wager, S., Wang, S., & Liang, P. S. (2013). Dropout training as adaptive regularization. In Advances in neural information processing systems (pp. 351–359).
Wan, X. (2009). Co-training for cross-lingual sentiment classification. In Proceedings of the 47th annual meeting of the ACL, association for computational linguistics (pp. 235–243).
Wang, D., Cui, P., Zhu, W. (2016). Structural deep network embedding. In Proceedings of the 22nd ACM SIGKDD international conference on knowledge discovery and data mining (pp. 1225–1234). ACM.
Wang, F., & Zhang, C. (2008). Label propagation through linear neighborhoods. IEEE Transactions on Knowledge and Data Engineering, 20(1), 55–67.
Wang, J., Jebara, T., & Chang, S. F. (2008a). Graph transduction via alternating minimization. In Proceedings of the 25th international conference on machine learning (pp. 1144–1151).
Wang, J., Jebara, T., & Chang, S. F. (2013). Semi-supervised learning using greedy max-cut. Journal of Machine Learning Research, 14, 771–800.
Wang, J., Luo, S. W., & Zeng. X. H. (2008b). A random subspace method for co-training. In Proceedings of the IEEE international joint conference on neural networks (pp. 195–200). IEEE.
Wang, W., & Zhou, Z. H. (2007). Analyzing co-training style algorithms. In Proceedings of the 18th European conference on machine learning (pp. 454–465). Springer.
Wang, W., Zhou, Z. H. (2010). A new analysis of co-training. In Proceedings of the 27th international conference on machine learning (pp. 1135–1142).
Weston, J., Ratle, F., & Collobert, R. (2008). Deep learning via semi-supervised embedding. In Proceedings of the 25th international conference on machine learning (pp. 1168–1175).
Wold, S., Esbensen, K., & Geladi, P. (1987). Principal component analysis. Chemometrics and Intelligent Laboratory Systems, 2(1–3), 37–52.
Wright, J., Yang, A. Y., Ganesh, A., Sastry, S. S., & Ma, Y. (2009). Robust face recognition via sparse representation. IEEE Transactions on Pattern Analysis and Machine Intelligence, 31(2), 210–227.
Wu, X. M., Li, Z., So, A. M., Wright, J., & Chang, S. F. (2012a). Learning with partially absorbing random walks. In Advances in neural information processing systems (pp. 3077–3085).
Wu, Z., Wu, J., Cao, J., & Tao, D. (2012b). Hysad: A semi-supervised hybrid shilling attack detector for trustworthy product recommendation. In Proceedings of the 18th ACM SIGKDD international conference on knowledge discovery and data mining (pp. 985–993). ACM.
Xu, C., Tao, D., & Xu, C. (2013). A survey on multi-view learning. arXiv:1304.5634.
Xu, J., He, H., & Man, H. (2012). Dcpe co-training for classification. Neurocomputing, 86, 75–85.
Xu, L., & Schuurmans, D. (2005) Unsupervised and semi-supervised multi-class support vector machines. In Proceedings of the 20th national conference on artificial intelligence (Vol. 5, p. 13).
Yan, S., & Wang, H. (2009). Semi-supervised learning by sparse representation. In Proceedings of the 2009 SIAM international conference on data mining (pp. 792–801). SIAM.
Yang, Z., Cohen, W. W., & Salakhutdinov, R. (2016) Revisiting semi-supervised learning with graph embeddings. In Proceedings of the 33rd international conference on machine learning (pp. 40–48).
Yarowsky, D. (1995). Unsupervised word sense disambiguation rivaling supervised methods. In Proceedings of the 33rd annual meeting of the association for computational linguistics, association for computational linguistics (pp. 189–196).
Yaslan, Y., & Cataltepe, Z. (2010). Co-training with relevant random subspaces. Neurocomputing, 73(10), 1652–1661.
Yu, S., Krishnapuram, B., Rosales, R., & Rao, R. B. (2011). Bayesian co-training. Journal of Machine Learning Research, 12, 2649–2680.
Zhang, H., Cisse, M., Dauphin, Y. N., & Lopez-Paz, D. (2018). mixup: Beyond empirical risk minimization. In International conference on learning representations.
Zhang, K., Kwok, J. T., & Parvin, B. (2009). Prototype vector machine for large scale semi-supervised learning. In Proceedings of the 26th international conference on machine learning (pp. 1233–1240).
Zhang, W., & Zheng, Q. (2009). Tsfs: A novel algorithm for single view co-training. In Proceedings of the 2nd IEEE international joint conference on computational sciences and optimization (Vol. 1, pp. 492–496). IEEE.
Zhou, D., Bousquet, O., Lal, T. N., Weston, J., & Schölkopf, B. (2004). Learning with local and global consistency. In Advances in Neural Information Processing Systems (pp. 321–328).
Zhou, Y., & Goldman, S. (2004) Democratic co-learning. In Proceedings of the 16th IEEE international conference on tools with artificial intelligence (pp. 594–602). IEEE.
Zhou, Z. H. (2012). Ensemble methods: Foundations and algorithms. Boca Raton: CRC Press.
Zhou, Z. H., & Li, M. (2005a) Semi-supervised regression with co-training. In Proceedings of the 19th international joint conference on artificial intelligence (Vol. 5, pp. 908–913).
Zhou, Z. H., & Li, M. (2005b). Tri-training: Exploiting unlabeled data using three classifiers. IEEE Transactions on Knowledge and Data Engineering, 17(11), 1529–1541.
Zhou, Z. H., & Li, M. (2010). Semi-supervised learning by disagreement. Knowledge and Information Systems, 24(3), 415–439.
Zhu, X. (2005). Semi-supervised learning with graphs. Ph.D. thesis, Carnegie Mellon University.
Zhu, X. (2008). Semi-supervised learning literature survey. Technical Report. 1530, University of Wisconsin-Madison.
Zhu, X., & Ghahramani, Z. (2002a). Learning from labeled and unlabeled data with label propagation. Technical Report. CMU-CALD-02-107, Carnegie Mellon University.
Zhu, X., & Ghahramani, Z. (2002b) Towards semi-supervised classification with Markov random fields. Technival Report. CMU-CALD-02-106, Carnegie Mellon University.
Zhu, X., Ghahramani, Z., & Lafferty, J. D. (2003) Semi-supervised learning using Gaussian fields and harmonic functions. In Proceedings of the 20th international conference on machine learning (pp. 912–919).
Zhu, X., & Goldberg, A. B. (2009). Introduction to semi-supervised learning. Synthesis Lectures on Artificial Intelligence and Machine Learning, 3(1), 1–130.
Zhu, X., & Lafferty, J. (2005). Harmonic mixtures: Combining mixture models and graph-based methods for inductive and scalable semi-supervised learning. In Proceedings of the 22nd international conference on machine learning (pp. 1052–1059). ACM.
Zhuang, L., Gao, H., Lin, Z., Ma, Y., Zhang, X., & Yu, N. (2012) Non-negative low rank and sparse graph for semi-supervised learning. In Proceedings of the 2012 IEEE conference on computer vision and pattern recognition (pp. 2328–2335). IEEE.
Acknowledgements
We thank Matthijs van Leeuwen for his valuable feedback on drafts of this article.
Author information
Authors and Affiliations
Corresponding author
Ethics declarations
Conflict of interest
The authors declare that they have no conflict of interest.
Additional information
Publisher's Note
Springer Nature remains neutral with regard to jurisdictional claims in published maps and institutional affiliations.
Editor: Tom Fawcett.
Rights and permissions
Open Access This article is distributed under the terms of the Creative Commons Attribution 4.0 International License (http://creativecommons.org/licenses/by/4.0/), which permits unrestricted use, distribution, and reproduction in any medium, provided you give appropriate credit to the original author(s) and the source, provide a link to the Creative Commons license, and indicate if changes were made.
About this article

Cite this article
van Engelen, J.E., Hoos, H.H. A survey on semi-supervised learning. Mach Learn 109, 373–440 (2020). https://doi.org/10.1007/s10994-019-05855-6
Received:
Revised:
Accepted:
Published:
Issue Date:
DOI: https://doi.org/10.1007/s10994-019-05855-6