
Abstract
Nowadays, aerogel materials are some of the lightest thermal insulation materials available on the construction market; they are produced by the mixing of polymers with solvents since they create a gel. Insulated fibrous-enhanced forms are the most frequently used ones. The type, which is used for thermal insulation, is usually produced by mixing the glass fiber net with the liquid–solid solution. The present paper talks about the structural modifications caused by heat treatment of the aerogel-reinforced with fiberglass. The aerogel probes were subjected to thermal annealing, and once they got isothermal heat treatments for weeks at 70 °C, moreover, untreated samples were subjected to stepwise thermal treatments between 100 and 250 °C for 1 day. Both the heat treatments were executed in dryer equipment under atmospheric air. Changes both in the structure and in chemical bonds of the untreated and annealed samples were followed. Raman spectra have been obtained for the samples. The structural changes have an influence on the studied material as well as in thermal properties. The structural and thermal properties were put under investigation after executing heat treatments on them. Jumps in the thermal conductivity could be connected with some structural changes. Due to the annealing intensity of the peaks connected with Si–O, crystalline SiO is increased, while CH, CH2, CH3, –OH and others are decreased.
Introduction
A possibility to moderate the applied energy of buildings and to reduce the emission of both CO2 and other greenhouse gases is to apply building or pipe insulations. Nowadays, the use of advanced insulation materials is truly widespread. The development of advanced or the so-called super insulation materials points to reach energy, since money savings, and it is an important focus point in the building sector [1,2,3,4]. Aerogels, pyrogels and cryogels are a special class of materials having nanostructure with very low density and very high porosity, having tuneable physicochemical behavior. Silica aerogels are open cell, mesoporous materials and have reasonable thermal conductivity (λ ≈ 0.017 W/mK) [5]. They have very good properties like low dielectric constant, low density, low speed of sound as well as high porosity. Besides the vacuum insulation panels, aerogel materials are said to be the most promising thermal insulations. It was presented in several articles that either the fibrous or the transparent and the translucent types are some of the most state-of-the-art and reasonable heat insulators. They are produced from gels by supercritical, ambient or cryogenic drying. They are manufactured most widely from silica alcogels, most often prepared from silica gel [6,7,8,9,10,11]. The thermal stability is an important parameter, which should be studied for these materials. In the last decade, numerous (hundreds of) papers presented that aerogel could be the most promising building or pipe insulation material, with possible applications in the industrial sector, too. Fibrous insulations with high melting point, e.g., mineral wool, rock wool as well fiberglass-reinforced aerogel, can be used not only for insulating building walls but for the insulation of pipes furnaces or chimney. Therefore, they have to stand at higher temperatures. Ng and his colleagues reported the alterations in the aerogel-incorporated mortar caused by curing at raised temperatures [12]. The investigations of the temperature-induced changes in the insulation materials are very important. Heat treatment of a sample as thermal aging procedure is a term that refers to the tendency of insulation materials losing the thermal resistance over time. It was reported that this degradation is mainly caused by the outgassing of the filling gas, having very low thermal conductivity, from the cells through a very slow diffusion. These pores could be filled by air having relatively higher thermal conductivity. Since thermal aging is so frequently used as a dispute for or against insulations, it is very important to understand this somewhat complex phenomenon. One of the most important parameters for insulation materials for industrial applications is the longtime stability of material properties or knowledge about the change of properties in time, which can be simulated by thermal annealing. Jedediah and colleagues observed the following after annealing: Aerogel blankets suffered a change in their thermal insulation capability with a detectable change in density and in geometry. This change in size and in the density is affected by temperature, which could be broken by chemical changes [13]. Other researchers presented changes in the properties of aerogel samples after annealing. The changes were followed by different types of equipment used in materials engineering. It is exactly shown in Ref [14,15,16] that measurements with scanning electron microscope (SEM) completed with element analysis could provide indispensable information both from the structures and from the contaminants. After heat treating the samples, the study of the evolution of the structure on the nano- or the microscale is vital. Furthermore, reflectional tests with an X-ray diffractometer (XRD) in order to find the changes in the crystal structure should be carried out. The authors presented results with XRD apparatus [17, 18]. Other authors presented important information from heat-treated samples by using differential scanning calorimetry (DSC). Moreover, the application of optical microscope and executing humidity test in a climatic chamber is also necessary to know the physical behavior of the samples [19,20,21,22]. The tested aerogel material contains not only silica, but different organic groups as methyl, OH and carbon. It was shown earlier that due to heat treatments structural changes can happen, which could lead to loss the thermal stability and increase their thermal conductivity [23]. First of all, it could be connected with the poor thermal stability of methyl groups [24]. The heat also has influence on the secondary particle structure—under 527 °C—the expansion of the secondary particles can be observed parallel with the increasing temperature [25]. At higher temperatures, crystallization and densification could take place with decreasing of the mesopores amount, while macropores show an increasing trend [26]. Besides, it was shown that due to the heat treatment a crystalline phase growth in the silica aerogel samples can be expected [6]. However, it is not completely clear, how the structural changes could influence the thermal stability and the thermal insulation capability of these types of materials; therefore, executions of laboratory experiments are very important. In this work, aerogel samples were heat-treated at different temperatures, and the structural changes were established by Raman microscope. The connection between the experimental results is also discussed in order to have more information from the long-term performance of aerogel super insulation material as an efficient solution for reducing the energy use of buildings.
Experimental
Properties of the tested material
This is an amorphous SiO2 aerogel embedded in a glass net. In our previous works, the properties are well highlighted, but due to the nature of the paper what is the presentation of the analysis of the chemical contaminants and chemical bonds we should highlight the main declared components [4, 6, 23]. As the declaration file of the manufacturer, this material contains approximately 40–50% of amorphous SiO2, about 10–20% methylsilylated silica, polyethylene terephthalate (PET) and fibrous glass (textile grade) each, while in scattered form 0 to 5% magnesium oxide and synthetic graphite [27].
Effects of the heat treatment
Two different heat treating rows were executed on the samples. Type T1) isothermal heat treatments at a fixed temperature (70 °C) from 1 to 42 days (6 weeks) and Type T2) stepwise (isochronal) heat treatment was executed. In this case, the temperature in the dryer was varied between 70 °C and 210 °C with about 30–50 °C steps for 1 day. After both experimental series, different types of equipment were used to reveal any changes [6, 23]. The results presented in this paper are a continuation of previously published research; therefore, it is indispensable to highlight those results. In recent papers in Ref [4, 6, 23], different experiments were executed on aerogel samples after thermal annealing. It was showed that thermal aging (heat treatment) has significant consequences both in the material and in the thermal properties. Structural modifications were detected by registering the sorption isotherms, where we deduced the changes through the modifications in the shape of the curves, see Ref [23]. Through SEM images, increase in the grain size was revealed. Dehydration and crystallization were also depicted by XR and DSC. Furthermore, the separation of the grains from the fibers was manifested, too. With a heat flow meter, we were able to detect the temperature-induced changes in the thermal conductivity.
Measurement of the structure via Raman microscopy
The structure of the samples was investigated via Horiba Labram nano-microscope, with a green laser diode, in which operation wavelength was 532 nm, with a cooled CCD detector and a grating with 1800 lines/mm. The spectra were taken from the samples by a 20× objective, which resulted in a focused laser spot reached on the surface; furthermore, laser power was about 1.5 mW/cm2. The Raman spectra were recorded with a slit width of 200 µm, the acquisition time was 15 s, while the number of the accumulation was 5, which results in a better signal-to-noise ratio. The Raman microscope was previously calibrated, and the automatic offset correction was performed. The measured spectra were analyzed by the spectroscopic suite LabSpec 6. The accuracy of the peak positions is estimated to be at least ± 1.5 cm−1.
Results and discussion
To confirm the structural changes caused by heat treatment, Raman spectra were taken from both the as-deposited and the annealed samples. The full Raman spectra are presented in Fig. 1 and reveal important new data belonging to the structural changes of the tested sample. Through a Raman spectrum, counts were recorded between 250 and 3600 1/cm wavenumbers. For clearness, the whole spectra were separated into five parts with different wavenumber intervals, like the following:

Full Raman spectra
-
Figure 2 presents the wavenumber interval from 200 to 600 cm−1;
Fig. 2 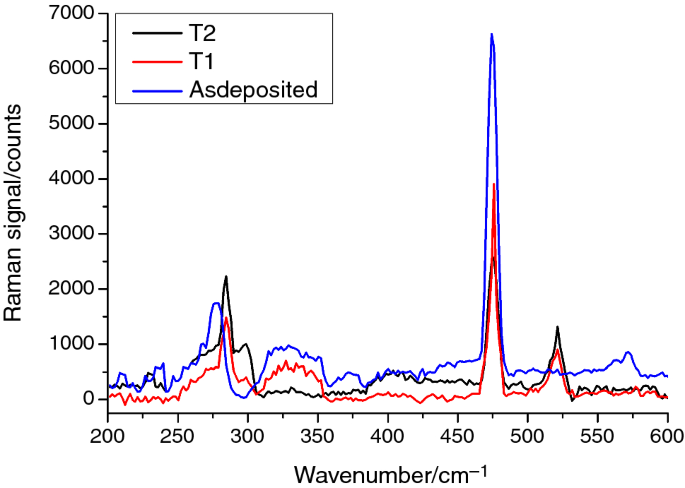
Raman spectra from 200 to 600 (1/cm)
-
Figure 3 belongs to the wavenumber interval 600 to 1050 cm−1;
Fig. 3 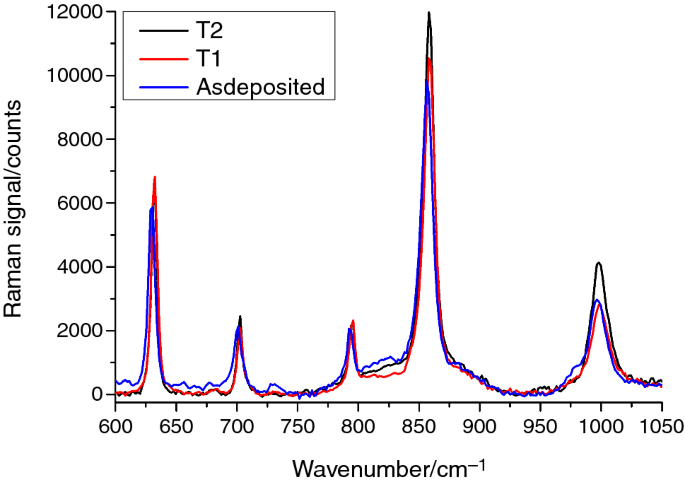
Raman spectra from 600 to 1050 (1/cm)
-
The signals between 1050 and 1500 are highlighted in Fig. 4;
Fig. 4 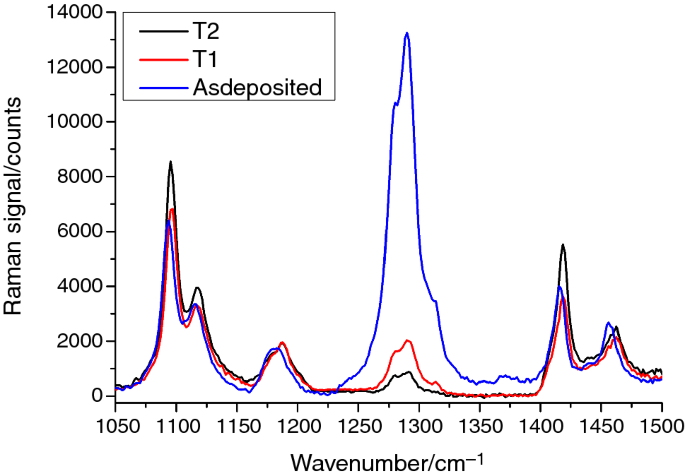
Raman spectra from 1050 to 1500 (1/cm)
-
Ranges 1500–1900 and 1900–3450 are represented in Figs. 5 and 6, respectively.
Fig. 5 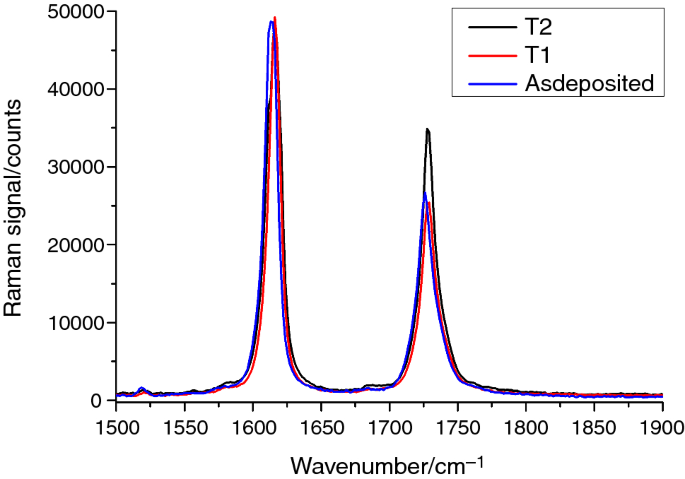
Raman spectra from 1500 to 1900 (cm−1)
Fig. 6 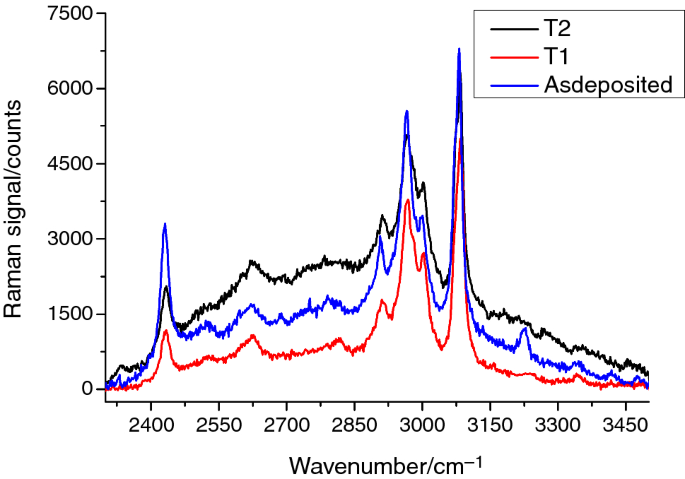
Raman spectra from 1900 to 3450 (cm−1)


It was shown that due to annealing the intensities of the peaks connected with C–O, Si–O and O–Si–O are increased, which is connected with the oxidation process in the studied samples. Besides, some new peaks could be seen on the Raman spectra, which are connected with the micro- or/and nanocrystalline phase of silicon, and this is in a good agreement with our previous XRD measurements [23]. Other peak’s intensity is decreased or even disappeared, which belongs to the organic groups (methyl groups, CH, C–O, C–N, S–H, CH2, CH3, –CL, COOH vibration bands) to the OH groups and to the Mg–OH clusters as well as to the amorphous phase of silicon. However, the intensity of some peaks did not change or only it was a slight change, belonging to the basic structural units of the silica aerogel.
According to previous studies, the bending vibration of methyl groups is disappeared above 400 °C. Below this temperature, the peaks became not as pronounced in comparison with the untreated samples [28]. It could be seen in this case as well. The peaks attributed to the stretching vibrations of the –OH roots are also decreasing. The weak peaks in Figs. 3 and 4 by 850 and 1465 cm−1 originate from silicon versus OCH3 stretching as well as from CH3 distortions, correspondingly. In addition, the strength of the weak signal at 980 cm−1 is due to Si with OH-stretching and it is reduced. The 1465 cm−1 peak due to the CH3 deformation is also decreased. The intensity of another peak at the 478 cm−1 has been decreased, but definitely not disappeared. It can be connected with the eight-membered (4-SiO) surface rings, which are clearly broken down upon annealing in air. As a result, the intensity of this peak is decreased. Parallel to this, the intensity of the signals Si–O–Si increasing as well. In the Raman spectra of the unannealed samples, a low wide OH-stretching contour at 3230 cm−1 can be seen. The intensity of this peak also decreased after annealing. Also, the peaks by 237, 845 and 980 cm−1 could be connected to OH bonds in the structure, which weakened by the heat treatment, but not eliminated.
The data highlighted in Table 1 clearly show the structural changes which might cause the difference in the lambda value of the untreated and annealed samples. So all these changes have an influence on the structure, which became more periodical, as the ratio of the crystalline phase part increased in comparison with amorphous one. Furthermore, the intensity of organic, methyl groups and Si–C bonds also changed and decreased. We can state that these are the elementary structural parts of the aerogel sample. And of course, the amount of OH and water decreased during the annealing. These structural changes could lead to an increase in the pore sizes, while the specific surface area decreases as a result of thermal annealing, as it was shown previously [28]. The as-deposited silica aerogel sample has a highly porous and homogeneous structure, which changed due to heat treatment by modifying the band structure of the sample, a great amount of secondary particles could be combined and the uniform pore structure could be ruined. The intensity of the peaks connected with carbon also fell down after annealing, while the intensity of the peaks connected with the contents of Si and O showed growth at similar conditions, which was consistent with other research as well [28, 62].
So, it could be supposed that the quantity of Si in the tested probes remained constant, and the content of the O is increased; moreover, the carbon decreased during the heat treatment. As the annealing was done under atmospheric air conditions, oxidization reactions occurred as a result –C–H connections in the methyl groups oxidized and formed to –C–OH groups. Furthermore, they are oxidized to CO2 and H2O, which released from the sample or linking to Si and forming Si–OH bonds in a certain amount. These bonds could condensate on the surface. In the end, the amount of carbon atoms in the structure of the studied silica aerogel would decrease, while the content of oxygen atom would increase. The untreated sample was in amorphous and non-crystalline phase, but as a result of annealing, some micro- and nanocrystalline phases were detected. These are in good agreement with our previous studies. This leads to a more periodical and compact structure and causes a greater thermal conductivity.
All the above-mentioned structural changes could be connected with the thermal insulation capability of the untreated and annealed probes. The lambda value of the samples was measured with a heat flow meter and is highlighted in Table 2. The thermal annealing leads to the changes to the microstructures, too. The structure became more periodical, and a less amount of methyl and OH groups exist in them. The bulk density decreased as a result of these structural changes. This could lead to the higher thermal conductivity of the heat-treated samples. The results of the Raman spectroscopy can be well harmonized with our previous results presented in Table 2.
It was presented earlier that after annealing the samples till 250 °C the thermal conductivity changes up to 0.02 W/mK while annealing at 70 °C for 6 weeks it remains constant. Moreover, the type of the sorption isotherms taken up either from the unannealed and from the annealed ones showed the difference. By using BET characteristics, changes in the shapes could indicate changes in the morphology, and in this case transition from type II to type IV. Moreover, for the T1-type thermal annealing the density remains constant while for T2-type annealing it decreases with about 2%. This could happen by the sample’s dehydration (decrease in the signal of the OH groups) and/or disappearance of the organic groups presented in Table 1. Images were taken both with optical and with scanning electron microscope, and for the annealed samples, they showed the separation of the grains from the fibers and their growth. But this process was much advanced for the samples cured through T2 annealing. The growth of nanocrystalline grains was manifested both with XRD and with Raman presented in Tables 1 and 2, resepectively. The signal of amorphous silica decreased, while the peak of crystalline silica appeared and increased. The growth of the grains can be further confirmed with the increasing specific heat capacity after annealing. Figure 7 presents the formed grains caused by thermal annealing. As a result of this, we can conclude that the thermal insulation capability should change, too.

An optical image from the annealed samples
Conclusions
Nowadays, silica aerogels are having adequate thermal insulation capability and they are frequently applied as thermal super insulations. Fibrous insulations are usually applied not only for wall, but it is used as pipe, furnace and chimney insulation, furthermore in industrial cases. Therefore, these materials have to stand higher temperatures, up to 300 °C. But higher temperatures should cause changes both in the structural and thermal properties of materials. Since, before the use of the materials, some experimental tests should be executed by laboratories in order to see the applicability limit. In this paper, we studied the effect of heat annealing as aging, through drying. We compared measurement results reached with Raman spectroscopy to results reached with other equipment used in materials testing. Silica aerogel samples were heat-treated under different temperatures and for different times at atmospheric air. As a result, we can further conclude that the start of the structural changing process for the sample annealed as T1 method is visible, while the changes for the sample annealed through T2 are advanced. In this paper, we pointed on the temperature-induced changes in the structures done with Raman spectroscopy, but now we would highlight only the most important ones:
-
1.
The amorphous silica peak decreases while the crystalline one appears increasing.
-
2.
Silica micro- and nanocrystals appear and grow.
-
3.
The peaks belonging both to the OH and to the organic groups are decreasing.
Our results showed that the exceptional characteristics of the fiber-reinforced aerogels have good application possibilities by using them as thermal insulators both in building and in the industrial sector, in this temperature range. Furthermore, we have to declare that building physics should be completed with experimental physics, in order to understand the processes and have clearer information from the long-term performance of thermal insulations.
References
Szodrai F, Lakatos Á. Kalmár, Analysis of the change of the specific heat loss coefficient of buildings resulted by the variation of the geometry and the moisture load. Energy. 2016;115:820–9.
Moga L, Moga I. Masonry thermal conductivity influence on thermal performance of a thermally insulate wall. J Appl Eng Sci. 2011;114(3):51–8.
Koci V, Madera J, Jerman M, Trnik A, Cerny R. Determination of the equivalent thermal conductivity of complex material systems with large-scale heterogeneities. Int J Therm Sci. 2014;86:365–73.
Berardi U, Lakatos Á. Thermal bridges of metal fasteners for aerogel-enhanced blankets. Energy Build. 2019;185(15):307–15.
Iswara S, Griffa M, Kaufmann R, Beltrand M, Hubera L, Brunner S, Lattuad M, Koebel MM, Malfait WJ. Effect of aging on thermal conductivity of fiber-reinforced aerogel composites: an X-ray tomography study. Microporous Mesoporous Mater. 2019;278:289–96.
Lakatos Á. Stability investigations of the thermal insulating performance of aerogel blanket. Energy Build. 2019;139:506–16.
Aegerter A, Leventis N, Koebel M, editors. Aerogels handbook. New York: Springer; 2011. p. 537–64.
Hostler SR, Abramson AR, Gawryla MD, Bandi SA, Schiraldi DA. Thermal conductivity of a clay-based aerogel. Int J Heat Mass Transfer. 2008;52:665–9.
Ibrahim M, Wurtz E, Biwole PH, Achard P, Salle H. Hygrothermal performance of exterior walls covered with aerogel-based insulating rendering. Energy Build. 2014;84:241–51.
Galliano R, Wakili KG, Stahl T, Binder B, Daniotti B. Performance evaluation of aerogel-based and perlite-based prototyped insulations for internal thermal retrofitting: HMT model validation by monitoring at demo scale. Energy Build. 2016;12:275–86.
Wakili KG, Stahl T, Heiduk E, Schuss M, Vonbank R, Pont U, Sustr C, Wolosiuk D, Mahdavi D. High performance aerogel containing plaster for historic buildings with structured Façades. Energy Proc. 2015;78:949–54.
Ng S, Jelle BP, Zhen Y, Wallevik O. Effect of storage and curing conditions at elevated temperatures on aerogel-incorporated mortar samples based on UHPC recipe. Constr Build Mater. 2016;106:640–9.
Alvey JB, Patel J, Stephenson LD. Experimental study on the effects of humidity and temperature onaerogel composite and foam insulations. Energy Build. 2017;144:358–71.
Miros, A. Thermal aging effect on thermal conductivity properties of mineral wool pipe samples at high temperature. In: Proceedings of the 3 Rome, Italy—June 8–10, 2017 Paper No. HTFF 172. ISSN: 2369-8136. https://doi.org/10.11159/htff17.172.
Yang X, Sun Y, Shi D, Liu J. Experimental investigation on mechanical properties of a fiber-reinforced silica aerogel composite. Mater Sci Eng, A. 2011;528:4830–6.
Chakraborty S, Pisal AA, Kothari VK, Rao AV. Synthesis and characterization of fibre reinforced silica, aerogel blankets for thermal. Adv Mater Sci Eng. 2016;2016:2495623. https://doi.org/10.1155/2016/2495623.
Li Z, Gong L, Cheng X, He S, Li C, Zhang H. Flexible silica aerogel composites strengthened with aramid fibers and their thermal behavior. Mater Des. 2016;99:349–55.
Shafi S, Navik R, Ding X, Zhao Y. Improved heat insulation and mechanical properties of silica aerogel/glass fiber composite by impregnating silica gel. J Non-Cryst Solids. 2019;503–504:78–83.
Zhu L, Wang Y, Cui S, Yang F, Nie Z, Li Q, Wei Q. Preparation of silica aerogels by ambient pressure drying without causing equipment corrosion. Molecules. 1935;2018:23. https://doi.org/10.3390/molecules23081935.
Zhou T, Gong L, Cheng X, Pan Y, Li C, Zhang H. Preparation and characterization of silica aerogels from by-product silicon tetrachloride under ambient pressure drying. J Non-Cryst Solids. 2018;499:387–93.
Hasan MA, Rashmi S, Esther ACM, Bhavanisankar PY, Sherikar B, Sridhara N, Dey A. Evaluations of silica aerogel-based flexible blanket as passive thermal control element for spacecraft applications. J Mater Eng Perf. 2018;27:1265–73. https://doi.org/10.1007/s11665-018-3232-y.
Cuce E, Cuce PM, Wood CJ, Riffat SB. Toward aerogel based thermal superinsulation in buildings: a comprehensive review. Renew Sustain Energy Rev. 2014;34:273–99.
Lakatos A, Csik A, Trnik A, Budai I. Effects of the heat treatment in the properties of fibrous aerogel thermal insulation. Energies. 2019;12(10):12102001.
He S, Chen X. Flexible silica aerogel based on methyltrimethoxysilane with improved mechanical property. J Non-Cryst Solids. 2017;463:6–11.
Zhao JJ, Duan YY, Wang XD, Wang BX. Experimental and analytical analyses of the thermal conductivities and high-temperature characteristics of silica aerogels based on microstructures. J Phys D Appl Phys. 2013;46:1–12.
Yang J, Liu J, Sui X, Liu R, Zhou C, Lv Y, Wang S, Wang S, Wei M. Property changes of SiO2 aerogel on insulation performance under different time and high temperature condition. In: Pan W, Gong J, editors. High-performance ceramics Viii, Key Engineering Materials. Vol 602–603. Scientific.Net, Trans Tech Publications; 2014. p. 349–352. https://doi.org/10.4028/www.scientific.net/KEM.602-603.349.
Spaceloft, Declaration Brochure, http://www.aerogelszigeteles.hu/system/files/Spaceloft_DS_1.1.pdf. Downloaded 23 Sept 2019.
Saravana Bhava P, Tharmaraj P, Muthuraj V, Umadevi M. Synthesis, spectral characterization, biological screening and DNA studies of 2-(5-mercapto-1, 3, 4-oxadiazol-2-yl) phenoltransition metal(II) complexes. Res Invent Int J Eng Sci. 2013;2(12):16–25.
Parker FS. Applications of Infrared Raman and resonance Raman spectroscopy in biochemistry. New York: Plenum Press; 1983.
Greenwood NN. Spectroscopic properties of inorganic and organometallic compounds, vol. 7. London: The Chemical Society Burlington House; 1973.
Ellis SR, Hoffman DP, Park M, Mathies RA. Difference bands in time-resolved femtosecond stimulated raman spectra of photoexcited intermolecular electron transfer from chloronaphthalene to tetracyanoethylene. J Phys Chem A. 2018;122(14):3594–605. https://doi.org/10.1021/acs.jpca.8b00318.
Ishikawa K, Fujima N, Komura H. Firstorder Raman scattering in MgO microcrystals. J Appl Phys. 1985;57:973.
Kloprogge JT. Chapter 6: Raman spectroscopy of clay minerals. In: Gates WP, Kloprogge JT, Madejová J, Bergaya F, editors. Developments in clay science, vol. 8. Amsterdam: Elsevier; 2017. p. 150–99.
Ma Z, Llao X, Kong G, Chu J. Raman scattering of nanocrystalline silicon embedded in SiOz. Science in China (Series A). 2000;43(4):414–20.
Sathyanarayana DN. Vibrational spectroscopy, theory and Applications. Delhi: New Age International Publishers; 2005.
Galkin KN, Galkin NG. Silicon overgrowth atop low-dimensional Mg2Si on Si(111): structure, optical and thermoelectrical properties. Phys Proc. 2011;11:55-4.
Lin-Vien Dalmay, Colthup Norman B, Fateley William G, Grasselli Jeannette G. The handbook of Infrared and Raman characteristic frequencies of organic molecules. Cambridge: Academic Press; 1991.
Walrafen GE, Hokmabadi MS, Holmes NC, Nellis WJ, Henning S. Raman spectrum and structure of silica aerogel. J Chem Phys. 1985;82(5):2472–6.
Rolfe SM, Patel MR, Gilmour I, Olsson-Francis K, Ringrose TJ. Defining multiple characteristic raman bands of α-amino acids as biomarkers for planetary missions using a statistical method. Orig Life Evol Biosph. 2016;46:323–46.
Richter H, Wang ZP, Ley L. The one phonon Raman spectrum in mimrystalline silicon. Solid State Commun. 1981;39:625.
Kaindl Reinhard, Többens Daniel M, HaefeKeR Udo. Quantum-mechanical calculations of the Raman spectra of Mg- and Fe-cordierite. Am Mineral. 2011;96:1568–74.
Rücker H, Methfessel M, Dietrich B, Pressel K, Osten HJ. Phonons as a probe of short-range order in Si1−xCx alloys. Phys Rev B. 1996;53:1302.
Nalwa HS. Silicon-based materials and devices, properties and devices, vol. 1. Cambridge: Academic Press; 2001.
Wang, M, Cheng J, Li M, He F. Raman spectra of soda–lime–silicate glass doped with rare earth. Phys B. 2011;406:3865.
Sjoberg B, Foley S, Cardey B, Enescu M. An experimental and theoretical study of the amino acid side chain Raman bands in proteins. Spectrochim Acta A Mol Biomol Spectrosc. 2014;128:300–11.
Bandet J, Despax B, Caumont M. Nitrogen bonding environments and local order in hydrogenated amorphous silicon nitride films studied by Raman spectroscopy. J Appl Phys. 1999;85:7899.
Palaninel R, Velraj G. FTIR and FT-Raman spectroscopic studies of fired clay artifacts recently excavated in Tamilnadu, India. India J Pure Appl Phys. 2007;45:501–8.
Frost RL, Rintoul L. Lattice vibrations of montmorillonite: an FT Raman and X-ray diffraction study. Appl Clay Sci. 1996;11:171.
Deng CS, Breen C, Yarwood J, Habesch S, Phipps J, Craster R, Maitland G. Ageing of oilfield cement at high humidity: a combined FEG-ESEM and Raman microscopic investigation. J Mater Chem. 2002;11(10):3105–12.
Walrafen GE, Hokmabadi MS, Holmes NC. Raman spectrum and structure of thermally treated silica aerogel, Citation. J Chem Phys. 1986;85:771.
Capeletti LB, Zimnoch JH. Fourier transform infrared and Raman characterization of silica-based materials. London: IntechOpen; 2016. https://doi.org/10.5772/64477.
Gucsik A, Zhang M, Koeberl C, Salje E, Redfern S, Pruneda J. Infrared and Raman spectra of ZrSiO4 experimentally shocked at high pressures. Mineral Mag. 2004;68(5):801–11.
Capeletti LB, Baibich IM, Butler IS, dos Santos JHZ. Infrared and Raman spectroscopic characterization of some organic substituted hybrid silicas. Spectrochim Acta Part A Mol Biomol Spectrosc. 2014;133:619–25.
Bonen D, Johnson TJ, Sarkar SL. Characterization of principal clinker minerals by FT-Raman microspectroscopy. Cem Concr Res. 1994;24(5):959–65.
Croce A, Arrais A, Rinaudo C. Raman micro-spectroscopy identifies carbonaceous particles lying on the surface of crocidolite, amosite, and chrysotile fibers. Minerals. 2018;8:249.
Brichter L, Kehoe D, Matisons J, Swincer G. Siloxane coupling agents. Macromolecules. 1995;28:3110–8.
Matsuura H, Fukuhara K. Vibrational spectroscopic studies of conformation of poly(oxyethy1ene) conformation-spectrum correlations. J Polym Sci, Part B: Polym Phys. 1986;24:1383–400.
Kebukawa Y, Nakashima S, Otsuka T, Nakamura-Messenger K, Zolensky ME. Rapid contamination during storage of carbonaceous chondrites prepared for micro FTIR measurements. Meteorit Planet Sci. 2009;44:545–57.
Kida T, Hiejima Y, Nitta K-H. Raman spectroscopic study of high-density polyethylene during tensile deformation. Int J Exp Spectrosc Technol. 2016;1:001.
Marshall CP, Marshall AO. The potential of Raman spectroscopy for the analysis of diagenetically transformed carotenoids. Philos Trans R Soc A Math Phys Eng Sci. 1922;368:3137–44.
Stauffer MT. Applications of molecular spectroscopy to current research in the chemical and biological sciences. London: IntechOpen; 2016.
Torchynska T, Vorobiev Y. Semiconductor II–VI quantum dots with interface states and their biomedical applications. London: IntechOpen; 2011.
Rodriguez UA. Fundamentals and characterization of fungally modified polysaccharides for the production of bio-plastics. Dissertation, Department of Forestry, University of Toronto. 2010.
Acknowledgements
Open access funding provided by University of Debrecen (DE). The research was financed by the Higher Education Institutional Excellence Programme (NKFIH-1150-6/2019) of the Ministry of Innovation and technology in Hungary, within the framework of the Energy thematic programme of the University of Debrecen (Ákos Lakatos). This work was financially supported by the GINOP-2.3.2-15-2016-00041. The project is co-financed by the European Union and the European Social Fund (István Csarnovics).
Author information
Authors and Affiliations
Corresponding author
Additional information
Publisher's Note
Springer Nature remains neutral with regard to jurisdictional claims in published maps and institutional affiliations.
Rights and permissions
Open Access This article is distributed under the terms of the Creative Commons Attribution 4.0 International License (http://creativecommons.org/licenses/by/4.0/), which permits unrestricted use, distribution, and reproduction in any medium, provided you give appropriate credit to the original author(s) and the source, provide a link to the Creative Commons license, and indicate if changes were made.
About this article

Cite this article
Lakatos, Á., Csarnovics, I. Influence of thermal annealing on structural properties of silica aerogel super insulation material. J Therm Anal Calorim 142, 321–329 (2020). https://doi.org/10.1007/s10973-019-09043-5
Received:
Accepted:
Published:
Issue Date:
DOI: https://doi.org/10.1007/s10973-019-09043-5