
Abstract
Potential step voltammetry (PSV) was introduced in earlier works as an advantageous alternative to traditional methods for measuring corrosion rate in reinforced concrete. The present study aims to improve PSV to maximize its applicability in corrosion rate monitoring, that is, beyond the narrowly-defined steel–concrete systems in which was initially validated. It was therefore identified necessary to address the most suitable PSV pulse amplitudes to accurately obtain the Tafel lines and, therefore, corrosion rate in steel-mortar systems with well-differentiated ohmic drop. PSV findings were compared to reference methods, i.e. Tafel intersection and linear polarization resistance. As a novelty, we propose a procedure to improve the reliability of the PSV-determined Tafel lines, which is based on three protocols (P1, P2 and P3). P1 consists of a specific pulse sequence to accurately characterize the morphology of the polarization curve without disturbing the system. P2 consists of two short pulses for determining the ohmic drop compensation factor. Finally, P3 consists of a simple calculation procedure to accurately adjust the PSV pulse amplitudes (∆V) to the steel–concrete system assessed, thus obviating the need for preset values and, therefore, ensuring accurate corrosion rate results. The procedure proposed is intended to improve PSV with a view to its consolidation as a reliable tool for the unsupervised monitoring of real structures.
1 Introduction
One of the pathologies that impacts reinforced concrete structure durability most severely is reinforcement corrosion. Hence the decades-long research effort devoted to the matter. The literature is rife with papers on the development of techniques to measure corrosion rate in reinforced concrete. The outcome has been the establishment of recognized methods to measure instantaneous rates of uniform corrosion such as Tafel intersection or impedance spectroscopy that furnish very comprehensive information [1]. However, these methods have limited applicability for on-site corrosion assessment, since they typically require long and slow polarization tests, which are time consuming and may induce irreversible alterations in the reinforcement [2]. The result has been the widespread acceptance of linear polarization resistance (LPR) methods [3], which are designed to determine polarization resistance (RP, expressed in Ω·cm2) with a fairly quick and easy test [4, 5]. Corrosion current density (iCORR), the parameter used to study reinforcement corrosion rate, is defined as iCORR = B/RP [6]. That calculation may be subject to a maximum factor error of 2, attributable to the constant B, normally assigned a value of 0.026 V in light of the difficulty involved in determining its actual value [7]. That error is assumed in practice insofar as it is not detrimental to inspection, the purpose of which is to determine whether the corrosion current lies within a given range of values defined by the corrosion level (negligible, low, medium or high), such as laid down in Spanish standard UNE 112072 [8] or the RILEM recommendation provided by Andrade et al. [9]. In addition, LPR methods are speedy and non-destructive, shortening on-site inspection times and allowing for consecutive readings with no risk of irreversible changes to the steel reinforcement due to intensive polarization, a key advantage in continuous structural monitoring [10].
As is well known, ohmic drop is one of the main causes of error in the evaluation of the corrosion rate with many electrochemical techniques [9]. The polarization (η) applied to the rebar is increased by an ohmic voltage component (∆VΩ), the total applied potential being ∆V = η + ∆VΩ. Consequently, an apparent polarization resistance (RP(AP) = ∆V/∆I) is obtained, which overestimates RP by an amount equal to the electrical resistance of the concrete (RS) and thus iCORR is underestimated [11]. In this line, among the techniques based on the LPR method, galvanostatic techniques stand out, where a small current perturbation (∆I) is applied and the resulting change in electrochemical potential (∆V) is measured. Its strength is to be able to determine and compensate the ohmic drop in the same test in which the RP is determined [12, 13]. Although this is highly advantageous, the main difficulty of these methods is a precise control of the η resulting after the ohmic drop correction (η = ∆V − ∆VΩ) [9, 14]. This aspect is critical, since the Stern and Geary polarization resistance method requires the η to be low, usually between 0.01 and 0.03 V with respect to the corrosion potential (ECORR) [15]. In practice, the ∆I to be applied is selected prior to testing depending on whether the reinforcement is in the passive (≈ 2–50 µA) or active state (≈ 100–500 µA) [16,17,18,19], but without initially considering the ohmic drop. As a consequence, if the ohmic drop is too low the resulting η could be too high and the rebar would be excessively polarized or, conversely, that if the ohmic drop is too high the η could be too low to perform the RP calculation reliably.
Other LPR methods are potentiostatic techniques, where a small potential perturbation (∆V) is applied and the resulting current response (∆I) is measured. The advantage of these methods is a precise control of polarization (η) [20], provided that the ohmic drop (∆VΩ = ∆I·RS) is included in the applied potential (∆V = η + ∆VΩ). The ohmic drop can be determined in a previous test by means of the positive feedback and current interruption techniques [4, 9]. There are other alternative proposals based on the curve-fitting analysis of the transient response, both for the galvanostatic [21] and the potentiostatic methods [22], which do not require an additional test, although the difficulties in finding an accurate model for steel–concrete systems has limited their implementation in practice [20]. In this line of the use of fitting models is also the electrochemical impedance spectroscopy, an alternating current technique that is also based on the LPR method and for which a wide variety of models have been proposed [23], despite the fact that the ones that provide the best fit do not always have a reliable physicochemical meaning [24]. The RS value in EIS is obtained at high frequencies, i.e., at short times; while RP requires reaching low frequencies. Consequently, EIS is too long and complex for in-situ implementation [4], although there are some recent proposals based on this technique for the corrosion monitoring in reinforced concrete structures [25].
In any case, as indicated above, all LPR methods always introduce a certain degree of inaccuracy. This is widely known; however, it has generated some interest in exploring accurate alternatives. Among the most outstanding methods are those based on the analysis of nonlinearity of a curve segment near the ECORR, which are intended to provide the RP together with the Tafel coefficients to obtain a more reliable iCORR [26]. In this line, there are those in which the iCORR is obtained from only two, three [27, 28] or four [29] points of the polarization curve and those based on the use of the fitting method and computer programs [30, 31]. These methods are designed to reduce the risk of damage to the steel surface due to the accumulated charge during polarization that exists with the use of classical slow voltammetry scans in the Tafel method. However, the equations used involve laborious calculations and can unsolve in real numbers under very specific conditions [32]. Furthermore, in these methods, again the ohmic drop usually introduces significant errors in the measurement, although the use of potentiostats with automatic ohmic drop compensation can help to overcome this problem [9]. There are other proposals based on obtaining only the linear sections of the polarization curve by using galvanostatic or galvanodynamic techniques [33], however, as mentioned above, the main problem with these techniques lies in the difficulty to precisely control the applied polarization.
In recent decades, a great deal of effort has been devoted to the development of advanced techniques for corrosion measurement, such as fiber optical technology-based sensors [34, 35], which stand out for their versatility and miniaturization capability, and inductively coupled magnetic fields-based sensors [36], which allow wireless monitoring. In addition, emerging damage identification techniques based on acoustic emission [37] and guided ultrasonic waves [38] have proved effective in damage identification in reinforced concrete. To date however, these advanced methods do not provide high accuracy in corrosion rate measurements.
Potential step voltammetry (PSV) was introduced in an earlier paper [39] as an alternative to traditional methods for determining steel corrosion rates in reinforced concrete. The technique is based on the Tafel intersection method, except that the Tafel lines are found from six specific points with no need to conduct time-consuming sweep voltammetry. That shortens test times substantially while delivering accurate corrosion rates much more quickly and without risk of irreversibly disturbing the steel–concrete system. A further advantage to the technique is its capacity to determine other parameters of interest such as concrete electrical resistance and double layer capacitance.
PSV was the object of a PhD thesis [40] and a number of subsequent articles describing its theoretical development [41, 42] and experimental validation [39]. Those studies showed that the Tafel lines were reliably obtained by modelling the system’s transitory response to strategically chosen potential steps. The potential applied at such steps (∆V) must be adjusted as a function of the ohmic drop (∆VΩ) to ensure that the resulting polarization, η = ∆V − ∆VΩ, lies in the Tafel region of the polarization curve. Moreover, it is known that the morphology of the polarization curve can vary depending on the electrochemical system [43, 44], so that the linear Tafel regions do not always appear in the same η range. Therefore, it is convenient to have a prior estimation of the electrochemical behavior of the system in order to implement the PSV method reliably.
Despite the above, in the work where the technique was initially presented [39], fixed ∆V values were proposed for the six pulses used, namely three anodic pulses of + 0.075, + 0.105 and + 0.140 V, and three cathodic pulses of − 0.075, − 0.105 and − 0.140 V with respect to the ECORR. This is because the steel–concrete systems used in this study did not show large variability for either polarization curve morphology or ohmic drop. However, when implementing PSV in other types of systems, its reliability may be reduced because the points used to obtain the Tafel lines are susceptible to appear in an inappropriate zone of the polarization curve as a consequence of the factors described in the previous paragraph. The following Sect. 2 describes in greater detail the main problems detected.
Therefore, this work aims to update the PSV technique to be able to reliably assess corrosion in any cement-based material, regardless of ohmic drop and polarization curve morphology. For this purpose, the potentiostatic pulse sequence used in PSV was studied with a wide set of potential (∆V) values in a number of reinforced mortar specimens with different admixtures and ohmic drops. The analysis addressed the most suitable amplitude, i.e. the potential (∆V), of the PSV pulses to accurately obtain the Tafel lines employed for determining the corrosion rate. The PSV findings were compared to the values obtained by reference methods, i.e. the Tafel intersection method (by applying traditional lineal sweep voltammetry) and the LPR method.
As a result, the novelty here is the simple procedure we propose for adjusting PSV pulse amplitudes depending on the steel–concrete system to be assessed. The novelty does not lie in the procedure itself, but in the improvement it introduces in PSV. That obviates the need to assign PSV pulse amplitude a preset but very likely inadequate values, since they usually provide the non-linear region of the polarization curve where Tafel lines cannot be correctly determined. The ultimate aim is to improve PSV applicability, since the assumption of preset values, such as the constant B in the LPR method, may well reduce reliability of the corrosion rate determination. The proposal is intended to make the PSV technique a highly versatile tool for the unsupervised monitoring of real structures. This implies an important contribution, since PSV presently forms part of the smart corrosion sensor system developed [40] and patented [45] by the present authors and has been installed in several structures in service. This sensor system, intended for new construction monitoring, incorporates a rebar section of known area that acts as working electrode (WE), plus a reference electrode (RE) and a counter electrode (CE) with a size equal to or larger than that of WE. This measuring cell allows to implement PSV, along with the improvement procedure here proposed, without being affected by the uncertainty about the polarized area of steel reinforcement, which is one of the major sources of error when measuring corrosion rate on site by means of typical sensor systems based on the guard ring technique [46]. This WE is intended to be representative of the monitored structure, since it is made of the same steel as the reinforcement, to which it remains electrically connected to participate in possible corrosion macrocells to the same extent as the surrounding rebars. The WE is only disconnected from the reinforcement for corrosion rate measurement (applying PSV). The improved PSV technique proposed here is intended to be implemented not only in our sensor system, but also in any measuring system based on measuring cells with working electrodes of known area.
2 Revision of the PSV Background
In PSV, corrosion current density (iCORR) is measured based on the Tafel intersection method, although with the advantage that the Tafel lines are obtained much more quickly and without risk of inducing irreversible alterations in the reinforcement. Each Tafel line is determined from three points on the respective polarization curve (Fig. 1a), each point obtained by applying a given potentiostatic pulse (∆V). Consequently, three pulses of differing amplitude are applied to generate each Tafel line: ± ∆V1, ± ∆V2 and ± ∆V3. Those pulses are integrated in the sequence ECORR/ + ∆V1/ECORR/-∆V1/ECORR/ + ∆V2/ECORR/-∆V2/ECORR/ + ∆V3/ECORR/− ∆V3/ECORR depicted in Fig. 1b, which is symmetrical to the corrosion potential (ECORR) in order to minimize steel polarization during the test.

Principles underlying PSV: a example of a polarization curve obtained with sweep voltammetry and corrosion current density (iCORR) determination from the PSV iF-η points obtained by fitting the intensity-time response curve to b a symmetrical potentiostatic pulse sequencing pattern of variable amplitude (± ∆V1, ± ∆V2 and ± ∆V3)
Each point on the Tafel lines (Fig. 1a) was obtained by modelling the system’s transitory response to the respective pulse (Fig. 2). The theory and equations for the equivalent circuit used, shown in Fig. 2a, was developed in an earlier study [41]. This circuit is in line with the first models used with the potentiostatic pulse technique [47]. However, the equations previously proposed for this model were not fully satisfactory, something we have solved in [41]. There are proposals for improvement based on the incorporation of the constant phase element (CPE) commonly used in alternating current models [20, 48, 49]. However, the physicochemical meaning of these models is not always mathematically simple to interpret [50], which has led to the use of simpler models in practice [51]. The PSV technique is intended to be implemented for in situ corrosion rate monitoring by means of unsupervised sensor systems. Consequently, a model composed of simple and easily interpretable elements, i.e. resistors and capacitors, was chosen (Fig. 2a). As verified in [39], this model presents adequate reliability in both passive and active steel–concrete systems.

Modelling of the system’s transitory response for each PSV pulse: a equivalent circuit used whose elements are solved by (b) minimum squares fitting of the experimental current–time (i–t) curve; and yielded c relevant PSV parameters, such as the electrical resistance (RS), the faradaic current (iF) and the overpotential (η) needed for determining the Tafel lines
The circuit components are calculated by minimum squares fitting of the current–time curve (Fig. 2b). According to Fig. 2c, that yields the faradic current (iF) flowing in the system at quasi-steady state (t → ∞) as iF = ∆V/(R1 + RP), defined as the ordinate of each PSV-point in Fig. 1a. The abscissa is the overpotential (η) applied at the respective pulse, obtained as η = ∆V–(iF·RS), where RS is the electrical resistance of concrete, calculated as RS = R1·R2/(R1 + R2). In addition, double layer capacity (CDL) is obtained from the capacitors of the circuit as CDL = C1 + C2. All resistances are expressed in Ω·cm2, capacitors in F/cm2 and the potential (∆V) and overpotential (η) in Volts.
The conclusion drawn in an earlier study [39] was that both Tafel lines could be obtained by applying the sequence in Fig. 1b with a pulse duration of 50 s and ± ∆V1 = 0.070 V, ± ∆V2 = 0.105 V and ± ∆V3 = 0.140 V; obtaining an overestimation of only 9% when comparing the PSV-measured iCORR against the real corrosion rate obtained by the gravimetric method. However, those pulse amplitude (± ∆V) values may not be applicable beyond the specific conditions considered in the aforementioned previous study, i.e. reinforced concrete samples made with ordinary Portland concrete with w/c ratio of 0.65 subjected to different environmental regimes (chloride, carbonation and non-aggressive exposure) intended to simply achieve well differentiated active and passive steel–concrete systems.
An important aspect not explored in depth is how the ohmic drop affects corrosion rate measurements in PSV. If the overpotential (η) range in which the Tafel lines appear on the polarization curve were assumed to be invariable, the potential to be applied (∆V) would depend directly on the ohmic drop (iF·RS), since ∆V = η + (iF·RS). The ohmic drop in reinforced concrete presents an important variability, since it depends on the corrosion rate of the reinforcement and concrete resistivity, both very variable parameters [52]. Moreover, the shape of polarization curves commonly varies for each steel–concrete system [43, 44], so does the η range of the Tafel regions. Therefore, the ∆V would have to be deemed a variable parameter. If, on the contrary, fixed ∆V values were adopted, the following two undesirable problems could arise (Fig. 3):
-
Problem 1, depicted in Fig. 3a, is related to polarization curve morphology. As mentioned before, the η range in which Tafel-regions appear in the polarization curve is not fixed, but depends on the electrochemical system. Consequently, PSV pulse amplitudes cannot be assumed as fixed values, but must be adapted according to the system to be evaluated. Therefore, it would be convenient to have an estimation of the polarization curve morphology of the reinforced cement-based material to be assessed in order to accurately select the pulse amplitudes to be used.
-
Problem 2, depicted in Fig. 3b, is related to the ohmic drop. Here three possible situations can occur:
-
(i)
The chosen ∆V values are insufficient to compensate the ohmic drop, ∆V < η + iF·RS, and the resulting overpotentials (η) would be overly low. As a result, the iF-η points could lie too close to ECORR (η = 0) within the non-linear region of the polarization curve, yielding too steeped Tafel lines and, consequently, an underestimation of iCORR.
-
(ii)
The chosen ∆V values are above what is strictly necessary to compensate for the ohmic drop, ∆V > η + iF·RS, and the resulting overpotentials (η) would be overly high. Probably, the resulting iF-η points would lie within the Tafel regions, but steel–concrete system would be excessively polarized.
-
(iii)
The chosen ∆V values are adequate to compensate the ohmic drop, ∆V = η + iF·RS, and the resulting iF-η points lie within the Tafel regions, but in the lowest possible η range, so the steel–concrete system would be polarized as strictly necessary.

Schematic representation of the two possible problems associated with the use of preset pulse amplitudes (∆V) in PSV: a Problem 1: case of two electrochemical systems, A and B, in which the Tafel regions appear in different areas of the polarization curve, that is, at different overpotential (η) range; b Problem 2: Main situations regarding the position of the iF-η points (required to build the Tafel lines) depending on whether the preset ∆V values are adequate or not to compensate for the ohmic drop
As a consequence of the above, the fixed ∆V values proposed for PSV in earlier studies [39, 40] may predictably prove inadequate. Therefore, this study sought to revise and improve PSV in order to achieve a versatile tool for all types of steel–concrete systems. That entailed exploring a protocol to adapt the pulse amplitudes ± ∆V1, ± ∆V2 and ± ∆V3 of the pulse sequence in Fig. 1b depending on the shape of the polarization curve and the ohmic drop of the system to be assessed.
3 Experimental Procedures
3.1 Materials
Six 70 mm cubic specimens were prepared with a w/c ratio of 0.55 using three types of mortar: (i) Portland cement CEM-I 42.5 R-SR with no additions (CEM-I); (ii) Portland cement CEM-I 42.5 R-SR bearing silica fume (CEM-I-sf); and (iii) Portland cement CEM-III/C 32.5 N with a high slag content cement (CEM-III). Two batches of each mortar type were prepared, one with no chlorides and the other with 5 wt% chlorides (cement weight) added to the mixing water in the form of NaCl. The resulting six batches of mortar listed in Table 1 afforded the study a sufficiently wide range of electrical resistance (RS) and corrosion levels (related to the faradic current, iF) to study PSV in steel–concrete systems exhibiting different ohmic drops (iF·RS). The fresh state density of the mortars varied from 2000 to 2100 kg/m3. Three 6 mm Ø, 70 mm long corrugated carbon steel rebars were embedded in each specimen (Fig. 4). Both ends of each bar were protected with epoxy resin, leaving 5.84 cm2 of exposed working area.

Cubic specimens studied and test set-up used: rebar as working electrode (WE), stainless steel mesh as counter-electrode (CE) and Ag/AgCl reference electrode (RE) (dimensions in mm)
3.2 Laboratory Conditions
All the specimens were demolded 48 h after casting and cured for 28 days in a climate chamber at 20 ± 2 °C and 95% RH. They were subsequently placed in air-tight containers set on a perforated plastic shelf standing over a pool of water to permanently maintain relative humidity at around 100% while preventing capillary ingress of water into the concrete. Those conditions were maintained until the end of the electrochemical evaluation, which was carried out 3 months after the manufacture of the specimens (time including the 28 days of curing). This period of time ensured a situation of electrochemical stability to be reached, as indicated by the highly stable values of corrosion potential and electrical resistance monitored in the different specimens towards the end of this period.
3.3 Measuring Procedure
The experimental set-up depicted in Fig. 4, designed in accordance with Spanish standard UNE 112072 [8], consisted in a three-electrode cell with embedded rebar as the working electrode (WE), a 3 M Ag/AgCl/KCl electrode as the reference (RE) and a stainless-steel mesh positioned underneath and external to the specimen as the counter electrode (CE). This three-electrode cell is similar to the embedded sensor measurement cell developed by the authors for in situ corrosion rate monitoring in real structures [40]. Optimal electrical contact was ensured by placing a wet sponge between the concrete surface and the CE and RE respectively. The electrochemical measurements were performed on an Autolab PGSTAT 350 potentiostat in a Faraday cage at ambient temperature (20 ± 2 °C).
The small size of the WE (5.84 cm2) is adequate considering that the specimen studied (Fig. 4) is also small and made of mortar. This design has been intentionally chosen for the WE to behave as a mixed electrode in which anodic and cathodic zones are not distinguished. In this way, the polarization of the embedded steel is intended to be as homogeneous as possible in comparison with larger WEs used for on-site assessments which are more susceptible to macrocell processes that would distort the corrosion rate measurement [53].
The corrosion potential (ECORR) of the embedded rebar was determined prior to polarization from the open circuit potential (OCP) vs Ag/AgCl reference electrode (positioned as shown in Fig. 4). The ECORR used was the value found once OCP stabilized (∂V/∂t ≤ 0.03 mV/s).
A short pulse sequence (PSVsh) (Fig. 5a), ∆t = 10 s and ± ∆V = 0.100 V, was applied first. The current–time curve, both anodically (+ ∆V) and cathodically (− ∆V) obtained, was taken as a basis for determining the i0/iLIM ratio (Fig. 5b), where i0 is the current recorded at the outset (t = 0) and iLIM the current measured upon conclusion. As demonstrated in a recent paper [54], the most reliable way to record i0 is to use very short pulses (∆t = 5 ms) with short sampling time (0.1 ms). However, as discussed in [39] to reliably determine iLIM the quasi-steady state system response (∆t = 50 s) must be recorded. In PSVsh it is proposed to use pulses of ∆t = 10 s with a sampling time of 0.1 s, i.e., a compromise situation between the optimal conditions for recording each type of current (i0 and iLIM). The i0/iLIM ratio obtained was subsequently used to develop a protocol to factor the ohmic drop into iCORR calculations.

Techniques applied: a short PSV (PSVsh); b ratio between the peak current at t = 0 (i0) and the end-of-pulse limiting current (iLIM) (example for anodic pulse); c cyclic LPR voltammetry; d alternating pulse PSV (PSValt); e stairstep-pulse PSV (PSVstp); and f linear sweep voltammetry (LSV)
The linear polarization resistance method was subsequently applied to find iCORR from Eq. (1):
Polarization resistance (RP), expressed in Ω·cm2, was found from the slope on the linear region of the polarization curve resulting from applying cyclic voltammetry with an ECORR ± 0.02 V at a scan rate of 0.010 V/minute (Fig. 5c) according to [55]. Different values were used for constant B: the standard 0.026 V as well as experimental values obtained from the slope of the anodic (bA) and cathodic (bC) Tafel lines on the polarization curves, using Eq. (2):
The polarization curves for the various systems studied were then plotted to establish the potential range for determining the Tafel lines to find iCORR from the intersection between the two. Potential step voltammetry, described in Sect. 2, was applied for that purpose, although instead of using the sequence shown in Fig. 1b for three electric potential values (∆V), it was applied for eight values of ± ∆V (Fig. 5d), specifically 0.035, 0.070, 0.105, 0.140, 0.175, 0.210, 0.245 and 0.280 V (hereafter PSValt or alternating pulse sequencing pattern). A second variation on the technique, in which the pulses were stair-stepped (PSVstp) (Fig. 5e), was likewise applied to analyze the effect of the sequencing pattern. In PSV-based methods (PSValt and PSVstp) bA and bC were determined from the corresponding Tafel line defined by three specific iF-η points (Fig. 1a) that were obtained by fitting the current–time response of the system to a theoretical model (Fig. 2).
Polarization curves were also obtained with linear sweep voltammetry (LSV) (Fig. 5f) for comparison to the PSV findings. The curves were obtained with two LSV scans, an anodic sweep from ECORR to ECORR + 0.280 V and a cathodic sweep from ECORR to ECORR − 0.280 V at a scan rate of 0.010 V/minute in accordance with [56, 57]. Cathodic scanning was performed 24 h after anodic scanning to ensure recovery of the initial ECORR values (with a tolerance of ± 0.005 V). Otherwise, there would be a potential gap between the anodic and cathodic branches of the polarization curve, so the Tafel lines would be incorrectly determined and, consequently, iCORR falsely calculated.
The value of the anodic (bA) and cathodic (bC) Tafel slopes found with PSV and LSV were used to calculate parameter B (Eq. 2), in turn applied to find iCORR with the LPR method (Eq. 1). The results of the two methods were subsequently compared.
The disturbance degree produced in the steel–concrete system because of the polarization (of particular interest in PSVstp, PSValt and LSV) was analyzed through the electric charge accumulated after each test, which results from integrating the measured current with respect time. Preliminary testing determined the order in which the electrochemical techniques (Fig. 5) were applied, i.e. in increasing order of disturbance degree: (1) PSVsh, (2) LPR, (3) PSValt, (4) PSVstp and (5) LSV. Each specimen was extracted from the controlled conditions (Sect. 3.2) only for the time strictly necessary to apply the corresponding technique, after which it was returned to the controlled conditions until the application of the next technique once the previous one had been implemented throughout the specimen set. In this way, each specimen had sufficient time to return to its equilibrium condition (i.e. its original ECORR ± 0.005 V, which was recorded and verified just before applying the measurement), thus being able to test the different specimens in a comparable state.
4 Results and Discussion
The results for Tafel lines determination and ohmic drop analysis are discussed hereunder separately for readier analysis and comprehension:
-
(i)
Analysis of Tafel lines consisting in a study of the overpotential (η) range within which to determine the Tafel lines on the polarization curves for steel–concrete systems with different ohmic drops. That served as a basis for establishing the electric potential (∆V) value to be adopted for the respective PSV pulses. The slope of the Tafel lines and corrosion rate values found with PSV were then compared to the reference method findings.
-
(ii)
Procedure for adjusting the potential pulse amplitude in PSV which involved an in-depth study of the effect of the ohmic drop on PSV. The analysis addressed the ohmic drop influence on the overpotential (η) and therefore on the real polarization induced to the steel–concrete systems. The aim was to develop and propose a procedure for reliably determining that effect with a view to adjusting the potential (∆V) of the PSV pulses to the type of system studied.
4.1 Analysis of Tafel Lines
The polarization curves obtained for the six types of mortar (Table 1) with the techniques applied are graphed in Fig. 6. To simplify the discussion, the findings for those systems with clearly differentiated behavior are shown here, i.e. the central rebar of each mortar mix (Fig. 4). The Tafel lines were determined on the straight part closest to the corrosion potential (η = 0 V) on the respective branch of the curve. A common range of overpotential values (η) was sought to determine the Tafel lines for all the steel–concrete systems.

Polarization curves obtained with PSValt, PSVstp and LSV for the central rebar of each mortar specimen to which the Tafel intersection method was applied. The ordinate axis shows the current density (i) on base 10 logarithmic scale and the abscissa axis shows both the overpotential (η) and the rebar potential (E) versus the Ag/AgCl reference electrode
As a rule, in LSV the anodic branch was observed to exhibit linear behavior across η values ranging from 0.070 to 0.160 V. In two cases, however, CEM-I and CEM-III-chlorides, the curves veered beginning at around 0.100 V. In all six mortars, the cathodic branch of LSV was linear in the range η = − 0.070 to − 0.160 V. A range of η = ± 0.070 to 0.160 V was consequently taken as a reference for choosing the points on the PSV iF-η curve to be used to obtain the Tafel lines. All the PSValt lines were obtained from the three iF-η points representing the three consecutive pulses closest to the range where η adopts the values ± 0.070 to 0.160 V defined for LSV (Table 2). The data in Table 3 summarizes the analysis of the LSV and PSValt (alternating pulse variant) Tafel lines. Although here only the results obtained for the central rebar of each specimen are analyzed, these could be considered representative of the mortar mix to which they belong, since the variation coefficient of the Tafel slopes (bA and bC) obtained for the set of three rebars was under 11% in the different specimens.
Overall, higher current values were found for the PSV- than the LSV-based curves. The polarization curve for the stair-stepped pulse sequencing pattern, PSVstp (Fig. 5d), resembled the LSV curve more closely (Fig. 6) because system potential varied similarly in the two patterns, i.e., with minor, uninterrupted rises in potential until the maximum value defined was reached. Wider differences in the polarization curve were obtained with the alternating pulse technique, PSValt (Fig. 5d), particularly for the anodic branch (Fig. 6).
Those differences are illustrated in Fig. 7a, where the electric charge density transferred to the working electrode (the rebar) against time of application is plotted for each technique. The charge transferred was clearly greater in LSV than transferred with equivalent potential scanning using PSValt or PSVstp. It should be noted that all techniques show an asymmetrical trend in Fig. 7a, where the cathodic component (negative charge) is greater than the anodic one (positive charge), indicating that oxygen reduction is more favored over the oxidation process in specimen CEM-I-chlorides. It is coherent that this phenomenon occurs in the CEM-I-chlorides specimen, since according to Table 3, it presents an electrical resistance (RS) of 1314 Ω·cm2, very similar to the 1886 Ω·cm2 obtained for the same mixture without chlorides (CEM-I). On the contrary, in the other mixtures (CEM-I-sf and CEM-III) a clear decrease in RS is observed with the inclusion of chlorides (Table 3). This could indicate that the RS value in the CEM-I specimens would be determined mainly by the capillary porosity of the cement matrix rather than by the concentration of chloride ions in the pore solution. Under this hypothesis, oxygen ingress would be facilitated in the CEM-I-chlorides specimen and, therefore, the cathodic reaction would be favored over the anodic reaction, which would explain the trend observed in Fig. 7a. Consequently, it is consistent that in PSVstp and PSValt techniques that integrate anodic (+ ∆V) and cathodic (− ∆V) polarizations in the same test, a negative cumulative residual charge is obtained.

a Accumulated charge density; and b maximum possible number of Fe-monolayers able to be altered during anodic oxidation with PSV and LSV in the central rebar of the CEM-I-chlorides specimen, which is obtained as the corresponding anodic charge density (QA) divided by QL (0.607 mC/cm2)
Earlier studies explored the relationship between charge density transferred during the polarization of metallic working electrodes and the number of monolayers altered upon oxidated [58, 59]. Along these lines, a calculation is proposed in Appendix 1 to estimate the theoretical charge density to be extracted from a carbon steel WE to produce the oxidation of a layer of Fe atoms. The value of this charge, referred to as QL, is estimated to be 0.607 mC/cm2. It should be noted that if the WE is in the passive state, the QL value could be associated not only to the Fe oxidation, but also to the partial oxidation of the FeO and/or Fe(OH)2 to Fe3O4 [60,61,62].
The graph in Fig. 7b shows the number of Fe monolayers that can be considered altered during the anodic oxidation of the central rebar in specimen CEM-I-chlorides (in active state) by LSV and PSValt. For the calculation, the corresponding anodic charge density (QA) was divided by QL. In PSValt 2.7 Fe-monolayers would be oxidated at the end of the test. In contrast, 12.9 monolayers were altered with LSV, i.e. almost 5 times higher than with PSValt. Therefore, the amount of oxides formed with LSV in CEM-I-chlorides is expected to be notably higher than those generated with PSValt and, consequently, the oxidation process induced in the reinforcement with LSV will be more difficult to reverse. This would explain the long resting periods (> 24 h) necessary for the steel–concrete systems to return to their initial equilibrium state (ECORR) after implementation of the LSV anodic scan. As is known [2], the system could be irreversibly altered if the oxidation induced with LSV is too high.
Therefore, for active systems, LSV assumes a certain tendency to accumulate corrosion products during the anodic sweep (Fig. 7), which could place the anodic reaction in diffusion control providing very high bA values in comparison with PSV. This is notably seen in the specimens without additions, i.e. CEM-I and CEM-I-chlorides where the bA obtained by LSV is 1332 and 2350 mV/dec (Table 3). This phenomenon could be explained by assuming the following: (1) it is known that the pH (OH− concentration) in CEM-I concretes is higher than in those incorporating silica-based additions [63, 64] as is the case of CEM-I-sf and CEM-III; (2) according to the previous discussion about the RS value, CEM-I specimens present higher capillary porosity than the rest, which would favor ionic transport through their cement matrix; and (3) both in CEM-I and CEM-I-chlorides, rebars are in active state (Table 3). According to these statements, it can be assumed that in CEM-I type specimens there is a higher probability that OH− along with Cl− (in CEM-I-chlorides) easily reach Fe2+ ions. The result would be the formation of Fe(OH)2 and/or FeCl2, whose diffusion away from steel surface may be impeded due to their significant particle size and, in the case of FeCl2, electrostatic attraction with the rebar. This could place the anodic reaction under diffusion control, which would explain the anodic limiting current density (Fig. 6a and b) and, consequently, the high bA values (Table 3) obtained in CEM-I and CEM-I-chlorides with LSV. In these cases, bA → ∞ can be considered, so the resulting B would not be calculated according to Eq. (2), but as B = bC/2.303. In the case of CEM-I, the current density peak appearing approximately for E ≈ -0.15 V (Fig. 6a) could be attributed to transformation of Fe(OH)2 into passivating oxides [60, 65]. In CEM-I-sf and CEM-III, with lower capillary porosity, lower OH− concentration and clearly in passive state (Table 3), the anodic diffusion control attributed to CEM-I is expected to occur to a lesser extent. This would explain the lower bA values in CEM-I-sf and CEM-III (Table 3). Although the possibility of anodic diffusion control in reinforcement corrosion has generated certain interest in recent investigations [66], it still needs more discussion.
In PSValt, with which less than 3 Fe-monolayers would be dissolved in CEM-I-chlorides (Fig. 7b), the oxides generated with each anodic pulse were reduced, at least partially, with the subsequent relaxing pulse (return to ECORR) (Fig. 5d), thus preventing the diffusion control phenomena described above for the LSV technique. That would explain the higher faradaic current densities (iF) for all the anodic branch obtained with PSValt in comparison with LSV as the applied potential (E) increases (Fig. 6). This would be in line with conclusions found in earlier studies using platinum electrodes [67] and, most importantly, this is consistent with the anodic (bA) and cathodic (bC) slopes shown in Table 3, which indicate that PSValt Tafel lines are steeper than LSV, particularly the anodic one in CEM-I and CEM-I-chlorides. In general, linear regions on the polarization curves of Fig. 6 are more clearly observed with PSValt than with LSV. Those findings informed the decision to conduct the rest of the study with the PSValt sequencing pattern.
Despite the differences in the Tafel slopes, the iCORR values found with the two techniques (LSV and PSValt) were equivalent in terms of corrosion level according to [8, 9] (Table 3). In both cases, iCORR results are consistent with the corrosion probability based on the ECORR value according to [68], i.e. CEM-I-sf and CEM-III with negligible corrosion level correspond with less than 10% corrosion probability, whereas CEM-I with moderate corrosion level and CEM-I-chlorides, CEM-I-sf-chlorides and CEM-III-chlorides with high corrosion level correspond with more than 90% corrosion probability.
Nonetheless, the values for bA, bC and B coefficients differed significantly between LSV and PSValt (Table 3). Of these, bC is the least variable parameter and similar both in LSV (177–269 mV/dec) and PSV (118–189 mV/dec), whose values do not present clear differences between active and passive samples, the general range (118–269 mV/dec) being close to that reported by other authors, such as Angst et al. [69] for chloride induced corroded concrete (170–220 mV/dec), Koga et al. [70] for passive mortar samples (156–270 mV/dec), or Ha et al. [71] for chloride active mortar samples (≈340 mV/dec). Parameter bA shows greater variability, with the values obtained in PSV (189–310 mV/dec) being notably more homogeneous than in LSV (123–2350 mV/dec). The bA values reported in literature do not always allow establishing a clear distinction criterion between different systems, for example, 420 mV/dec for passive mortar [70] and 396 mV/dec for chloride active mortar [71], while values between 450 and 1050 mV/dec [69] and between 267 and 302 mV/dec [72] have been reported for chloride active concrete. Therefore, focusing on the PSV vs LSV comparison, it would appear that discrepancies in the bA coefficient are behind the differences between the value of B obtained with LSV and PSV.
Unlike LSV, PSV avoids excessive charge accumulation in the system (Fig. 7), so the resulting bA and bC values are less affected by possible diffusion control phenomena. This explains why bA, bC and B present, respectively, lower and more homogeneous values than those obtained with LSV (Table 3). In any case, none of the techniques shows the expected correlation between iCORR and B, i.e. the higher the iCORR the lower the B. For example, according to results in Table 3, in CEM-I-sf, with negligible corrosion level, B was 50 mV (LSV) and 38 mV (PSV), whereas in CEM-I-sf-chlorides, with high corrosion level, B was 78 mV (LSV) and 51 mV (PSV).
The results obtained here for parameters bA, bC and B could be coherent considering that different previous works suggest that a wide and often confusing range for these parameters is possible in reinforcement corrosion [7, 72]. This has led to the development of methods in which the constant B is not directly required to determine iCORR, as is the case of the potentiostatic approach proposed by Poursaee [73] and the PSV method studied in the present work. However, the constant B is of some interest for corrosion measurement with techniques based on the polarization resistance method (LPR). Consequently, it is of interest to study how the B value obtained by LSV and PSV influences the iCORR calculated from the LPR method according to Eq. (1).
Figure 8a compares the iCORR values for all 18 rebars studied (6 mortars specimens × 3 rebars each) obtained with the four techniques analyzed. An acceptable linear correlation (R2 = 0.9351) was found between LSV and PSValt, with a slight (2.5%) downward deviation in the latter. An analysis of the iCORR found with LPR revealed that when B = 0.026 V, the values were 44% lower than observed with LSV. This deviation between the two reference methods is in line with the results found in other studies [74]. When the B value found experimentally with LSV was applied, the iCORR LPR-calculated values rose by over 300% (Fig. 8b). In other words, rather than an improvement in the results, the contrary was observed, with an 84% deviation from the LSV-LPR regression line because the LPR values were higher (Fig. 8a). Using the experimental B value obtained with PSValt the LPR-calculated iCORR values were approximately 48% greater than the when a value of 0.026 V was assumed (Fig. 8b). That narrowed the deviation relative to LSV substantially, from 44% (B = 0.026 V) to 18% (B-PSValt) (Fig. 8a). Consequently, the iCORR calculated with the LPR method was reasonably consistent with the findings from the Tafel-based methods when the value of B determined with PSValt was used.

Comparison of iCORR values found for all 18 rebars (the 6 mortar specimens × 3 rebars each): a PSValt and LPR (B = 0.026 V) vs LSV; b LPR using B values experimentally determined with PSValt (B-PSValt) and LSV (B-LSV) vs LPR assuming B = 0.026 V
4.2 Procedure for Adjusting the Potential Pulse Amplitude in PSV
As shown in Table 2, the potential values (∆V) used in PSValt to obtain the anodic Tafel lines were + 0.070, + 0.105 and + 0.140 V except in mortar CEM-III-chlorides, where they were + 0.105, + 0.140 and + 0.175 V. Those higher ∆V values were required to compensate for the high ohmic drop (iF·RS) in the CEM-III-chlorides system to prevent the resulting η from sliding beneath the expected value, for ∆V = η + (iF·RS).
The magnitude of the ohmic drop in the mortars studied can be gleaned from the product iCORR·RS (Table 4). The least favorable ohmic drop was observed for CEM-III-chlorides, where iCORR·RS was very high due reinforcement activation (high iCORR) in that mortar, also characterized by high electrical resistance (RS) (Table 3). The intense effect of the ohmic drop on this system is visible in the ∆V-η regression line values depicted in Fig. 9 and listed in Table 4. In CEM-III-chlorides, the resulting η dropped to 61% of the ∆V applied in the anodic pulses (Fig. 9a), whereas the ohmic drop had a smaller impact on the other systems (slope ≈1). More specifically, the shallowest ohmic drop was observed in mortars CEM-I-sf and CEM-III, which translated into very low iCORR·RS values, for although RS was high (particularly in CEM-III), the reinforcement was passivated (very low iCORR). That shallower ohmic drop in these two systems was even more visible in the cathodic pulses, whose ∆V-η regression lines (Fig. 9b) were much closer to 1 than any of the others (Table 4). Consequently, whereas in the other systems the three pulses used for the Tafel cathodic line were ∆V = − 0.105, − 0.140 and − 0.175 V, smaller-amplitude pulses were used in these two mortars (CEM-I-sf and CEM-III), with ∆V = − 0.075, − 0.105 and − 0.140 V.

∆V vs η regression lines for a anodic and b cathodic pulses in the central rebar of each mortar specimen studied
The foregoing attests to the importance of ascertaining the ohmic drop for the system assessed. That parameter is required to establish the optimal potential pulse values to be applied in PSV (Fig. 1) to obtain the Tafel lines, known to appear in a specific and expected range of η values on the polarization curve. The proposal is therefore to conduct PSV measurement in keeping with the procedure depicted in Fig. 10, which consists in three protocols: P1, P2 and P3. A detailed description of the protocols follows:
-
(i)
Protocol P1, depicted in Fig. 10a, aims to accurately determine the range of η in which the anodic and cathodic Tafel lines lie. More specifically, it yields the minimum (ηMIN) and maximum (ηMAX) values in each range (Fig. 10a). Requisite to the calculation is the full polarization curve found with the PSValt sequencing pattern shown in Fig. 5d which, as discussed in Sect. 4.1 (Fig. 7), does not significantly alter the system studied. As that approach entails long measuring times, however, in practice it need only be deployed sporadically, either at the beginning of a specific study or from time to time when using PSV in continuous structural monitoring. Frequent application is not required in the latter case, since possible changes in the η-range in which the Tafel lines lie, assumed to be related with variations in the electrochemical behavior of the steel–concrete system, occur over the medium- or long-term.
Protocol P1 also yields the ∆V-η regression line (such as in Fig. 9) to obtain the ∂∆V/∂η factor from which to determine the ∆V value to apply for ohmic drop compensation into iCORR calculations. As noted, however, P1 is designed for sporadic application whereas correction for the ohmic drop must be calculated with each and every PSV measurement to ensure maximum reliability in structural monitoring or research.
-
(ii)
The solution proposed is to deploy protocol P2 as depicted in Fig. 10b. This quick test is intended to be conducted prior to initiating the pulse sequence shown in Fig. 1b. It consists in applying sequence PSVsh (Fig. 5a) with ∆t = 10 s and ± ∆V = 0.100 V. The current–time response is used to determine the i0/iLIM ratio (Fig. 5b) for both the anodic pulses, i0/iLIM (A), and cathodic pulses, i0/iLIM (C) (Fig. 10b). The ∂∆V/∂η correction factor is obtained by applying Eq. (3) for anodic pulses, ∂∆V/∂η (A), and Eq. (4) for cathodic pulses ∂∆V/∂η (C), in which is entered the respective i0/iLIM value, i.e. the anodic, i0/iLIM (A), or the cathodic, i0/iLIM (C). Equations (3, 4) are exponential functions found by fitting the corresponding ∂∆V/∂η vs i0/iLIM master curve (Fig. 10b) with the iterative least square method. Such master curves must be obtained before applying this protocol P2. The curves proposed in Fig. 10b were built with results found for the 18 rebars embedded in the widely differing mortars analyzed in this study (Table 1): namely by using the ∂∆V/∂η factors obtained with PSValt (according to Fig. 9) as the ordinates (Y-axis) and the i0/iLIM ratio obtained with PSVsh (according to Fig. 5b) as abscissas (X-axis).
$$\partial \Delta \mathrm{V}/{\partial\upeta }_{ \left(\mathrm{A}\right)}=1.0144\cdot (1+{({\mathrm{i}}_{0}/{\mathrm{i}}_{\mathrm{LIM }(\mathrm{A})})}^{-1.4608})$$(3)$$\partial \Delta \mathrm{V}/{\partial\upeta }_{ \left(\mathrm{C}\right)}=1.1075\cdot (1+{({\mathrm{i}}_{0}/{\mathrm{i}}_{\mathrm{LIM }(\mathrm{C})})}^{-0.9799})$$(4) -
(iii)
Protocol P3, depicted in Fig. 10c, consists in applying the ∂∆V/∂η factor (protocol P2) to the η range (ηMIN and ηMAX) in which the Tafel lines lie (protocol P1). The result is the ∆V value for the three anodic pulses (+ ∆V1, + ∆V2 and + ∆V3) according to Eqs. (5, 6, 7), and the three cathodic pulses (− ∆V1, − ∆V2 and − ∆V3) according to Eqs. (8, 9, 10), which are applied in the sequence shown in Fig. 1b to measure corrosion rate. This ensures due correction for the ohmic drop and therefore the reliability of PSV for determining iCORR (along with RS, CDL and B) for the steel–concrete system at issue.
$$+\Delta \mathrm{V}1 \left(\mathrm{V}\right)={\upeta }_{\mathrm{MIN }(\mathrm{A})}\cdot \partial \Delta \mathrm{V}/\partial {\upeta }_{ (\mathrm{A})}$$(5)$$+\Delta \mathrm{V}3 \left(\mathrm{V}\right)={\upeta }_{\mathrm{MAX }(\mathrm{A})}\cdot \partial \Delta \mathrm{V}/\partial {\upeta }_{ (\mathrm{A})}$$(6)$$+\Delta \mathrm{V}2 \left(\mathrm{V}\right)=(+\Delta \mathrm{V}1)+((+\Delta \mathrm{V}3)-(+\Delta \mathrm{V}1))/2$$(7)$$-\Delta \mathrm{V}1 \left(\mathrm{V}\right)={\upeta }_{\mathrm{MIN }(\mathrm{C})}\cdot \partial \Delta \mathrm{V}/\partial {\upeta }_{ (\mathrm{C})}$$(8)$$-\Delta \mathrm{V}3 \left(\mathrm{V}\right)={\upeta }_{\mathrm{MAX }(\mathrm{C})}\cdot \partial \Delta \mathrm{V}/\partial {\upeta }_{ (\mathrm{C})}$$(9)$$-\Delta \mathrm{V}2 \left(\mathrm{V}\right)=(-\Delta \mathrm{V}1)+((-\Delta \mathrm{V}1)-(-\Delta \mathrm{V}3))/2$$(10)

Procedure proposed to factor the ohmic drop in PSV measurements into calculations to determine iCORR: a protocol P1 to determine the range of η values in which the Tafel lines lie; b protocol P2 to determine the ohmic drop factor; and c protocol P3, based on P1 and P2 results, to calculate the pulse amplitudes to be applied in (d) PSV corrosion rate measurement
The three protocols described (P1, P2 and P3) are intended to adapt the pulse amplitudes ± ∆V1, ± ∆V2 and ± ∆V3 of the pulse sequence in Fig. 1b depending on the shape of the polarization curve and the ohmic drop. It is intended for the PSV technique to be reliably implemented to assess corrosion in any cement-based material. For a better understanding, Appendix 2 includes a case study of the protocols P1, P2 and P3 proposed. The calculations required for each protocol are detailed therein, which, due to their simplicity, could be automated for implementation in monitoring routines by using computerized systems. In this regard, it should be noted that the pulse sequence in Figs. 1b, and 10d, was designed in the previous work [39] to reduce the test time to the maximum (650 s), which is interesting in laboratory studies where multiple measurements must usually be performed on different samples. However, in the case of implementing the procedure in automated monitoring systems, the lower measurement frequency would allow to increase the test time, so it would be feasible to increase the number of points used to construct each Tafel line (e.g., 5 points) to further improve the reliability of the method.
In fact, the ultimate claim is to incorporate the procedure of Fig. 10 into the corrosion rate monitoring sensor for new reinforced concrete constructions developed by the authors [40]. As it is intended for large structures, the WE of the sensor is usually larger than that of the laboratory cell used in this work, which could favor the appearance of corrosion macrocells in the former, such as localized corrosion during the early stages of chloride-induced corrosion.
5 Conclusions
Potential step voltammetry (PSV) technique was introduced in earlier works [39, 40] as an alternative to traditional methods for corrosion rate monitoring in reinforced concrete. It is based on the Tafel intersection method, but corrosion rate, together with concrete electrical resistance and double layer capacitance, is obtained accurately, much more quickly and without risking irreversible alterations in the reinforcement. PSV was validated in previous studies on fairly narrowly defined steel–concrete systems. This study aimed to update PSV to guarantee its reliability beyond the circumstances for which it was initially designed and therefore to maximize its applicability. It therefore explored a procedure for adjusting PSV pulse amplitudes (∆V) depending on the steel–concrete system to be assessed in order to ensure that Tafel slopes can be obtained within the corresponding linear region of the polarization curve and, therefore, corrosion rate can be estimated. The conclusions drawn from the experimental findings in mortars with varying ohmic drop values and polarization curves with differing morphologies are set out below.
-
Two factors must be determined to choose a suitable ∆V value: (1) the range of η in which the Tafel lines lie on the polarization curve; and (2) the ohmic drop.
-
As the η range (factor 1) is not normally subject to any substantive short-term change, it need only be determined sporadically (using protocol P1), either prior to a given study or occasionally during PSV-based structural monitoring. A spectrum of pulses, with amplitudes (∆V) from ± 0.035 to ± 0.280 V, should be applied to plot the full polarization curve from which to reliably establish where the Tafel lines lie. This method delivers results in less time and, given that P1 need only be applied sporadically, with much less risk of irreversible changes to the rebar due to the amount of charge accumulated during polarization than in traditional linear sweep voltammetry (LSV).
-
The polarization curves obtained with PSV (protocol P1) for the mortars studied exhibited linear regions (for Tafel lines determination) more clearly than the LSV curves, particularly on the anodic branch, which as a rule yielded steeper Tafel lines. This could be associated with possible difficulties for the diffusion of oxides generated during anodic LSV scans, which would give anodic branches under diffusion control, especially in specimens where Fe(OH)2 and/or FeCl2 formation was favored. The outcome was higher values for the bA, bC and B Tafel coefficients in LSV. On the contrary, PSV prevents excessive oxide accumulation in the system, so it is less affected by possible diffusion control phenomena. The B values obtained by PSV substantially improved LPR iCORR calculations with respect to using B values found with LSV or assuming B = 0.026 V. In any case, iCORR results obtained with all techniques were consistent with the corrosion probability based on the ECORR measurements.
-
As ohmic drop (factor 2) may vary frequently due to changes in the level of pore saturation, temperature or similar, protocol P2 should be applied with each PSV corrosion rate measurement. That involves determining the faradic (iLIM) and non-faradic (i0) current for 10 s anodic and cathodic potentiostatic pulses. Where the i0/iLIM value is known, the ohmic drop can be found with the ∂∆V/∂η vs i0/iLIM master curves given by way of reference in this paper.
-
By means of a simple calculation process (protocol P3), the information collected in P1 and P2 is used to adjust the amplitude (∆V) of the potentiostatic pulse sequence applied in PSV depending on the shape of the polarization curve and the ohmic drop of the system.
-
The use of the procedure proposed (protocols P1, P2 and P3) obviates the need to assume preset ∆V values which may be a source of error in corrosion rate determination. This is an improvement over standard techniques for in situ structural inspection such as LPR, where the preset value of the Stern and Geary constant B may introduce an error factor of up to 2, and, if the ohmic drop is not adequately compensated the error could be significantly higher.
-
It has been proved that PSV provides corrosion rate, along with a number of relevant corrosion parameters including the Tafel slopes, without significantly disturbing the steel–concrete system assessed. That constitutes an advantageous position, since comparable techniques required to collect similarly data are often too complex and time-consuming to be used for on-site corrosion monitoring.
-
Protocols P1, P2 and P3 could be perfectly automated using computerized programs, which would allow their incorporation into PSV corrosion monitoring routines in reinforced concrete. To this end, the implementation of the PSV method in real structures needs to be further explored.
Data Availability
The data presented in this study are available on request from the corresponding author. The data are not publicly available due to privacy/ethical restrictions.
References
Papavinasam, S.: Electrochemical polarization techniques for corrosion monitoring. In: Yang, L. (ed.) Techniques for Corrosion Monitoring, pp. 45–77. Woodhead Publishing, Sawston (2021). https://doi.org/10.1016/B978-0-08-103003-5.00003-5
Chang, Z.T., Cherry, B., Marosszeky, M.: Polarisation behaviour of steel bar samples in concrete in seawater. Part 1: experimental measurement of polarisation curves of steel in concrete. Corros. Sci. 50, 357–364 (2008). https://doi.org/10.1016/j.corsci.2007.08.009
Martínez, I., Andrade, C.: Examples of reinforcement corrosion monitoring by embedded sensors in concrete structures. Cem. Concr. Compos. 31, 545–554 (2009). https://doi.org/10.1016/j.cemconcomp.2009.05.007
Andrade, C., Martínez, I.: Techniques for measuring the corrosion rate (polarization resistance) and the corrosion potential of reinforced concrete structures. In: Maierhofer, C., Reinhardt, H.W., Dobmann, G. (eds.) Non-Destructive Evaluation of Reinforced Concrete Structures, vol. 2, pp. 284–316. Woodhead Publishing, Sawston (2010). https://doi.org/10.1016/j.cemconcomp.2009.05.007
Martínez, I., Andrade, C.: Polarization resistance measurements of bars embedded in concrete with different chloride concentrations: EIS and DC comparison. Mater. Corros. 62, 932–942 (2011). https://doi.org/10.1002/maco.200905596
Stern, M., Geary, A.L.: Electrochemical polarization. I. A theoretical analysis of the shape of polarization curves. J. Electrochem. Soc. 104, 56–63 (1957). https://doi.org/10.1149/1.2428496
González, J.A., Albéniz, J., Feliu, S.: Valores de la constante B del método de resistencia de polarización para veinte sistemas metal-medio diferentes. Rev. Met. 32, 10–17 (1996). https://doi.org/10.3989/revmetalm.1996.v32.i1.926
UNE 112072:2011 Spanish Standard, Laboratory Measurement of Corrosion Speed Using the Polarization Resistance Technique (2011)
Andrade, C., Alonso, C.: Test methods for on-site corrosion rate measurement of steel reinforcement in concrete by means of the polarization resistance method. Mater. Struct. 37, 623–643 (2004). https://doi.org/10.1007/BF02483292
Andrade, C., Martínez, I., Alonso, C., Fullea, J.: New advanced electrochemical techniques for on site measurements of reinforcement corrosion. Mater. Constr. 51, 97–107 (2001). https://doi.org/10.3989/mc.2001.v51.i263-264.356
Scully, J.R.: Polarization resistance method for determination of instantaneous corrosion rates. Corrosion 56, 199–218 (2000). https://doi.org/10.5006/1.3280536
Glass, G.K., Page, C.L., Short, N.R., Yu, S.W.: An investigation of galvanostatic transient methods used to monitor the corrosion rate of steel in concrete. Corros. Sci. 35, 1585–1592 (1993). https://doi.org/10.1016/0010-938X(93)90388-W
Elsener, B., Wojtas, H., Böhni, H. Galvanostatic pulse measurements-rapid on site corrosion monitoring in Corrosion and corrosion protection of steel in concrete. In: Proceedings of International conference held at the University of Sheffield, 24–28 July 1994, vol. 1 (1994)
Walter, G.W.: Problems arising in the determination of accurate corrosion rates from polarization resistance measurements. Corros. Sci. 17, 983–993 (1977). https://doi.org/10.1016/S0010-938X(77)80013-9
Law, D.W., Millard, S.G., Bungey, J.H.: Galvanostatic pulse measurements of passive and active reinforcing steel in concrete. Corrosion 56, 48–56 (2000). https://doi.org/10.5006/1.3280522
Frølund, T., Jensen, M.F., Bassler, R. Determination of reinforcement corrosion rate by means of the galvanostatic pulse technique. In: First International Conference on Bridge Maintenance, Safety and Management IABMAS. Barcelona (Spain), 14–17 July, 2002 (2002)
Vedalakshmi, R., Balamurugan, L., Saraswathy, V., Kim, S.H., Ann, K.Y.: Reliability of galvanostatic pulse technique in assessing the corrosion rate of rebar in concrete structures: laboratory vs field studies. KSCE J. Civ. Eng. 14, 867–877 (2010). https://doi.org/10.1007/s12205-010-1023-6
Xu, J., Yao, W.: Detecting the efficiency of cathodic protection in reinforced concrete by use of Galvanostatic pulse technique. In: Bao, Y., Tian, L., Gong, J. (eds.) Advanced Materials Research, vol. 177, pp. 584–589. Trans Tech Publications Ltd, Bäch (2011). https://doi.org/10.4028/www.scientific.net/AMR.177.584
Dou, Y.T., Hao, B.H., Meng, B., Xie, J., Dong, M.L., Zhang, A.L.: The study to the corrosion of reinforcing steel in concrete by using Galvanostatic Pulse Technique. Appl. Mech. Mater. 501, 916–919 (2014). https://doi.org/10.4028/www.scientific.net/AMM.501-504.916
Feliu, V., Gonzalez, J.A., Feliu, S.: Corrosion estimates from the transient response to a potential step. Corros. Sci. 49, 3241–3255 (2007). https://doi.org/10.1016/j.corsci.2007.03.004
Elsener, B., Klinghoffer, O., Frolund, T., Rislund, E., Schiegg, Y., Bohni, H.: Assessment of reinforcement corrosion by means of galvanostatic pulse technique. In: Blankvoll, A. (ed) Proceeding of the International Conference on Repair of Concrete Structures, Norwegian Public Roads Administration, Svolvaer, Norway, pp. 391–400 (1997)
Glass, G.K., Page, C.L., Short, N.R., Zhang, J.Z.: The analysis of potentiostatic transients applied to the corrosion of steel in concrete. Corros. Sci. 39, 1657–1663 (1997). https://doi.org/10.1016/S0010-938X(97)00071-1
Andrade, C., Soler, L., Alonso, C., Novoa, X.R., Keddam, M.: The importance of geometrical considerations in the measurement of steel corrosion in concrete by means of AC impedance. Corros. Sci. 37, 2013–2023 (1995). https://doi.org/10.1016/0010-938X(95)00095-2
Newton, C.J., Sykes, J.M.: A galvanostatic pulse technique for investigation of steel corrosion in concrete. Corros. Sci. 28, 1051–1074 (1988). https://doi.org/10.1016/0010-938X(88)90101-1
Jin, M., Ma, Y., Zeng, H., Liu, J., Jiang, L., Yang, G., Gu, Y.: Developing a multi-element sensor to non-destructively monitor several fundamental parameters related to concrete durability. Sensors 20, 5607 (2020). https://doi.org/10.3390/s20195607
Rybalka, K.V., Beketaeva, L.A., Davydov, A.D.: Estimation of corrosion current by the analysis of polarization curves: electrochemical kinetics mode. Russ. J. Electrochem. 50, 108–113 (2014). https://doi.org/10.1134/S1023193514020025
Barnartt, S.: Two-point and three-point methods for the investigation of electrode reaction mechanisms. Electrochim. Acta 15, 1313–1324 (1970). https://doi.org/10.1016/0013-4686(70)80051-2
Beleevskii, V.S., Kudelin, Y.I.: Calculation of corrosion rate and Tafel constants from two or three values of polarization current of the same sign near corrosion potential. Zashch Met. 25, 80–85 (1989)
Jankowski, J., Juchniewicz, R.: A four-point method for corrosion rate determination. Corros. Sci. 20, 841–851 (1980). https://doi.org/10.1016/0010-938X(80)90118-3
Rocchini, G.: The determination of tafel slopes by the successive approximation method. Corros. Sci. 37, 987–1003 (1995). https://doi.org/10.1016/0010-938X(95)00009-9
Mansfeld, F.: Tafel slopes and corrosion rates obtained in the pre-Tafel region of polarization curves. Corros. Sci. 47, 3178–3186 (2005). https://doi.org/10.1016/j.corsci.2005.04.012
Beleevskii, V.S., Konev, K.A., Novosadov, V.V., Vasil’ev, V.Y.: Estimating corrosion current and tafel constants from the curvature of voltammetric curves near the free-corrosion potential. Prot. Met. 40, 566–569 (2004). https://doi.org/10.1023/B:PROM.0000049521.65336.25
Lakshminarayanan, V., Rajagopalan, S.R.: Applications of exponential relaxation methods for corrosion studies and corrosion rate measurement. In: Proceedings of the Indian Academy of Sciences-Chemical Sciences, pp. 465–477. Springer (1986)
Gao, J., Wu, J., Li, J., Zhao, X.: Monitoring of corrosion in reinforced concrete structure using Bragg grating sensing. Ndt E Int. 44, 202–205 (2011). https://doi.org/10.1016/j.ndteint.2010.11.011
Fan, L., Bao, Y., Meng, W., Chen, G.: In-situ monitoring of corrosion-induced expansion and mass loss of steel bar in steel fiber reinforced concrete using a distributed fiber optic sensor. Compos. Part B: Eng. 165, 679–689 (2019). https://doi.org/10.1016/j.compositesb.2019.02.051
Andringa, M.M., Neikirk, D.P., Dickerson, N.P., Wood, S.L.: Unpowered wireless corrosion sensor for steel reinforced concrete. In: SENSORS, 2005 IEEE, p. 4. IEEE (2005). https://doi.org/10.1109/ICSENS.2005.1597659
Degala, S., Rizzo, P., Ramanathan, K., Harries, K.A.: Acoustic emission monitoring of CFRP reinforced concrete slabs. Constr. Build Mater. 23, 2016–2026 (2009). https://doi.org/10.1016/j.conbuildmat.2008.08.026
Mustapha, S., Lu, Y., Li, J., Ye, L.: Damage detection in rebar-reinforced concrete beams based on time reversal of guided waves. Struct. Health Monit. 13, 347–358 (2014). https://doi.org/10.1177/1475921714521268
Ramón, J.E., Gandía-Romero, J.M., Bataller, R., Alcañiz, M., Valcuende, M., Soto, J.: Potential step voltammetry: an approach to corrosion rate measurement of reinforcements in concrete. Cem. Concr. Compos. 110, 103590 (2020). https://doi.org/10.1016/j.cemconcomp.2020.103590
Ramón, J.E.: Sistema de Sensores Embebidos para Monitorizar la Corrosión en Estructuras de Hormigón Armado. Fundamentos, Metodología y Aplicaciones, Ph.D. Thesis, Universitat Politècnica de València, València (Spain) (2018). https://doi.org/10.4995/Thesis/10251/111823
Ramón, J.E., Martínez-Ibernón, A., Gandía-Romero, J.M., Fraile, R., Bataller, R., Alcañiz, M., García-Breijo, E., Soto, J.: Characterization of electrochemical systems using potential step voltammetry. Part I: Modeling by means of equivalent circuits. Electrochim. Acta 323, 134702 (2019). https://doi.org/10.1016/j.electacta.2019.134702
Martínez-Ibernón, A., Ramón, J.E., Gandía-Romero, J.M., Gasch, I., Valcuende, M., Alcañiz, M., Soto, J.: Characterization of electrochemical systems using potential step voltammetry. Part II: Modeling of reversible systems. Electrochim. Acta 328, 135111 (2019). https://doi.org/10.1016/j.electacta.2019.135111
Moreno, M., Morris, W., Alvarez, M.G., Duffó, G.S.: Corrosion of reinforcing steel in simulated concrete pore solutions: effect of carbonation and chloride content. Corros. Sci. 46, 2681–2699 (2004). https://doi.org/10.1016/j.corsci.2004.03.013
Chang, Z.T., Cherry, B., Marosszeky, M.: Polarisation behaviour of steel bar samples in concrete in seawater. Part 2: a polarisation model for corrosion evaluation of steel in concrete. Corros. Sci. 50, 3078–3086 (2008). https://doi.org/10.1016/j.corsci.2008.08.021
Alcañiz, M., Bataller, R., Gandía-Romero, J.M., Ramón, J.E., Soto, J., Valcuende, M.: Sensor, red de sensores, método y programa informático para determinar la corrosión en una estructura de hormigón armado, invention patent No. ES2545669, Publication date 19 January 2016.
Feliu, S., González, J.A., Miranda, J.M., Feliu, V.: Possibilities and problems of in situ techniques for measuring steel corrosion rates in large reinforced concrete structures. Corros. Sci. 47, 217–238 (2005). https://doi.org/10.1016/j.corsci.2004.04.011
Feliu, S., Gonzalez, J.A., Andrade, C., Feliu, V.: The determination of the corrosion rate of steel in concrete by a non-stationary method. Corros. Sci. 26, 961–970 (1986). https://doi.org/10.1016/0010-938X(86)90086-7
Sagüés, A.A., Kranc, S.C., Moreno, E.I.: Evaluation of electrochemical impedance with constant phase angle component from the galvanostatic step response of steel in concrete. Electrochim. Acta 41, 1239–1243 (1996). https://doi.org/10.1016/0013-4686(95)00476-9
Sagüés, A.A., Kranc, S.C., Moreno, E.I.: An improved method for estimating polarization resistance from small-amplitude potentiodynamic scans in concrete. Corrosion 54, 20–28 (1998). https://doi.org/10.5006/1.3284824
Gonzalez, J.A., Miranda, J.M., Birbilis, N., Feliu, S.: Electrochemical techniques for studying corrosion of reinforcing steel: Limitations and advantages. Corrosion 61, 37–50 (2005). https://doi.org/10.5006/1.3278158
Bastidas, D.M., González, J.A., Feliu, S., Cobo, A., Miranda, J.M.: A quantitative study of concrete-embedded steel corrosion using potentiostatic pulses. Corrosion 63, 1094–1100 (2007). https://doi.org/10.5006/1.3278327
Hornbostel, K., Larsen, C.K., Geiker, M.R.: Relationship between concrete resistivity and corrosion rate–A literature review. Cem. Concr. Compos. 39, 60–72 (2013). https://doi.org/10.1016/j.cemconcomp.2013.03.019
Qian, S., Zhang, J., Qu, D.: Theoretical and experimental study of microcell and macrocell corrosion in patch repairs of concrete structures. Cem. Concr. Compos. 28, 685–695 (2006). https://doi.org/10.1016/j.cemconcomp.2006.05.010
Ramón, J.E., Martínez, I., Gandía-Romero, J.M., Soto, J.: An embedded-sensor approach for concrete resistivity measurement in on-site corrosion monitoring: cell constants determination. Sensors 21, 2481 (2021). https://doi.org/10.3390/s21072481
ASTM G59–97: Standard Test Method for Conducting Potentiodynamic Polarization Resistance Measurements. ASTM International, West Conshohocken, PA (2020). http://www.astm.org/cgi-bin/resolver.cgi?G59. Accessed 8 Feb 2022.
Poursaee, A.: Determining the appropriate scan rate to perform cyclic polarization test on the steel bars in concrete. Electrochim Acta 55, 1200–1206 (2010). https://doi.org/10.1016/j.electacta.2009.10.004
ASTM G5–14e1: Standard Reference Test Method for Making Potentiodynamic Anodic Polarization Measurements. ASTM International, West Conshohocken, PA (2014). http://www.astm.org/cgi-bin/resolver.cgi?G5. Accessed 8 Feb 2022.
Jerkiewicz, G., Vatankhah, G., Lessard, J., Soriaga, M.P., Park, Y.S.: Surface-oxide growth at platinum electrodes in aqueous H2SO4: reexamination of its mechanism through combined cyclic-voltammetry, electrochemical quartz-crystal nanobalance, and Auger electron spectroscopy measurements. Electrochim. Acta 49, 1451–1459 (2004). https://doi.org/10.1016/j.electacta.2003.11.008
Cherevko, S., Topalov, A.A., Zeradjanin, A.R., Katsounaros, I., Mayrhofer, K.J.J.: Gold dissolution: towards understanding of noble metal corrosion. Rsc Adv. 3, 16516–16527 (2013). https://doi.org/10.1039/C3RA42684J
Joiret, S., Keddam, M., Novoa, X.R., Perez, M.C., Rangel, C., Takenouti, H.: Use of EIS, ring-disk electrode, EQCM and Raman spectroscopy to study the film of oxides formed on iron in 1 M NaOH. Cem. Concr. Compos. 24, 7–15 (2002). https://doi.org/10.1016/S0958-9465(01)00022-1
Sánchez, M., Gregori, J., Alonso, C., García-Jareño, J.J., Takenouti, H., Vicente, F.: Electrochemical impedance spectroscopy for studying passive layers on steel rebars immersed in alkaline solutions simulating concrete pores. Electrochim. Acta 52, 7634–7641 (2007). https://doi.org/10.1016/j.electacta.2007.02.012
Liu, X., MacDonald, D.D., Wang, M., Xu, Y.: Effect of dissolved oxygen, temperature, and pH on polarization behavior of carbon steel in simulated concrete pore solution. Electrochim. Acta 366, 137437 (2021). https://doi.org/10.1016/j.electacta.2020.137437
Byfors, K.: Influence of silica fume and flyash on chloride diffusion and pH values in cement paste. Cem. Concr. Res. 17, 115–130 (1987). https://doi.org/10.1016/0008-8846(87)90066-4
Osmanovic, Z., Haračić, N., Zelić, J.: Properties of blastfurnace cements (CEM III/A, B, C) based on Portland cement clinker, blastfurnace slag and cement kiln dusts. Cem. Concr. Compos. 91, 189–197 (2018). https://doi.org/10.1016/j.cemconcomp.2018.05.006
Andrade, C., Keddam, M., Nóvoa, X.R., Pérez, M.C., Rangel, C.M., Takenouti, H.: Electrochemical behaviour of steel rebars in concrete: influence of environmental factors and cement chemistry. Electrochim. Acta 46, 3905–3912 (2001). https://doi.org/10.1016/S0013-4686(01)00678-8
Wang, Y., Liu, C., Wang, Y., Li, Q., Yan, B.: Semi-empirical prediction model of chloride-induced corrosion rate in uncracked reinforced concrete exposed to a marine environment. Electrochim. Acta 331, 135376 (2020). https://doi.org/10.1016/j.electacta.2019.135376
Vetter, K.J., Schultze, J.W.: The kinetics of the electrochemical formation and reduction of monomolecular oxide layers on platinum in 0.5 M H2SO4: Part II. Galvanostatic pulse measurements and the model of oxide growth. J. Electroanal. Chem. Interfacial Electrochem. 34, 141–158 (1972). https://doi.org/10.1016/S0022-0728(72)80510-2
ASTM C876 − 15, Standard Test Method for Corrosion Potentials of Uncoated Reinforcing Steel in Concrete. West Conshohocken, PA (2015).
Angst, U., Elsener, B., Larsen, C.K., Vennesland, Ø.: Chloride induced reinforcement corrosion: rate limiting step of early pitting corrosion. Electrochim. Acta 56, 5877–5889 (2011). https://doi.org/10.1016/j.electacta.2011.04.124
Koga, G.Y., Albert, B., Roche, V., Nogueira, R.P.: A comparative study of mild steel passivation embedded in Belite-Ye’elimite-Ferrite and Porland cement mortars. Electrochim. Acta 261, 66–77 (2018). https://doi.org/10.1016/j.electacta.2017.12.128
Ha, T.H., Muralidharan, S., Bae, J.H., Ha, Y.C., Lee, H.G., Park, K.W., Kim, D.K.: Effect of unburnt carbon on the corrosion performance of fly ash cement mortar. Constr. Build. Mater. 19, 509–515 (2005). https://doi.org/10.1016/j.conbuildmat.2005.01.005
Nguyen, Q.D., Castel, A.: Reinforcement corrosion in limestone flash calcined clay cement-based concrete. Cem. Concr. Res. 132, 106051 (2020). https://doi.org/10.1016/j.cemconres.2020.106051
Poursaee, A.: Potentiostatic transient technique, a simple approach to estimate the corrosion current density and Stern-Geary constant of reinforcing steel in concrete. Cem. Concr. Res. 40, 1451–1458 (2010). https://doi.org/10.1016/j.cemconres.2010.04.006
Vedalakshmi, R., Thangavel, K.: Reliability of electrochemical techniques to predict the corrosion rate of steel in concrete structures. Arab. J. Sci. Eng. 36, 769–783 (2011). https://doi.org/10.1007/s13369-011-0082-4
Acknowledgements
The authors gratefully acknowledge the invaluable assistance provided by Manuel Portillo and Ana Labanda, IETcc-CSIC laboratory technicians, in the experiments conducted.
Funding
Open Access funding provided thanks to the CRUE-CSIC agreement with Springer Nature. This work was supported by the pre-doctoral scholarship granted to Jose Enrique Ramon Zamora by the Spanish Ministry of Science and Innovation (Grant Number FPU13/00911). We would also like to acknowledge financial support from the Spanish Ministry of Science and Innovation through the national programs of oriented research, development and innovation to societal challenges (Project Numbers BIA2016-78460-C3-3-R, PID2020-119744RB-C21 and PID2020-119744RB-C22). To the Universitat Politècnica de València for the financial support in the project “Ayudas a Primeros Proyectos de Investigación (PAID-06-18)”—SP20180245.
Author information
Authors and Affiliations
Contributions
Conceptualisation, JER, JS and IM; methodology, JER; software, JER; validation, JER; formal analysis, JER, IM and JMGR; investigation, JER; resources, IM, JMGR and JS; data curation, JER; writing—original draft preparation, JER.; writing—review and editing, JER, IM, JMGR. and JS; visualisation, JER; supervision, IM, JMGR and JS; project administration, IM and JMGR; funding acquisition, IM, JMGR and JS. All authors have read and agreed to the published version of the manuscript.
Corresponding author
Ethics declarations
Conflict of interest
The authors declare no competing interests to disclose.
Additional information
Publisher's Note
Springer Nature remains neutral with regard to jurisdictional claims in published maps and institutional affiliations.
Appendices
Appendix 1
This appendix contains the calculation proposed to estimate the theoretical charge density to be extracted from a carbon steel working electrode (WE) to produce the oxidation of a layer of Fe atoms. This charge, referred to as QL, can be estimated to be 0.607 mC/cm2 by following the steps below.
First, the amount of iron atoms (NFe) is determined as a function of moles of Fe (n) present in the carbon steel sample as:
where NA is the Avogadro constant.
Considering that n is equal to the sample weight (m) divided by the atomic mass (M) of steel we obtain:
here m is equal to the steel density (ρ) multiplied by the sample volume (V), so Eq. (12) can be rewritten as:
The NFe per unit volume (atoms/cm3) is obtained by applying 1/V to both sides of Eq. (13), resulting:
It must be assumed that the metal sample to be evaluated is a 1-cm edge cube and that the oxidation occurs on one of its faces. The NFe in the cube (Eq. 14) raised to 1/3 gives the NFe in one of the cube edges (atom/cm):
The NFe contained in 1-cm2 steel area (atom/cm2) is equal to the NFe in one face of the cube, which is obtained by squaring Eq. (15):
The charge density required to produce the oxidation of a Fe atomic monolayer in a 1-cm2 steel sample, QL (C/cm2), is obtained by multiplying the NFe from Eq. (16) by the number of electrons released in the Fe oxidation process (z) and the electron charge (qe):
As is known, in the carbon steel bars usually used in reinforced concrete, the Fe content is approximately 98 wt%, therefore, a factor k = 0.98 should be included in Eq. (17), resulting:
If constants in Eq. (18) are replaced by their tabulated value (z = 2 e-, qe = 1.602 × 10⁻¹⁹, ρ = 7.874 g/cm3, M = 55.847 g/mol, NA = 6.022 × 10²³ and k = 0.98) we obtain QL = 0.607 × 10⁻³ C/cm2 = 0.607 mC/cm2, i.e. the estimated theoretical charge density to be extracted from the carbon steel WE to produce the oxidation of a Fe monolayer. The number of Fe layers that can be considered altered when applying the measurement technique under study could be estimated by dividing the charge transferred in the anodic polarization (QA) by QL. If the WE is in the passive state, QL could be associated not only to the Fe oxidation, but also to the partial oxidation of the ferrous oxide (FeO) and/or ferrous hydroxide (Fe(OH)2) to ferrosoferric oxide (Fe3O4) [60,61,62].
Appendix 2
This appendix illustrates a study case on the application of the procedure proposed in Fig. 10 for adjusting PSV pulse amplitudes (∆V) depending on the steel–concrete system to be assessed and, thus, reliably determining its corrosion current density (iCORR). A hypothetical steel–concrete system is considered here. The following sections show the application of the procedure according to the three proposed steps: protocol P1, protocol P2 and protocol P3. The final section (Sect. 2.4) shows how the information obtained by the proposed procedure intervenes in the corrosion measurement with the PSV technique.
It should be recalled that protocol P1 is needed only to be deployed from time to time, since here PSV is supposed to be implemented for continuous structural monitoring. Frequent application is not required, since possible changes in the η-range in which the Tafel lines lie, assumed to be related with variations in the electrochemical behavior of the steel–concrete system, occur over the medium- or long-term. In contrast, protocols P2 and P3 must be applied with each PSV corrosion rate measurement, since ohmic drop may vary frequently due to changes in the level of pore saturation, temperature or similar.
2.1 Protocol P1
This protocol P1 is intended to determine the η range in which the anodic and cathodic Tafel lines lie. The PSValt sequencing pattern shown in Fig. 11a is applied to determine the full polarization curve of the system shown in Fig. 11b. The curve is composed of 8 points on its anodic branch and another 8 on its cathodic branch. Table 5 shows the applied potential (± ∆V), the overpotential (η) and the logarithm of the current density (Log10|i|) for each of the points on the curve.
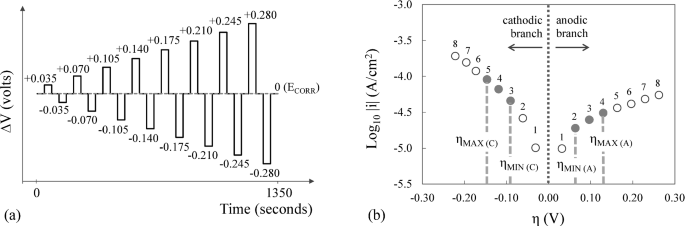
a PSValt technique applied to obtain b the full polarization curve of the system. Each branch of the curve (anodic and cathodic) is composed of 8 i-η points
For each branch of the polarization curve (anodic and cathodic), the three consecutive i-η points closest to the corrosion potential (ECORR, η = 0) and which in turn have a high R2 (> 0.9900) are found to ensure that they are located in the linear or "Tafelian" zone. As shown in Table 6, the selected points that meet this condition are 2–3–4 in the anodic branch and 3–4–5 in the cathodic branch. Of the three points on each branch, the η of the one closest to the ECORR (η = 0) corresponds to ηMIN and the η of the one furthest away to ηMAX. The result finally obtained for ηMIN and ηMAX is presented in Table 7, which is required to apply the next part of the procedure: P2 protocol.
2.2 Protocol P2
This protocol P2 is intended to obtain the ∂∆V/∂η factors (anodic and cathodic) required to select those PSV pulse amplitudes (∆V) which are most suitable to compensate the ohmic drop of the system.
The PSVsh sequencing pattern shown in Fig. 12a is applied. The current–time response is used to determine the i0/iLIM ratio for both the anodic pulses, i0/iLIM (A), and cathodic pulses, i0/iLIM (C) (Fig. 12b). Entering the corresponding i0/iLIM value in the equation for the respective ∂∆V/∂η vs i0/iLIM master curve (Fig. 13) yields the ∂∆V/∂η correction factors. The result finally obtained for ∂∆V/∂η(A) and ∂∆V/∂η(C) is presented in Table 8. This information, together with that obtained for ηMIN and ηMAX in protocol P2 (Table 7), allows to apply the next part of the procedure: protocol P3.

a PSVsh technique applied and b the i-t response obtained, which is analyzed to determine the i0/iLIM ratio for both the anodic pulses, i0/iLIM (A), and cathodic pulses, i0/iLIM (C)
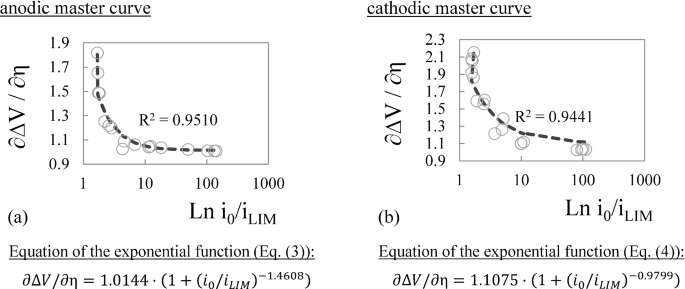
a Anodic and b cathodic master curves (∂∆V/∂η vs i0/iLIM) with their respective equations
2.3 Protocol P3
The protocol P3 is intended to calculate those pulse amplitudes (∆V) which are most suitable to compensate the ohmic drop when PSV pattern of Fig. 1b is applied. This is the PSV sequencing pattern proposed in the previous work [39] to measure corrosion rate.
Protocol P3 simply consists in applying the ∂∆V/∂η factor obtained with protocol P2 (Table 8) to the η-range (ηMIN and ηMAX) obtained with protocol P1 (Table 7). The result is the ∆V value for the three anodic pulses (+ ∆V1, + ∆V2 and + ∆V3) according to Eqs. (5, 6, 7), and the three cathodic pulses (− ∆V1, − ∆V2 and − ∆V3) according to Eqs. (8, 9, 10), which are applied in the sequence shown in Fig. 1b. Table 9 shows the results obtained with protocol P3. The ± ∆V values obtained are the amplitudes to be used in the corrosion rate measurement with PSV, as described in Sect. 2.4.
2.4 Corrosion Rate Measurement with PSV
Once the procedure composed of protocols P1, P2 and P3 has been applied, the PSV technique can be applied as proposed in a previous work [39]. The pulse amplitudes to be used (± ∆V1, ± ∆V2 and ± ∆V3) are those determined in protocol P3 (Table 9), which guarantee that the corrosion density measurement (iCORR) is reliable, since the values of ± ∆V were selected depending on the shape of the polarization curve and the ohmic drop. The scheme in Fig. 14 shows how the information obtained by the proposed procedure (protocols P1, P2 and P3) would intervene in the corrosion measurement with the PSV technique in the hypothetical steel–concrete system considered in this case study.

Part-I: General scheme of the procedure composed by protocols P1, P2 and P3, highlighting the information obtained in each one of them. Part-II: General scheme of the PSV test that would be applied to determine the corrosion density (iCORR). As can be seen, first the protocols of Part-I are applied to determine the amplitude (± ∆V) to be used in the corrosion measurement of Part-II
Rights and permissions
Open Access This article is licensed under a Creative Commons Attribution 4.0 International License, which permits use, sharing, adaptation, distribution and reproduction in any medium or format, as long as you give appropriate credit to the original author(s) and the source, provide a link to the Creative Commons licence, and indicate if changes were made. The images or other third party material in this article are included in the article's Creative Commons licence, unless indicated otherwise in a credit line to the material. If material is not included in the article's Creative Commons licence and your intended use is not permitted by statutory regulation or exceeds the permitted use, you will need to obtain permission directly from the copyright holder. To view a copy of this licence, visit http://creativecommons.org/licenses/by/4.0/.
About this article

Cite this article
Ramón, J.E., Martínez, I., Gandía-Romero, J.M. et al. Improved Tafel-Based Potentiostatic Approach for Corrosion Rate Monitoring of Reinforcing Steel. J Nondestruct Eval 41, 70 (2022). https://doi.org/10.1007/s10921-022-00903-z
Received:
Accepted:
Published:
DOI: https://doi.org/10.1007/s10921-022-00903-z