
Abstract
Adaptability, that is, the capacity to accommodate future changes, is described as an intrinsic aspect of sustainable housing. Nevertheless, few studies have provided empirical evidence of what makes housing adaptable for end-users. Based on a sample of 313 modern apartments that have been rearranged by their owner-occupiers, two aspects of adaptability are subjected to a quantitative analysis based on space syntax regarding the generality or polyvalence of space and the physical factors of the floor plans that facilitate reconstructions. The results show that two form factors are linked to occupant rearrangements: the size of the living space and the fragmentation of the initial floor plan. The results spark a discussion on a lack of general use of modern apartments and the long-term sustainability of housing stocks with respect to social aspects, as well as resource use from renovation and adaptation. There is a need for the market to acknowledge residents’ motivations for rearranging their living space, which can be due to a lack of quality in the original design, limitations in choosing a suitable apartment, or as a result of changing household needs.
1 Introduction
The adaptability of buildings generally refers to their capacity to accommodate future changing needs. Most buildings are rebuilt during the course of their lifetime in order to meet new legal and technical requirements, modernise, or satisfy changing social needs. Currently, design for adaptable buildings focuses on issues of sustainable and circular solutions (Kendall 1999; Gosling et al. 2013; Geraedts and Ruiterkamp 2015). From an economic perspective, it is possible to reduce the costs of future re-constructions that can be avoided or facilitated by adaptable design (Pinder et al. 2013). From an environmental perspective, adaptability provides the chance of a prolonged life and the avoidance of premature obsolescence, substantial re-constructions, and related material flows (Kendall 1999; Slaughter 2001).
In the context of residential buildings, adaptability has been hailed as a solution to support long-term social sustainability. Adaptability can create more attractive housing, accommodate cultural diversity and self-realisation, and lead to higher levels of quality of life (Boström 2012). As an alternative to relocation, the possibility of adapting a dwelling for changing needs contributes to a household’s safety and stability (Baum and Hassan 1999; Plaut and Plaut 2010) and has been found to be an important ingredient of residents’ satisfaction (Altaş and Özsoy 1998; Russell 2007). The possibility of adapting the dwelling increases user control and empowerment over the housing situation (Till and Schneider 2005; Braide Eriksson 2016). The adaptability of dwellings is also important in order to handle the challenges of an aging population (Geraedts and Ruiterkamp 2015). Finally, developing adaptable buildings has been promoted as a matter of intergenerational equity to ensure that buildings are assets rather than liabilities for future generations (Portney and Weyant 1999).
Despite these advantages, adaptability is seldom part of the design concept of apartment designs (Brand 1994). First and foremost, design for adaptability is related to higher up-front costs and also to uncertainties regarding the actual economic benefit (Pinder et al. 2013; Fawcett 2011). Some authors have argued that the building sector is too focused on short-term economics to invest in future-proof buildings (Till and Schneider 2005). However, supporting arguments for adaptable design are also hampered by a lack of or poorly documented evidence that argue in favour of adaptable buildings (Beisi 1995; Fawcett 2011).
1.1 Aim and scope
The aim of this paper is to contribute to the understanding of how the design of the layout of dwellings can facilitate their adaptability over time. The paper begins with an empirical study documenting the refurbishments conducted by the owner-occupiers in 313 contemporary Swedish apartments in multi-residential buildings. It was found that, in addition to refurbishing the surfaces and replacing kitchen furniture, appliances, and sanitary goods, the users also transformed the layout of their recently built dwellings by bringing down or installing walls and by closing openings or opening new ones. These internal refurbishments and transformations led to material flows and their related climate impacts, which might have been limited with better quality of design and materials (Femenias et al. 2016).
Seen from an international perspective, the Swedish study seems to reflect a common trend. Home renovation in the US is a significant activity in terms of economic and material resources (Plaut and Plaut 2010; Lucy and Phillips 2002). The production of waste from home improvements and their related environmental impact have also been the subject of study in Australia (Maller et al. 2012), the United Kingdom (Hand et al. 2007), and Denmark (Quitzau and Røpke 2008).
Taking advantage of the large sample of empirical material, a quantitative analysis was initiated of typological properties, such as the size of apartments and individual rooms, spatial connections, and their relations to the reconstructions made by the end-users. Two questions were examined: first, do the spatial properties of the apartments enable adaptability, as determined by the flexibility of use? This flexibility is based on whether the apartment and its spaces can be used for purposes other than the original intentions. Second, can statistical studies of the typological properties of the apartment layouts prove that some typologies are more likely to accommodate user-driven changes than others? The study is limited to the adaptability of floor plans of apartments and does not consider other kinds of structural or technical adaptability of housing. The results aim to contribute to the empirical evidence base of adaptable floor plans, which in turn can be used for design guidelines and critical discussions of contemporary housing.
2 Earlier research on adaptability
A considerable amount of research has been done to define and categorise building adaptability, also referred to as flexibility, changeability, or modifiability (Moharram 1980; Leaman and Bordass 2004; Till and Schneider 2005; Gosling et al. 2013; Geraedts et al. 2017). Research on adaptability also refers to elasticity or extendibility, that is, the possibility to enlarge or shrink a building, or units within a building, over time (Geraedts 2016; Jakšić et al. 2017).
While adaptability has been part of vernacular housing traditions (Tarpio 2016) and was endorsed by the early modernist architects of the twentieth century (Schneider and Till 2005), Habraken (1972) has been proposed as one of the pioneers of a more structured theory of building adaptability. His theory separates ‘support’ structures (commonalities of the building) from the ‘infill’ (which is of a private nature) in order to facilitate changes over time. The theory emphasises the empowerment of the housing occupants through their active part in constructing their living environment.
The ideas of Habraken (1972) have, for example, been successfully developed by Brand (1994), who defined six hierarchical structural, spatial, and temporal layers, from the site and structure to the space plan and outfitting. Each layer has its own technical, functional, and economic lifespan and needs to be separated from the others so that one can be replaced without interfering with the other. The layering theories have been used for systematic and systemic approaches to building adaptability (Gosling et al. 2013; Jakšić et al. 2017). Geraedts et al. (2017) have identified no fewer than 44 flexibility performance indicators for building adaptability. These include measures such as surplus building/floor space, free floor height, and load-bearing capacity; positioning and a surplus of facility shafts and ducts; additional staircases; and dismountable facades.
2.1 Adaptability of the floor plan
With respect to the adaptability of the layout of a dwelling, which is the focus of this paper, two strategies have classically been distinguished. The first is the capacity of a fixed situation to endorse several functions and is called generality (Cold et al. 1984), universality, or polyvalence (Leupen 2006). Specificity is the opposite term, and it refers to a design that can serve only one or a restricted number of functional demands. The second property is the capacity of a building to be arranged in different ways through physical alterations, which is often referred to as flexibility (Cold et al. 1984).
2.1.1 Generality
Concerning the generality of a dwelling, its smallest functional unit, the room, stands out as a salient feature (Manum 2005; Leupen 2006; Yunitsyna 2014; Ledent 2016). A general room provides the possibility of the interchangeability of activities. Physical factors that affect the generality of the room are, on the one hand, its size and form, and, on the other hand, the relationships between rooms or the ways they can be accessed. Manum (2005) has emphasised the consideration of daylight conditions and technical equipment that eventually restrict a room’s polyvalent use. Živković and Jovanović (2012) have highlighted the importance of the placement of windows, showing that a rhythmic sequence in the outer façade can facilitate a redistribution of space.
Based on historical studies, Ledent (2016) has shown that the archetypal general room measures four by 4 m, and he states that all dwellings must contain at least one such room in order to be of general use. Yunitsyna (2014), through a study of European housing standards, has declared that a room is general if its size is more than 15.4–16.4 m2, and specific if it is less than 8 m2. Yunitsyna (2014) has further stated that the width of a general room should be at least 3.1 m, and a room is specific in use if its width is less than 2.2 m.
With respect to the spatial system of a dwelling, universality can be expressed by form, typology, and the possibilities of circulation. Leupen (2006) has argued that a dwelling in which the rooms are organised in ‘circle’ or ‘star’ configurations are more general in use than those with a ‘chain structure’, which creates pass-through rooms. A room in a chain structure can only be accessed by passing through another room, which makes it is less general in use than a star-shaped apartment with a neutral space from which other rooms can be reached. Seo and Kim (2013) have argued that adjacent rooms of comparable size in a row (enfilade) support general or polyvalent use because activities can be performed in either one. If there is a corridor linking the room, this interchangeability is lost. Organising the rooms in enfilade in a circle maximises the freedom of movement and allocation of activities.
Ledent (2016) has argued that, traditionally, dwellings had no predefined function for rooms; the modernistic movement of the twenty-first century brought along functional studies, which created rooms and apartments with pre-defined uses. Early modernistic apartments from the 1930s through the 1950s were still more general in use, with living rooms and bedrooms of more or less equal size that could all be reached from a neutral hall way (Nylander 2008; Manum 2006). In an empirical study of a Spanish complex from the 1930s, Montellano (2015) has found that a floor plan with three to four rooms of comparable size, in which light-weight separating walls could easily be removed, provided an adaptable living space for households over decades. The presence of multiple entrances also adds to the adaptable use over time, as one apartment can be divided into two (Živković and Jovanović 2012).
Schneider and Till (2005) have harshly critiqued what they call the ‘tight-fit functionalism’ of modern housing. They have argued that housing is currently seen as a disposable commodity, with built-in obsolescence, and people are supposed to move when their personal circumstances change. West and Emmitt (2004) have shown that contemporary apartments in the United Kingdom seem to be functionally adequate only when occupied below full capacity. Seo and Kim (2013) have presented a similar critique of modern Korean housing, which has forgotten usability and inherent adaptability through deterministic floor plans that lack the possibilities of circular movements and polyvalent use. Manum (2006) has found that modern Norwegian apartments built after the year 2000 are more specific in use in that they have individually tailored rooms, open floor plans with pass-through rooms, and a lack of internal rings. Similar observations have been made in Sweden, where modern apartments are designed with open layouts in which the kitchen openly communicates with the living rooms (Nylander 2008; Willén 2012). With an open floor plan, the living room often becomes a pass-through space rather than a quiet space for rest. The possibility of using the living room as a permanent or temporary bedroom, in the case of a growing household, or in a shared household, is limited (Manum 2005). An open floor plan can also be problematic for households with different working hours, or in households where women and men need to be separated at times.
2.1.2 Flexibility
Finally, with respect to flexibility, the ultimate floor plan can be seen as the one with a core with kitchen and bathroom functions, and the possibility of different arrangements with lightweight separating walls or furnishings (Till and Schneider 2005). This kind of solution has been in use in fast-moving sectors with short retrofitting cycles, such as retail and office buildings (Kendall 1999; Slaughter 2001), but has so far had less success in the housing sector, perhaps due to the acoustic limitations of lightweight walls, which is a more prominent challenge in housing. Furthermore, housing experiments with lightweight or moveable internal walls have seldom been used to the extent that was predicted, and the solution quickly fell into oblivion after the first generation of inhabitants (Andersson et al. 1988; Beisi 1995).
3 Methodology
There are few previous quantitative studies of the adaptability of floor plans in housing. Instead, earlier research on the subject is often qualitative and based on only a few empirical examples (Beisi 1995; Montellano 2015; Till and Schneider 2005), or on subjective observations (Živković and Jovanović 2012; Seo and Kim 2013). Manum (2006, 2009) is one of few who has made quantitative studies of the adaptability of floor plans. However, Manum (2006, 2009) has studied the specificity versus the generality of floor plans rather than the potential of floor plans to accommodate user-driven changes. Fawcett (2011) has engaged in a mathematical approach using the Poisson distribution of office floor plan adaptability, but his results are not empirically proven.
3.1 The questionnaire
In the autumn of 2015, a questionnaire was sent to 462 households living in five multi-residential properties in Sweden constructed between 2001 and 2008. The residents were asked about refurbishments, alterations made to the original layout, and replacements of the original appliances in their apartments. In total, 313 households answered the questionnaire, corresponding to a response rate of 67%. The questionnaire consisted of 64 yes-or-no questions concerning what changes, replacements, or refurbishments had been made to each room in the apartment; it also provided a space for free comments. In addition, the floor plan of the apartment, as it was configured at delivery, was attached to each questionnaire, and the respondents were encouraged to draw the changes they had made (Fig. 1). Furthermore, 11 in-depth interviews were conducted with selected households in order to obtain a better understanding of the motives behind the changes.

Example of an apartment floor plan on which the residents have drawn their changes
3.2 Characteristics of the studied properties
One of the studied properties (Case 1) is located in Stockholm, and four (Cases 2–5) are located in Gothenburg, the two largest cities in Sweden (Table 1). The sample was selected in order to provide around 10–15 years of operational use and still secure data reliability, and also to mirror Swedish contemporary housing design. The properties are located in regenerated central, attractive waterfront areas with ambitions for sustainable urban development, e.g., they are energy-efficient buildings, have access to public transport, and are mixed-use. Only owner-occupied apartments, ‘bostadsrätt’—a Swedish kind of condominium—were considered, as users in rental buildings in Sweden are not entitled to perform larger refurbishments or transformations of the dwelling’s layout.
The choice of case studies may affect the possibility of drawing general conclusions. Due to a downturn in Swedish housing construction after the construction boom in the 1960s and 1970s, which resulted in a surplus of housing that lasted until the mid-1990s, few housing projects could be found that had been in operation for 10–15 years. When housing was constructed in the late 1990s and early 2000s, it mostly targeted a wealthy section of residents. This context is mirrored in our sample, where the older Cases 1 and 2 have larger and more spacious apartments designed to attract middle-aged couples who wanted to sell their villas and move to central areas, while Cases 3 through 5 reflect a more recent trend in which centrally located apartments become denser and smaller as a reaction to increasing building costs.
Swedish apartments are delivered fully equipped and fitted, that is, with a full kitchen (furniture, stove, fridge, freezer, dishwasher) and often with a washing machine and drier. If the buyers enter early in the design process, they have the possibility of selecting from a limited option of kitchen furniture design, wall colours, flooring, appliances, and, in some cases, the position of some inner walls. In addition, all new Swedish housing is 100% accessible for the physically impaired, which strongly affects the layout of the apartments. The accessibility regulation is regularly updated.
3.3 The respondents
The average age of adults in the responding households was 54 years old, and there were on average 1.97 persons per household. The typical household (63%) consisted of two adults. In 17% (52) of the 313 households, there were children under 18. Of these 52 households with children, 63% had one child, and 34% had two children. In the whole sample, only two households had more than two children. Most of the respondents have attended university or received higher education. According to the statistics, the inhabitants in the studied areas have an average yearly income that is 59% higher (€42,100) than the mean Swedish income (€26,400) in the Stockholm case, and 41% higher (€37,300) in the Gothenburg cases (Göteborg Stad 2015).
3.4 Analysis of the floor plans
Two kinds of analysis were performed, and space syntax formed an important starting point. Space syntax is developed as a method to link built form and function; the central idea is that social structure is inherently spatial, and, conversely, the configuration of space has a fundamental social logic (Hillier et al. 1984). The method provides efficient tools to study abstract properties of apartment layouts that are difficult to characterise by comparing floor plans only (Hanson 1998; Manum 2005, 2006).
First, a series of analyses were made with respect to the generality or specificity of space using statistics and metrical studies, including the characteristics of individual rooms, such as their size, shape, or equipment (e.g., fixed furnishings) that determine the use of the space. Rooms are defined as spaces clearly identified by separating walls, doors, or openings. The only exception concerns kitchens that openly communicate with the living room; the kitchen is then defined as the space surrounding the cooking area.
Second, the flexibility of the original layout or the spatial configurations to accommodate changes was analysed. The way users adapted the apartments is understood as an indicator of the opportunities provided by the original layout to make such changes. With rearrangements, we refer to modifications of inner walls (taking down or putting up walls) and modifications of openings (closing existing ones or opening new ones). This type of rearrangement accounts for the largest number of changes in the sample. We have also included changes to the kitchen layout in cases where this altered the layout or circulation in the apartment.
The quantitative analysis used statistical methods with a 5% significance level, even though convex mapping, a tool within the space syntax method, was used, and it has elements of subjective interpretation (Bafna 2003). The material used for the analysis was the respondents’ drawings on the original floor plans, where the rearrangements were visible, complemented with information from the 64 yes-or-no questions about refurbishments and transformations, and the free text comments residents provided about the changes.
3.5 Convex mapping
The first step in the analysis was to transform the spatial configurations of the apartments into connectivity graphs, called convex mapping (Bafna 2003; Hillier et al. 1984). Convex mapping consists of partitioning space into convex polygons, which have to be ‘the fewest and the fattest’ (Hillier et al. 1984). A convex polygon is a space in which no straight line between two points in the space crosses its boundary; in other words, the whole convex space is visible from any point in the same space. The definition is clear, but the concept remains intuitive; it is sometimes more relevant not to apply the strict definition when partitioning the layout in order to divide it into meaningful spaces. For example, a glass wall which allows visual connection between spaces is treated as the equivalent of an opaque wall. Manum (2006) has argued, that the way people experience a space is more accurate than the convex partitioning. However, convex mapping has two advantages: first, it obeys a rigorous definition, and, second, it(partly) takes into account the shape of spaces, which is important when it comes to analysing the transformations residents carried out.
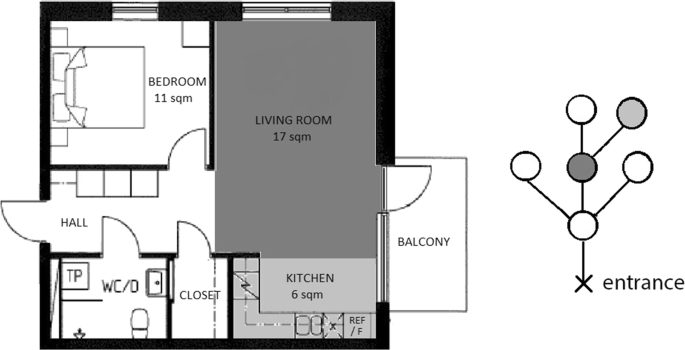
Once the apartment is divided into convex spaces, it is possible to draw the connectivity graph (Fig. 2). The nodes are convex polygons, and the edges represent the connections between them. The bottom of the graph is the space through which the apartment is entered. Balconies have been taken into account in the graphs (except in the analysis made in Sect. 4). Storage rooms are not taken into account, except when they are pass-through rooms.

Convex partitioning and connectivity graph, exemplifying a living room divided into two nodes
Nodes are not equivalent to rooms. For example, in Fig. 2, the living room is divided into two convex spaces and, consequently, it is represented by two nodes in the graph. However, when analysing the graphs (see Sect. 5.2), the rooms have to be associated with one unique node. When a room is divided into several convex spaces, the largest convex space (in terms of area) is then considered to represent the room. Thus, the room is assigned to the node corresponding to the largest of the convex spaces. In cases where the kitchen and the living room openly communicate, as in the example in Fig. 3, the space is still divided into two nodes because they represent different spatial functions.
Convex partitioning of an open floor plan where the kitchen and living room are one room but still divided into two nodes
4 Characteristics of the apartments and the rearrangements
As previously shown in Table 1, Cases 1 and 2 (see examples of apartment layouts in Figs. 4b, 9) have larger and also more spacious apartments than Cases 3 and 4 (see examples of apartment layouts in Figs. 1, 4a), which have smaller apartments with two bedrooms and a living room or fewer rooms, as well as a more compact design. In Case 1, the apartments have only one bedroom, a living room, and a kitchen and can be as large as up to 90 m2, which is almost double the size of the same type of apartment in Case 4. It is also a question of uniqueness. Cases 4 and 5 have many apartments of the same kind, while Case 2 has no fewer than 49 different apartment types in a total of 95 apartments.

a Two-room apartment in Case 4 of 69 m2. b Four-room apartment of 114.5 m2 in Case 2
4.1 The significance of size for accommodating change
A substantial number, 35%, of the responding households have altered the original floor plan. A significant factor for a rearranged floor plan is the original size of the apartment (Fig. 5). Residents rearranged larger apartments to a greater extent. The changes were initiated by the residents themselves, and we have no information concerning whether they asked for professional help in making the changes.

Distribution of the whole sample of apartments according to size, and distribution of the sub-sample of rearranged apartments in the same size groups. Large apartments are significantly over-represented in the sub-sample of rearranged apartments
In total, 18% or 57 of the 313 households have altered the kitchen layout. In 20% of these 57, the residents put up a wall to separate the kitchen from the living room. At the same time, another 21% took down a separating wall between the kitchen and living room. Another common kitchen alteration was to expand the worktop space. In the comments, many respondents complained about the small size of the kitchen and the lack of countertops in the original design. Of the total 57 households, 17, or 30%, have built a kitchen island (none of the apartments had a kitchen island at delivery). The size of the kitchen is larger after the user changes; this is facilitated by the open floor plan, which allows the kitchen to spill over into the living room.
Of the total, 11.5% or 36 of the households have created one or even two additional rooms by either merging two rooms or by building a box in the living room (two households) (Table 2). Among these 36 households in total, 21 are families with children, and all reside in Case 1, representing no less than 40.6% of the residents in that case. On the other hand, some households, mostly older couples without children, have chosen to merge two rooms into one larger space.
4.2 Room size analysis
Figure 6 shows the distribution of interior space between different rooms in the original floor plans. Public spaces, defined as the living room and the kitchen, occupy between 30 and 50% of the total floor area, compared to private sleeping areas, which occupy about 20–30% of the total floor area. The share of public areas decreases when the size of the apartment increases. Considering the whole sample, the largest bedroom is always smaller than the living room, and the second, third, or fourth bedrooms are even smaller. The average areas in the whole sample are as follows: total apartment, 83 m2; living room, 25.5 m2; first bedroom, 13.5 m2; second bedroom, 10.3 m2; and third bedroom, 9.8 m2 (Fig. 6).

Distribution of space in the apartments. The largest bedroom is considered as the first, then in decreasing order
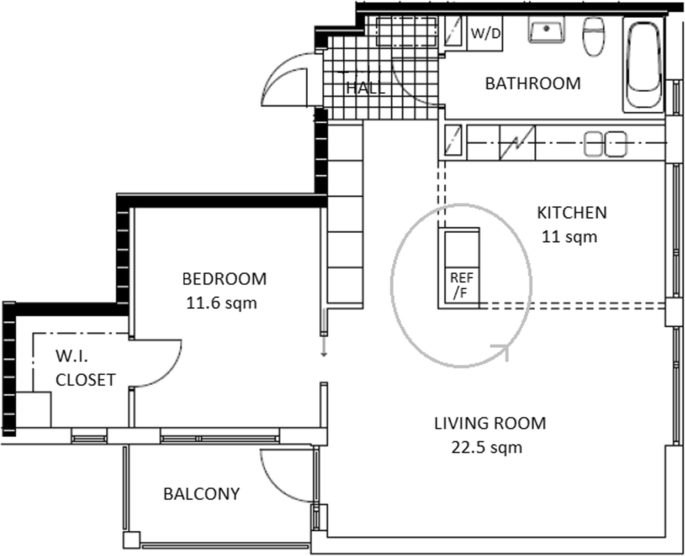
The sample show a discrepancy in size between the bedrooms and the public areas (Fig. 7). Comments from the respondents make clear that square-shaped rooms are preferred, while many smaller bedrooms are narrow and difficult to furnish. A few of what are categorised as third bedrooms located on the second floor of a duplex apartment are as large as the living room and can thus have exchangeable functions with the living room. The small interchangeability between rooms for private and public use is intensified by the presence of a large proportion of open plans. Only 22% of the original floor plans have a separate kitchen. In 52% of the apartments, the floor plan has a totally open space with open communication between the kitchen and the living room (see, for example, Figs. 1, 3). In 26% of these, the kitchen and the living room openly communicate but with limited visual connection between the two, for example, as shown in Fig. 14a. About 30% of the respondents commented that the open space was among the aspects they appreciated most in their apartment. At the same time, 11% complained about the sound environment, and five respondents have even sound insulated the walls and/or the ceiling in some rooms in the apartment. As regulations for acoustics have been strengthened with respect to the outer environment, sound disturbances tend to increase within and between apartments. Some residents indicated noise between apartments as one important reason to consider relocation.

Size of living rooms and bedrooms
4.3 ‘Integration’ of rooms in the floor plan
What can be called the ‘integration’ of spaces in the apartments is measured by the relative asymmetry (Bafna 2003). It is a value between zero and one computed for each node in the connectivity graph, taking into account the distance between nodes. A relative asymmetry equal to zero is the highest possible integration, whereas one defines the highest possible segregation. A space with high integration is a space from which other rooms in the apartment can easily be reached. A by-product of an integrated space is that it has the function of passage. An integrated space is generally centrally located in the apartment.
In the example in Fig. 8a, the living room has a relative asymmetry equal to 0.095. This is the space with the lowest relative asymmetry in that apartment (the kitchen and the entrance hall have 0.19 and 0.38, respectively). This means that the living room is the most integrated space in that apartment. In the example in Fig. 8b, the relative asymmetry of the living room is equal to 0.29. The living room is the second-most integrated space, after the entrance hall (which has relative asymmetry of 0.24). With reference to the whole sample, in 58% of the apartments, the living room is the most integrated space, while the entrance hall is the most integrated space in 29% of the apartments, and the kitchen is in 12%.
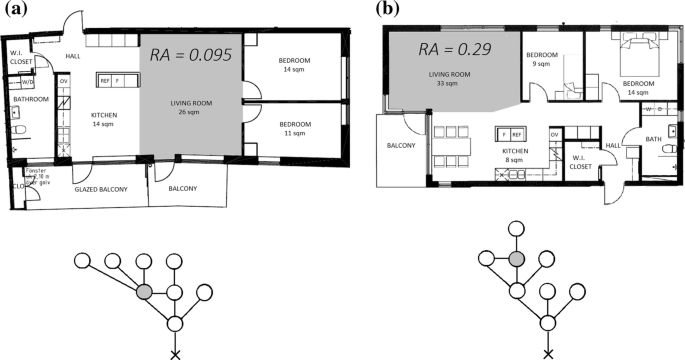
Relative asymmetry (RA) of the living room in two apartments with open floor plans
4.4 Room sequences
The sample has many pass-through rooms. In 67% of the apartments, the kitchen can be reached directly from the entrance hall, but 33% of the kitchens are only accessible from the entrance by first crossing the living room. In 69% of the apartments, the main bedroom (the largest one) has a neutral or private access to the bathroom or toilets, whereas in 31% of the apartments, a public space (kitchen or living room) must be crossed in order to reach the bathroom. In no less than 28% of the apartments, there is no bedroom with neutral access to the bathroom, for example as in the apartment in Fig. 9.
Apartment in Case 1 with no neutral access to bathroom from the bedrooms
4.5 Internal rings
Internal rings facilitate movement in the apartment and have been said to be a measure for polyvalent use (Leupen 2006; Seo and Kim 2013). Figure 10 shows the ratio of apartments with no internal rings as well as those with one, two, three, and more internal rings. Notably, 87% or 272 of the apartments had at least one ring at delivery. However, of these, in 167 (67%) apartments, one or more of the internal rings is formed around a unit with free-standing closets, fridge/freezer, or a pantry (see Fig. 11). After the residents’ interventions, the number of apartments without internal rings doubled from 41 to 87. In some cases, this is the result of residents closing off an opening, probably in a bid to improve the possibility of furnishing the apartment, which can be hampered by a redundancy of openings. In some cases, the internal ring was suppressed when an extra room was created. In 14 of the 46 apartments where at least one internal ring was removed, this is the result of the residents either removing a free-standing unit (in nine cases) or extending the free-standing unit so that the open space between the unit and a wall is filled with more closets.

Ratio of apartments with internal rings in original and rearranged floor plans
An internal ring is created by a free-standing unit of, in this case, a pantry and a combined fridge/freezer
Another feature related to circulation in a dwelling is the way that spaces are located in the connectivity graphs. Inspired by the work of Hillier et al. (1987), we have analysed three types of positions for a space. From left to right in Table 3, the positions correspond to an increasing control power. Type A (cul-de-sac space) is an isolated space where one moves only when one needs to. Type B (corridor within a ring) is a space with two possible accesses but that one can bypass (there is no space that can be reached only by crossing a B-type space). Type C (corridor) is a space that one must pass through to move to some other spaces, and therefore it has a control power over the spaces connected to it.
Figure 12 shows how living rooms and kitchens are distributed according to these categories in both the original layouts and the rearranged ones. In the original layouts, most of the kitchens were B-type rooms, in general with a double access from the living room or with one access from the living room and one access to a bedroom. Only 15% of the kitchens were of type C. In the original layouts, the living rooms were mostly C-type rooms. As stated above, in many apartments, the kitchen or one bedroom is accessible only through the living room.

Position of kitchens and living rooms in the connectivity graphs. Only apartments with at least one separate bedroom have been considered in this graph
After the residents rearranged the apartments, the internal ring B-type kitchens and B-type living rooms became A- or C-type spaces, that is, cul-de-sac or pass-through spaces. This trend more often involved kitchens than living rooms. Diverse scenarios may explain a change from a B- to A-type kitchen. In some kitchens that used to be accessible from the living room and from one bedroom, the opening leading to the bedroom has been closed. In some kitchens with double access to the living room (mainly in open-plan apartments), one opening has been walled up. In several cases, a B-type kitchen has become C-type as a result of layout transformations. This is often the case when the residents created an extra bedroom adjacent to the kitchen or a new storage space in connection to a bedroom, and in that process, they closed one of the accesses to the kitchen.
5 Analysis of compactness and fragmentation
A final analysis aims to measure the compactness of floor plans by assessing the parcelling of space. The goal is to evaluate whether there is a connection between the compactness of the dwelling design and residents’ rearrangements. We have limited the sample to those cases in which the residents have altered the number of rooms in the apartments as one important aspect of the flexibility in use. Of the total sample, 15% or 47 out of 313 apartments were thus considered: 4% (12 apartments) had one room removed, 10% (31 apartments) had one room added, and 1% (four apartments) had two rooms added.
5.1 A mathematical definition of compactness
The average parcelling of each apartment was computed by dividing the total number of nodes in the graph by the number of rooms indicated on the floor plan. To do so, the number of nodes versus the number of rooms was plotted for each apartment (Fig. 13). The scatter plot allows for the performance of an affine regression. The distance d between each point (each apartment) and the regression line was measured. A dimensionless distance Δ was computed from d:

Regression line: Number of nodes in the connectivity graph versus number of rooms in the apartment
Furthermore, Δ was normalised by being divided by the largest distance in the whole sample. The resulting quantity is called ‘fragmentation’, denoted f:
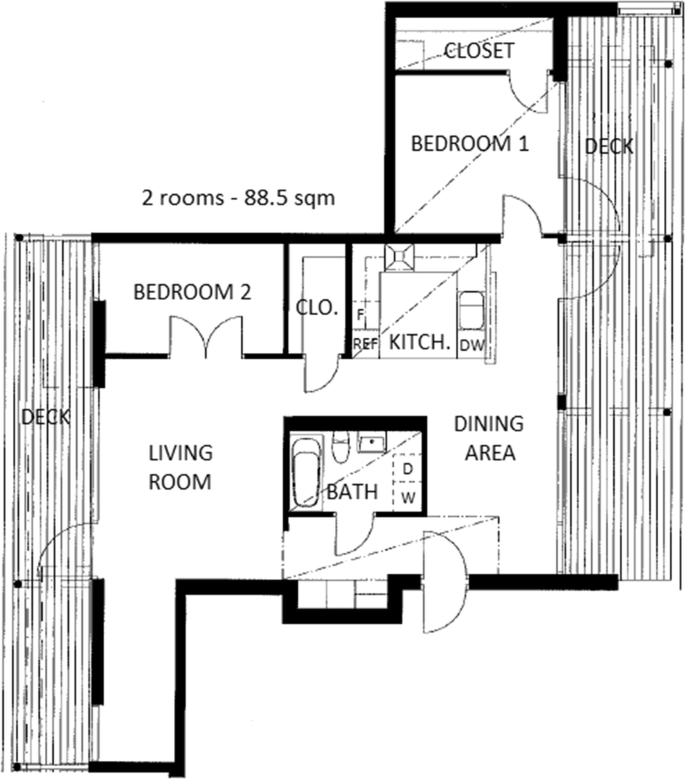
The fragmentation f is a value between − 1 and 1, and it measures how much a specific layout deviates from the average parcelling in the sample. If a floor plan has a positive fragmentation f > 0, this means that the layout has more nodes per room than the average. This kind of apartment is called over-fragmented, while a floor plan with a negative fragmentation, f < 0, is called under-fragmented. Figure 14a shows a three-room apartment of 86 m2 that is one of the most over-fragmented apartments in the sample; its fragmentation value is + 0.43. Figure 14b, a three-room apartment of 83 m2, is one of the most under-fragmented with a fragmentation value − 0.65.

a One of the most over-fragmented floor plans, and b one of the most under-fragmented floor plans in our sample
5.2 Over-fragmentation as a measure of flexibility?
It is possible to evaluate the influence of parcelling over the way residents rearranged their apartments. The fragmentation values of apartments in which the residents built extra rooms or suppressed rooms are available in Fig. 15; fragmentation values are given for both the original floor plans and altered ones. Apartments where additional rooms were built were significantly (Chi-square test with a 5% tolerance) over-fragmented in their original design: almost all of them have a positive fragmentation value. However, on the contrary, apartments in which a room has been removed were significantly under-fragmented in their original design. Our results show that apartments that were over-fragmented have become under-fragmented through the alterations and vice versa.

Fragmentation values of apartments whose number of rooms has changed
6 Discussion
This study shows that residents in contemporary and recently built Swedish apartments refurbish their homes, and they also rebuild and transform the floor plans to an extent that was beyond what was predicted. Some refurbishments were expected with reference to home makeover trends, but what was unexpected was that the floor plans in these recently delivered apartments would be rebuilt to the extent that they were. The results raise some questions with respect to intended use and the real use of modern housing.
6.1 The generality or polyvalent of the original floor plans
Earlier studies have claimed that features of the floor plan that facilitate a more general use or polyvalent are: a circle layout and presence of internal rings (Manum 2006; Leupen 2006; Nylander 2008), or a star-formed layout emerging form a neutral space (Leupen 2006; Manum 2006; Montellano 2015), rooms having a more equal size (Montellano 2015), rooms that are at more square and not too narrow (Leupen 2006; Yunitsyna 2014) and rooms in sequence where activities can spill over between the spaces (Seo and Kim 2013). In order to study the generality of the original floor plans in our sample, these were analysed with respect to the layout, the size, sequences and integration of rooms and the distribution of space.
There are several indications that the original floor plan limits the general use. The majority of the apartments are organised around centrally located, spacious public rooms, living rooms, and kitchens, which are then also pass-through rooms. More than 50% of the apartments have a very open floor plan, that is, where the kitchen and the living room are fully integrated (see, for example, Fig. 3). This is linked to the large number of compact dwelling designs in the sample, especially in Cases 3 and 4. A neutral access from bedroom to bathroom is in many cases not provided. In older apartments from the twentieth century, a neutral hall was the most integrated space (Manum 2005). In 60% of our sample, the living room is the most integrated room. Only 29% of the apartments have a neutral hall as the most integrated space. Besides creating pass-through space that can limit the use of the dwelling, for example if the living room would be used as a bedroom, open floor plans also seem to lead to problems with noise. In addition, many bedrooms are smaller than the living room, and of unequal size, which would hinder an interchangeable use between the rooms.
On the other side, upon delivery, 87% of the studied floor plans had at least one internal ring, which has been stated as a sign for general or polyvalent use. However, after the residents’ transformations the number of apartments without internal rings have doubled and more rooms have become pass-through space. The results are a higher number of connectivity graphs that are chain-like compared to before the transformations.
The suppression of internal rings can be understood to mean either that the residents have made use of the flexibility in use provided by the redundancy of openings, and in most cases the process should be reversible, or that the internal ring did not create any quality for the residents.
There seems to be some inconsistences in the literature around the relation between internal rings, rooms in sequence and general or polyvalent use. Rooms in sequence (or enfilade) should improve the general use (Seo and Kim 2013). At the same time rooms in sequence are also be pass-through rooms which can impede the general use. The most likely is that rooms in sequence have to be combined with internal rings in order to create a polyvalent use, and that this requires larger living spaces. In a smaller compact apartment, rooms in sequence are often linked to a chain-like graph and a pass-through living room. Furthermore, Nylander (2019) has argued that there are primary and secondary internal rings. The former creates possibilities for movement, a feeling of spaciousness and flexibility of activities, while the latter do not provide these kinds of qualities. Secondary rings are, for example, those that are defined around a free-standing freezer/fridge/closet unit or that involve a smaller number of rooms, a closet, or a bathroom. In small compact apartments, one of the internal rings is often created by around a free-standing freezer/fridge/closet unit.
6.2 Form features that support adaptability
Regarding the second aim, to test whether some typological properties can enable user-driven changes, the analysis highlighted two factors. First, there is a statistical correlation between the size of the apartment and cases in which the residents altered the floor plan. Second, the parcelling analysis (Sect. 5), which only considered the addition or subtraction of a room, shows that over-fragmented apartments were more often altered. After the residents’ transformations, those apartments that were over-fragmented became under-fragmented and vice versa (Fig. 15).
The larger apartments were more often renovated and rebuilt than those of a smaller size. A larger living space can more easily adapt and, for example, enable the creation of an additional room, thus accommodating the needs of a growing household. In addition, the over-fragmented apartments are often larger, with more crannies and passages, while the smaller and more compact apartments are under-fragmented.
There are, of course, other characteristics of the design of the original dwelling that facilitate rearrangements of the floor plan. For example, the presence of well-placed windows facilitates the division of a larger room in two (Živković and Jovanović 2012). However, in this study, the limitation was the floor plan, and there are possibilities for further analysis to cast more light on housing adaptability from a broader perspective.
The residents’ rearrangements can be understood as a result of the opportunity provided by the size or fragmentation of the floor plan, but in some cases, we can see that the residents’ rearrangements stem from a dissatisfaction with the original design. In their comments, some respondents referred to ‘dead’ or ‘redundant’ space as a motive for rearranging the floor plan. In addition, the residents’ comments indicate a greater satisfaction with the apartments after the transformations even though some of the general or polyvalent qualities might have been lost. One of the resident claimed, ‘After our rearrangements, the apartment is perfect’. It could be that the residents cherish other qualities, such as more but smaller rooms, better possibilities of furnishing, or they might not be aware of the consequences of their rearrangements before making them.
6.3 Challenging ideals around the compact apartment
The results of this study can be set in the context of apartments becoming smaller and more compact (e.g., West and Emmitt 2004; Till and Schneider 2005; Seo and Kim 2013). Today, small, compact dwellings are promoted as an environmentally sustainable solution, with reference to the smaller area to be heated, but there are likely also strong commercial motives (Hagbert and Femenias 2016). Concern could be raised regarding the long-term sustainability of a housing stock with a larger share of small, compact apartments. Earlier studies have stated that households try to adapt their homes in order to address changing needs before considering a relocation (Baum and Hassan 1999). In our sample, properties with larger and more spacious apartments have a lower turnover compared to properties with smaller and more compact apartments (see Table 1). The study cannot confirm the correlation between the turnover of residents and the layout and size of apartments, but two of the households that were interviewed claimed that when they were house-hunting, they saw the possibility of creating an additional room that could accommodate a large or growing family, and that this was one decisive criterion for choosing that specific apartment. Why households choose an apartment or why they remain in a home is probably a complex combination of factors both related to the housing market and individual preferences, and it is a subject that needs further research.
7 Conclusions
The aim of the study was to search for quantitative correlations one the one hand of the layout of the apartment and its general or polyvalent use, and on the other hand between the form and layout of the apartments and their potential for accommodating future changes. In relation to the generality of the floor plans, this study gives quantitative support to earlier observations that modern floor plans have characters that do not support a general use (e.g. more pass-through rooms, small bedrooms). With respect to the potential for accommodating future changes, two form factors were salient: first, the size of the apartment was directly linked to rearrangements of the layouts; second, fragmentation of the layout was linked to a higher number of apartments in which the residents had created one or more additional rooms. However, no single factor leads to an optimal, adaptable floor plan; instead, it is the result of a combination of interdependent factors (Živković and Jovanović 2012), and more studies are needed to analyse these complex relations.
The results raise questions about the offers on the housing market and the long-term sustainability of stock. Directly and indirectly, the residents’ rearrangements (for example, the need for new flooring or re-painting/tiling as a consequence of a remodelled floor plan, kitchen or bathroom) led to considerable material flows and the related climate impact (Femenias et al. 2016, 2018). The changes are understood as the result of a perceived lack of quality in the original design or a need among the residents’ to alter their dwelling to better fit their needs. The market could learn from these user-driven changes as a means to understand its customers better in terms of appreciated qualities. The market should probably also recognise that residents want the possibility of change, and that these changes should be planned for in a way that increases the adaptability of apartments at the same time that the material flows of these changes are limited. Concerning the fact that some initial qualities of the floor plans are lost after the residents’ rearrangement, that there are less internal rings and more pass-through rooms, this could be a sign that people value other functions or qualities than the intended. However, there may also be a need for guidance for residents to make such changes while keeping or developing the spatial and functional qualities.
Finally, regarding the generality of results, the study may show certain bias because it relates to Sweden, metropolitan areas, and high-income residents. The study also raises question about how tenants handle the same questions, as they are not entitled to make any rearrangements to their homes. There is room for further studies in the field.
References
Altaş, N. E., & Özsoy, A. (1998). Spatial adaptability and flexibility as parameters of user satisfaction for quality housing. Building and Environment,33, 315–323.
Andersson, B., Jonasson, K., & Olsson, S. (1988). Experimenthuset i Järnbrott. Stockholm: Byggforskningsrådet.
Bafna, S. (2003). Space syntax: A brief introduction to its logic and analytical techniques. Environment and Behavior,35, 17–29.
Baum, S., & Hassan, R. (1999). Home owners, home renovation and residential mobility. Journal of Sociology,35, 23–41.
Beisi, J. (1995). Adaptable housing or adaptable people? Experience in Switzerland gives a new answer to the questions of housing adaptibility. Architecture & Behaviour,1, 139–162.
Boström, M. (2012). A missing pillar? Challenges in theorizing and practicing social sustainability: Introduction to the special issue (p. 8). Sustainability: Science, Practice, & Policy.
Braide Eriksson, A. (2016). Residential design affecting dimensions of equity. In Proceedings of the international sustainable housing conference 2016, Green Line Institute Porto 16–18 November 2016.
Brand, S. (1994). How buildings learn: What happen after they are built. London: Viking Press.
Cold, B., Gunnarshaug, J., Hiortøj, E., & Raaen, H. (1984). Nye boligformer, en eksempelsamling [New forms of dwellings, a collection of examples in Norwegian]. Trondheim: Tapir.
Fawcett, W. (2011). Investing in flexibility: The lifecycle options approach. Projections,10, 13–29.
Femenias, P., Holmström, C., & Jönsson, H. (2018). Framtidens klimatsmarta och hållbara bostad. E2B2 rapport 2018:22. Stockholm: IQ Samhällsbyggnad och Energimyndigheten.
Femenias, P, Jonsdotter, L, Holmström, C & Thuvander L. (2016) Arkitektur, materialflöden och klimatpåverkan i bostäder. E2B2 rapport 2016:02. Stockholm: IQ Samhällsbyggnad och Energimyndigheten.
Geraedts, R. (2016). FLEX 4.0, a practical instrument to assess the adaptive capacity of buildings. Energy Procedia,96, 568–579.
Geraedts, R., Olsson, N. O. E., & Hansen, G. K. (2017). Adaptability. In P. A. Jensen & T. Van der Voordt (Eds.), Facilities management and corporate real estate management as value drivers: How to manage and measure adding value, Chap. 10 (pp. 159–183). London/New York: Routledge. ISBN 978-1-138-24387-3.
Geraedts, R. & Ruiterkamp, J. (2015) A business case for flexible housing: The feasibility of implementing flexibility measures in the housing market. In Proceedings of the Future of Open Building Conference. ETH Zürich, Switzerland.
Gosling, J., Sassi, P., Naim, M., & Lark, R. (2013). Adaptable buildings: A systems approach. Sustainable Cities and Society,7, 44–51.
Göteborg Stad. (2015). Göteborgsbladet 2015 - områdesfakta. http://statistik.goteborg.se/Global/Faktablad/Göteborgsblad/GbgBlad2015/Göteborg_SDN 2015.pdf. Accessed November 2017.
Habraken, N. J. (1972). Supports: An alternative to mass housing. London: The Architectural Press.
Hagbert, P., & Femenias, P. (2016). Sustainable homes, or simply energy-efficient buildings? Journal of Housing and the Built Environment,31, 1–17.
Hand, M., Shove, E., & Southerton, D. (2007). Home extensions in the United Kingdom: Space, time, and practice. Environment and Planning D: Society and Space,25, 668–681.
Hanson, J. (1998). Decoding homes and houses. Cambridge: Cambridge University Press.
Hillier, B., Hanson, J., & Graham, H. (1987). Ideas are in things: An application of the space syntax method to discovering house genotypes. Environment and Planning B: Planning and Design,14, 363–385.
Hillier, B., Hanson, J., & Peponis, J. (1984). What do we mean by building function?. London: E & FN Spon Ltd.
Jakšić, Ž., Trivunić, M., & Adamtsevich, A. (2017). Flexibility and adaptability-key elements of end-user participation in living space designing. In MATEC Web of conferences, 2017. EDP Sciences, 01001.
Kendall, S. (1999). Open building: An approach to sustainable architecture. Journal of Urban Technology,6, 1–16.
Leaman, A., & Bordass, B. (2004). Flexibility and adaptability. In S. Macmillan (Ed.), Designing better buildings: Quality and value in the built environment (pp. 145–156). New York: Taylor & Francis.
Ledent, G. (2016). Permanence to allow change the archetypal room: the persistence of the 4 × 4 room. In Proceedings of the EAAE ARCC international conference, Lisbon, 2016.
Leupen, B. (2006). Polyvalence, a concept for the sustainable dwelling. Journal of Nordic Architectural Research,19, 23–31.
Lucy, W., & Phillips, D. L. (2002). Confronting suburban decline: Strategic planning for metropolitan renewal. Washington, DC/Covelo, CA: Island Press.
Maller, C., Horne, R., & Dalton, T. (2012). Green renovations: Intersections of daily routines, housing aspirations and narratives of environmental sustainability. Housing, Theory and Society,29, 255–275.
Manum, B. (2005). Generality versus specificity: A study on the interior space of apartments. In Proceedings of the fifth international space syntax symposium, 2005.
Manum, B. (2006). Apartment layouts and domestic life: The interior space and its usability: A study of Norwegian apartments built in the period 1930–2005. Diss. The Oslo School of Architecture and Design.
Manum, B. (2009). The advantage of generality. In Proceedings of the seventh international space syntax symposium, 2009. Citeseer.
Moharram, L. A. (1980). A method for evaluating the flexibility of floor plans in multi-story housing. Diss. University of Pennsylvania.
Montellano, A. S. (2015). Housing flexibility by spatial indeterminacy: The case of the Casa de las Flores in Madrid. International Journal of Architectural Research: ArchNet-IJAR,9, 4–19.
Nylander, O. (2008). The typology of dwellings. Manuscript never published. Chalmers University of Technology, School of Architecture.
Nylander, O. (2019). Flooplans and movements [In Swedish Planlösningar och rörelsemönster]. Not published manuscript. Chalmers University of Technology, The Centre for Housing Architecture.
Pinder, J., Schmidt, R. I., & Saker, J. (2013). Stakeholder perspectives on developing more adaptable buildings. Construction Management and Economics,31, 440.
Plaut, P., & Plaut, S. (2010). Decisions to renovate and to move. Journal of Real Estate Research,32, 461–484.
Portney, P. R., & Weyant, J. P. (1999). Discounting and intergenerational equity. Washington: Resources for the Future Press.
Quitzau, M. B., & Røpke, I. (2008). The construction of normal expectations. Journal of Industrial Ecology,12, 186–206.
Russell, N. J. I. (2007). Multifamily housing characteristics and tenant satisfaction. Journal of Performance of Constructed Facilities,21, 472–480.
Schneider, T., & Till, J. (2005). Flexible housing: Opportunities and limits. ARQ: Architectural Research Quarterly,9, 157.
Seo, K. W., & Kim, C. S. (2013). Interpretable housing for freedom of the body: The next generation of flexible homes. Journal of Building Construction and Planning Research,1, 75–81.
Slaughter, E. S. (2001). Design strategies to increase building flexibility. Building Research & Information,29, 208–217.
Tarpio, J. (2016). Spatial principles and logics of dwelling flexibility. Arkkitehti—The Finnish Architectural Review,4, 13–21.
Till, J., & Schneider, T. (2005). Flexible housing: The means to the end. Architectural Research Quarterly,9, 287–296.
West, B. N., & Emmitt, S. (2004). Functional design? An analysis of new speculative house plans in the UK. Design Studies,25, 275–299.
Willén, M. (2012). Berättelser om den öppna planlösningens arkitektur: En studie av bostäder, boende och livsstil i det tidiga 2000-talets Sverige. [Narratives about the architecture of the open floorplan: A study of dwellings, residing and life style in Sweden in the early 2000s]. Diss. University of Stockholm. Lund: Sekel förlag.
Yunitsyna, A. (2014). Universal space in dwelling—The room for all living needs. In Proceedings of ICUAD 2014, 2nd international conference on architecture and urban design.
Živković, M., & Jovanović, G (2012) A method for evaluating the degree of housing unit flexibility in multi-family housing. In Facta universitatis-series: Architecture and Civil Engineering. 10, 17–32
Acknowledgements
We wish to thank four independent reviewers for their constructive and supportive comments that helped us to improve the final paper. We would also like to thank architect Cecilia Holmström at Tengbom Architects, architect Lina Jonsdotter and Associate Professor Liane Thuvander at Chalmers University of Technology who were part of the research team that designed the study and collected the empirical material. The research has been conducted as part of the research project “Architecture, material flows and climate change” Project Number 39703-2, funded by the Swedish Energy Agency (Grant No. 2016-004913).
Author information
Authors and Affiliations
Corresponding author
Additional information
Publisher's Note
Springer Nature remains neutral with regard to jurisdictional claims in published maps and institutional affiliations.
Rights and permissions
Open Access This article is distributed under the terms of the Creative Commons Attribution 4.0 International License (http://creativecommons.org/licenses/by/4.0/), which permits unrestricted use, distribution, and reproduction in any medium, provided you give appropriate credit to the original author(s) and the source, provide a link to the Creative Commons license, and indicate if changes were made.
About this article

Cite this article
Femenias, P., Geromel, F. Adaptable housing? A quantitative study of contemporary apartment layouts that have been rearranged by end-users. J Hous and the Built Environ 35, 481–505 (2020). https://doi.org/10.1007/s10901-019-09693-9
Received:
Accepted:
Published:
Issue Date:
DOI: https://doi.org/10.1007/s10901-019-09693-9