
Abstract
Understanding the relationship between protein structure and biological function is a central theme in structural biology. Advances are severely hampered by errors in experimentally determined protein structures. Detection and correction of such errors is therefore of utmost importance. Electron densities in molecular structures obey certain rules which depend on the molecular environment. Here we present and discuss a new approach that relates electron densities computed from a structural model to densities expected from prior observations on identical or closely related molecular environments. Strong deviations of computed from expected densities reveal unrealistic molecular structures. Most importantly, structure analysis and error detection are independent of experimental data and hence may be applied to any structural model. The comparison to state-of-the-art methods reveals that our approach is able to identify errors that formerly remained undetected. The new technique, called RefDens, is accessible as a public web service at http://refdens.services.came.sbg.ac.at.
Introduction
Experimentally determined protein structures contain a variety of uncertainties and errors. These often originate from low resolution electron density maps derived from X-ray analysis, or insufficient and ambiguous distance constraints obtained from nuclear magnetic resonance (NMR) experiments. Even high resolution X-ray structures contain errors that originate from uncertainties in the interpretation of electron densities.
It is highly desirable that errors in protein structures are removed on a regular basis which requires that current protocols in experimental structure determination are supplemented by additional error correcting cycles. The primary output of available error recognition programs (Lüthy et al. 1992; Colovos and Yeates 1993; Vriend and Sander 1993; Sippl 1993; Hooft et al. 1996; Melo and Feytmans 1998; Weichenberger and Sippl 2006; Davis et al. 2007) consists of scores which indicate inconsistencies like unfavorable interactions, incorrect atom positions, unusual rotamers and so on. The interpretation of such scores is usually straightforward but requires some understanding of the principles and inner workings of the software.
Validation tools and quality measures based on experimental electron densities have been proposed for a long time (Branden and Jones 1990; Brünger 1992). A major step forward was accomplished when in the beginning of 2008 the inclusion of structure factor data became mandatory when depositing model coordinates derived by X-ray crystallography to the protein data bank (PDB) (Berman et al. 2000). Protein structure validation remains an area of active research. Recently, various investigations have been published underlining the importance of critically interpreting three-dimensional models of experimentally determined protein structures (Kleywegt 2009; Read and Kleywegt 2009; Saccenti and Rosato 2008; Tronrud and Matthews 2009; Brown and Ramaswamy 2007). It has further been shown that re-refinement of structural models from PDB with current structure determination software leads to improved models (Joosten et al. 2009a, b)
In our approach to structure validation we calculate the electron excess around a specific amino acid side-chain as compared to the expected electron density around the side-chain atoms. The result, expressed in electron excess per cubic Ångström (e−/Å3), is easy to comprehend and does not require an understanding of sophisticated error recognition strategies. Deviations between computed and expected electron densities are easily visualized in the form of density difference maps. Most importantly, the reference data used in the approach presented here is independent of experimental data used to define the coordinates of the analyzed protein model. Deviations from expected densities directly reflect discrepancies between the interpretation of experimental data obtained for a particular molecule and the average behavior of comparable molecular environments observed in many other cases.
RefDens is designed for structures where high-quality data is not available. This may be the case for several reasons including missing NMR data (overlapping signals, low signal-to-noise ratio), medium or low resolution electron density maps, structures deposited without associated experimental data, and predicted structures.
To demonstrate the power of this approach we perform two different evaluations. First, to analyze the quality of RefDens’s results, we investigate a set of 1,559 protein structures recently deposited with PDB. All structures were released in 2009, have a resolution better than or equal to 2 Å and the experimental data required to build the electron densities are available. In this high quality set of protein structures we detected 95 problem regions, each being corroborated by visual inspection of the associated experimental electron density. A total of 29% of the errors are not detected by MolProbity’s clashscore (Davis et al. 2007) and 85% still exist in the re-refined structures from PDBRedo (Joosten et al. 2009a, b). The calculated electron density difference maps highlight the location of the problematic regions in the environment of the analyzed amino acid side-chain. Second, to demonstrate RefDens’s usefulness especially for the NMR structure resolution process, we analyze a set of structures from the PDB which were solved by both NMR and X-ray experiments. RefDens identifies 322 steric problems in the NMR structures all of which are resolved in the corresponding X-ray structures. Therefore, the presented method can significantly increase the quality of structures measured by NMR spectroscopy.
RefDens is available to the scientific community via http://refdens.services.came.sbg.ac.at
Results
Evaluation of X-ray structures
To demonstrate the error recognition ability of RefDens we evaluate all protein structures released between January 1st, 2009 and June 22nd, 2009 provided structure factors are available and the resolution is better than or equal to 2 Å. The query to obtain the PDB entries used for the benchmark was executed using the PDB Advanced Search interface (available at http://www.pdb.org/pdb/search/advSearch.do) which returned a list of 1,559 PDB entries. In total, 509,007 residues were analyzed. The vast majority (96%) has an excess of less than 1 e−/Å3 which we consider as “high quality”. However, a total of 95 residues, found in 71 PDB entries, have significant deviations from the expected density (excess electron density greater or equal than 3 e−/Å3).
Each of these 95 cases was analyzed in detail. This involves loading the protein structure and its associated experimental electron density maps in COOT (Emsley and Cowtan 2004), analyzing the agreement of the placement of the respective residue’s side-chain with the experimental data and searching for violations of stereochemical constraints. Five cases were excluded from the detailed analysis since the experimental data could not be loaded into COOT due to missing information in the corresponding structure factor files. In 80 of the remaining 90 cases the analysis reveals serious errors in the respective protein structure. Of these, 55 amino acid side-chains show significant disagreement with the experimentally determined electron density maps and for the remaining 25 cases there exist strong violations of stereochemical constraints. RefDens also detects four side-chains which have very unusual rotamers (frequency of at most 0.4% as according to the MolProbity web-interface). Finally, six amino acids are in agreement with the experimentally determined electron density and the stereochemistry seems reasonable. However, the side-chains are closely surrounded by many atoms, each slightly closer than expected and each contributing a small amount to the overall high electron excess. Since the reference densities are derived from known protein structures the excess electron density is highly unlikely to be observed in correct protein crystals.
The complete list of the 95 offending residues is publicly available as supplementary material via http://refdens.services.came.sbg.ac.at/results/results.php. The web page contains details on each of these cases and provides access to the corresponding PDB file and structure factor data.
In Fig. 1 we show an example where electron excess as calculated by RefDens (left side) corresponds well to the measured Fo-Fc map available from the electron density (EDS) server (Kleywegt et al. 2004) (right side). This example illustrates the difference between the knowledge-based approach and the experimentally determined difference map. RefDens detects the region of maximal electron density overlap between the asparagine side-chain and the neighboring backbone. In contrast, the measured difference map centers the electron excess around the misplaced atoms, as the electron density created by the asparagine side-chain is not visible in the observed map.

The environment of Asn-348 in chain C of PDB entry 3fxg, a rhamnonate dehydratase determined at a resolution of 1.9 Å. Atoms are colored by element: carbon, gray; oxygen, red; nitrogen, blue; sulfur, yellow. Contours of constant electron density are rendered as transparent yellow (0.1e−) and red (0.2e−) surfaces on both sides. The left hand side shows the electron excess as calculated by RefDens. For comparison, the right hand side displays the electron excess according to the measured (Fo-Fc) map from the EDS server. Although derived in substantially different ways, both maps identify the same problem regions
In Figs. 2 and 3 we give two examples of impossible conformations that can not be detected using MolProbity’s clashscore (even if supplied with the fully recovered crystal). Additionally, the example in Fig. 2 is not an outlier according to the quality scores of the EDS server (RSR = 0.128, RSCC = 0.868 and Z-Score = 0.045).

Impossible crystal contacts for Leu-332 in chain A of PDB code 3f1p, a transcription factor resolved to 1.17 Å. Residue Leu-332 from the asymmetric unit is rendered in dark gray. From a crystallographically related chain another Leu-332, shown in white, occupies the same space as the analyzed residue

Unrealistically close contact for Lys-A-332 in chain A of PDB code 3gr2, an beta-lactamase resolved to 1.8 Å. The Nζ of Lys-A-332 is placed way too close to the \(\hbox{O}^{\epsilon_1}\) of Gln-A-361 (1.73 Å). Additionally \(\hbox{C}^{\zeta_2}\) and \(\hbox{N}^{\epsilon_1}\) of Trp-A-276 are situated at hydrogen bonding distance to the Nζ atom
To demonstrate that RefDens is able to detect errors in protein structures which can not be identified using state-of-the-art quality assessment approaches we compare our results to MolProbity’s clashscore. RefDens automatically includes the crystal neighbors of the asymmetric unit into its calculations. Therefore, to assure for a fair comparision, we generate the crystal neighbors for each protein using PyMOL (DeLano 2002) and run MolProbity on the fully recovered crystal. As a result, 23 out of the 80 confirmed errors do not produce a clash for one of the analyzed side-chain atoms as according to MolProbity. In Fig. 4 we plot the sum of the MolProbity clashscores for all analyzed side-chain atoms versus the electron excess as calculated by RefDens. No correlation can be observed, which underlines that the electron excess score highlights different types of errors than MolProbity’s clashscore. In summary RefDens adds new error detection possibilities to the set of available methods.

Comparison between RefDens and MolProbity. A single point represents the electron excess on the x-axis and the sum of MolProbity’s clashscores over the atoms of the investigated side-chain. The plot contains scores of 57 erroneous side-chains from our benchmark set for which a clash is detected by MolProbity
Recently, most X-ray structures from the PDB were re-refined (Joosten et al. 2009a, b). We calculated the electron excess scores for the original versus the re-refined structures, to investigate how many of the errors detected by RefDens were resolved using the re-refinement protocol. The results of this evaluation are depicted in Fig. 5. For 12 errors the electron excess score in the re-refined structure is reduced, such that it passes below the 3 e−/Å3 cutoff. For the other 68 errors, there still exists high electron excess in the re-refined structures.

Electron excess as calculated by RefDens for the original PDB entry and the re-refined structure from the PDBRedo webserver. The red lines highlight the 3 e−/Å3 cutoff. A total of 12 side-chain errors are relaxed in the re-refined structures, whereas the other 68 problematic side-chains still exhibit high electron excess
Evaluation of NMR structures
Nuclear magnetic resonance structure determination is based on a variety of different measurements. As these measurements may vary strongly for different protein structures there is no common source of experimental data for reference. Therefore, we focus on a set of protein structures which were solved by both NMR and X-ray analysis. A list of PDB entries determined by multiple experimental methods, which is constructed based on sequence similarity, is available from the PDB website. RefDens was applied to all 788 NMR structures in this list. Our analysis reveals 691 errors in 224 NMR structures. These structures were further analyzed to identify those entries which can be reliably mapped to well resolved X-ray structures. This is guaranteed by two constraints: First, the NMR structure is required to share 85% or more equivalent residues with the X-ray structure according to the structure superposition program TopMatch (Sippl and Wiederstein 2008). Second, the X-ray structure has to be resolved at 2 Å or better. By applying these constraints, 79 NMR structures are mapped to an X-ray counterpart. In these NMR structures RefDens identifies 322 problematic side-chains. Out of the 322 corresponding residues in the respective X-ray structures, only two side-chains are marked as erroneous. However, these two residues, Asp-A-351 and Glu-A-428 in 2jqx (NMR) and 1p7t (X-ray), have strongly reduced electron excess (5.8 e−/Å3 reduced to 3.1 e−/Å3 and 7.1 e−/Å3 reduced to 3.0 e−/Å3, respectively) in the corresponding X-ray structure.
Since the electron excess is calculated based on the whole atomic environment of the respective side-chain, differences in electron excess imply different conformations. RefDens reliably identifies improbable side-chain conformations in the 79 NMR structures where a less restrained conformation is found in their X-ray counterparts. In Fig. 6 we provide an example where RefDens identifies a problem in the NMR structure 1ocd: A tyrosine residue conflicts with a neighboring heme group. In the corresponding X-ray structure (1hrc) this problem is resolved by another orientation of the side-chain and a different positioning of the ligand. This example also highlights one great advantage of analyzing electron densities instead of pairwise distances. MolProbity (Davis et al. 2007) reports two clashes for residue Tyr-A-67, the first between the \(\hbox{C}^{\epsilon_2}\) atom and the \(\hbox{C}^{\epsilon_1}\) atom of Tyr-A-74, and the second between the \(\hbox{C}^{\epsilon_1}\) atom and the Hα atom of Pro-A-71. These clashes correctly indicate a problem with the rotamer used. However, the primary problem in terms of electron density results from positioning the ligand too close to the side-chain. As there are no pairwise distance violations this overlap remains undetected by MolProbity. Analyzing the complete electron density environment clearly reveals the main problem region. In Fig. 7 we give an example of a methionine residue in a recently resolved NMR structure whose Sδ atom is placed too close to the neighboring backbone. This problem is resolved in the corresponding high-resolution X-ray structure.

Interaction of a tyrosine residue with the heme group in chain A of two protein structures of horse heart ferricytochrome c. (Left side) In the solution structure (PDB code 1ocd) RefDens detects a broad region of high electron excess for Tyr-67. Although the axially coordinating methionine Met-80 is close to the tyrosine hydroxyl group, the major source of conflict is the spatially close heme group. (Right side) In the corresponding X-ray structure (PDB code 1hrc at a resolution of 1.9 Å) the heme group is located further from the tyrosine residue and the axial methionine residue binds almost orthogonally to the heme group. This significantly reduces the electron excess such that no conflicting regions are detected for this protein structure

Unrealistically close contact (2.6 Å) between the Sδ atom of Met-102 in chain A and the backbone N of Ile-103 in PDB entry 2klj, a recently resolved (release date: 2009-10-06) structural protein (left side). In the solution structure RefDens correctly detects a severe electron density overlap. In the corresponding X-ray structure (PDB entry 1h4a, resolved to 1.14 Å) the situation is relaxed (distance of 3.33 Å) which results in a strongly reduced electron density excess (right side)
The list of all analyzed NMR structures and their X-ray counterparts is available in the supplementary material.
Discussion
We have demonstrated that RefDens reliably identifies errors in side-chains of protein structures. The algorithm is based on the comparison of calculated electron density environments for specific amino acid side-chains to reference densities derived from a set of high quality protein structures. In the presented benchmark we evaluated protein structures determined by X-ray analysis with a resolution better than or equal to 2 Å. In view of the high resolution of these structures, the fact that we are able to identify 80 confirmed errors is somewhat unexpected.
An essential feature of RefDens is its independence of experimental data other than the model coordinates and therefore it can be applied to any structural model, like structures determined by NMR spectroscopy, since the electron density is computed from the input model by standard procedures as used in X-ray analysis. The evaluation of 79 NMR structures with high quality X-ray counterparts shows that RefDens reliably identifies unfavorable side-chain conformations in NMR structures.
We are convinced that RefDens is of considerable interest for researchers in NMR spectroscopy. The analysis of the electron density environment has several methodological advantages as compared to classic structure quality assessment approaches, including the independence from the frequency of certain atom types in the training set (e.g., seldomly observed ligands atoms…), the direct steric depiction of the problematic regions and the natural combination of multiple pairwise distance violations into a single score. The evaluation of a single side-chain using RefDens takes less than a quarter of a second on a standard desktop computer. Therefore it allows the calculation of electron excess scores for large number of different models. Further research will be concentrated on the inclusion of main chain densities and the automated correction of unrealistic densities.
RefDens is publicly available as a web service at http://refdens.services.came.sbg.ac.at. The server accepts PDB codes or a PDB formatted file and returns a list of residues with high excess electron density. Each residue can be displayed with its corresponding error density map in three dimensions.
Methods
The training set
Our approach is knowledge-based in the sense that we derive information on expected electron densities from a set of experimentally determined protein structures. To select a suitable non-redundant data set we use the COPS (Suhrer et al. 2009) classification of protein structures using the following constraints. Firstly, any two proteins in the set share at most 90% structural similarity. Secondly, each protein structure is solved by X-ray crystallography and has a resolution better than or equal to 1.5 Å. This results in a set of 1,258 high quality protein structures. The focus on non-redundant structures ensures an exhaustive sampling of the electron density environments at least for that part of fold space which is covered by currently known structures. The COPS classification is especially suited for our task, as it allows to focus solely on quantitive structural relationships which are calculated by the TopMatch algorithm (Sippl and Wiederstein 2008).
Handling alternate locations of atoms
Many protein structures in the training set contain alternate location indicators (ALTLOCs). They indicate that the associated atoms occupy more than one position in the crystal. Since the intensities measured by the X-ray experiment correspond to an ensemble average over the crystal it is generally impossible to determine the different suitable combinations of ALTLOCs. In fact, to obtain all possible models compatible with multiple sites of residues it is necessary to identify the possible sterically allowed combinations of residues and atoms that have ALTLOC indicators. This is computationally expensive, ambiguous and error prone. We follow common practice by choosing the first ALTLOC for every atom and derived only coordinates from atoms with this indicator.
Generation of the reference densities
Although the idea behind RefDens may be applied to any part of a protein, here we focus on analyzing amino acid side-chains as their conformation is a common source of error, even in high-quality protein structures. Therefore, alanine, glycine, and proline are excluded from the evaluations as their side-chains lack backbone-independent flexibility. In the present work we are particularly interested in the detection of difficult errors like incorrect electron densities which result from non-covalent atomic interactions as opposed to errors which are comparatively easy to detect, like deviations from standard bond lengths or valence angles.
The calculation of the reference density is performed as follows:
-
1.
Hydrogen atoms are added to the protein structure and heterogeneous groups using Reduce (Word et al. 1999).
-
2.
Depending on the residue type a subset of terminal side-chain atoms (starting from the rotational bond of the last χ angle) is used to set up a reference coordinate system. These atoms are of particular interest since they are often involved in interactions to other side-chains, the backbone or ligands. The complete molecular environment is transformed to this coordinate system, including atoms from heterogeneous groups. Figure 8 shows the reference coordinate systems for several amino acid types.
Fig. 8 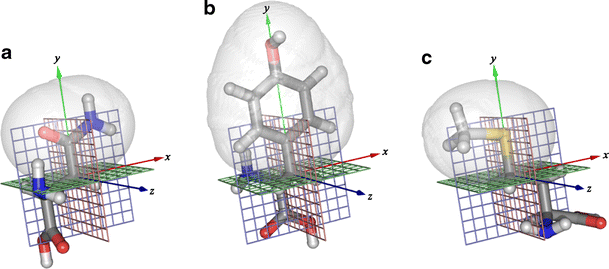
Amino acid side-chains rotated and translated into the respective coordinate systems. The regions analyzed for excess electron density are depicted by gray isosurfaces. a Asparagine: The (Cβ, Cγ) bond defines the y-axis (green) and both \(\hbox{O}^{\delta_1}\) and \(\hbox{N}^{\delta_2}\) are placed in the xy-plane (shown as a blue lattice). The Cβ atom defines the origin of the coordinate system. The x- and y-axis are shown as red and blue lines, respectively. b Tyrosine: The y- axis is defined by the (Cβ, Cγ) bond. The ring system is contained in the xy plane and the Cβ atom defines the origin of the coordinate system. c Methionine: The (Cγ, Sδ) bond defines the y-axis and Cε is placed in the xy-plane. The origin of the coordinate system is given by the center of the Cγ atom
-
3.
In this reference coordinate system the electron density is computed according to Eq. 1 in the supplementary material. Figure 8 illustrates the extent of the computed electron density maps for selected residues.
-
4.
For each of the 17 residue types the mean electron density is computed on an equidistant grid with step size of 0.5 Å.

The resulting averaged electron density maps for each of the 17 amino acids serve as a reference for the expected electron density environment of the different amino acid side-chains.
Evaluation of one protein structure
The analysis of the electron density of a particular protein is very similar to the reference density computation. We perform the first three steps described in the previous section, such that for each residue an electron density is computed. We then compare these densities with the pre-calculated reference densities of the respective residue type. This involves the calculation of the difference between the density from the target protein and the corresponding reference density on each grid point. The result is a difference electron density map similar to Fo-Fc maps used in X-ray crystallography, however, calculated in real space as the difference between the calculated density for the analyzed protein structure and the knowledge-based reference density. Finally, the electron excess is calculated as the numeric integral over the difference map. This serves as a score to express the deviation from the average density on a per-residue basis.
References
Berman HM, Westbrook J, Feng Z, Gilliland G, Bhat TN, Weissig H, Shindyalov IN, Bourne PE (2000) The protein data bank. Nucleic Acids Res 28(1):235–242
Branden CI, Jones TA (1990) Between objectivity and subjectivity. Nature 343:687–689
Brünger AT (1992) Free R value: a novel statistical quantity for assessing the accuracy of crystal structures. Nature 355(6359):472–475
Brown EN, Ramaswamy S (2007) Quality of protein crystal structures. Acta Crystallogr D Biol Crystallogr 63(Pt 9):941–950. doi:10.1107/S0907444907033847
Colovos C, Yeates TO (1993) Verification of protein structures: patterns of nonbonded atomic interactions. Protein Sci 2:1511–1519
Cromer DT, Waber JT (1974) International tables for X-ray crystallography, Vol. IV, Table 2.2 B. Kynoch Press, Birmingham (Present distributor Kluwer Academic Publishers, Dordrecht), pp 99–101
Davis I, Leaver-Fay A, Chen VB, Block JN, Kapral GJ, Wang X, Murray LW, Arendall WB, Snoeyink J, Richardson JS, Richardson DC (2007) Molprobity: all-atom contacts and structure validation for proteins and nucleic acids. Nucleic Acids Res 35(Web Server issue):W375–W383. doi:10.1093/nar/gkm216
DeLano W (2002) The PyMOL user’s manual. DeLano Scientific, Palo Alto
Emsley P, Cowtan K (2004) COOT: model-building tools for molecular graphics. Acta Crystallogr D Biol Crystallogr 60(Pt 12 Pt 1):2126–2132. doi:10.1107/S0907444904019158
Hooft RW, Vriend G, Sander C, Abola EE (1996) Errors in protein structures. Nature 381(6580):272. doi:10.1038/381272a0
Joosten RP, Salzemann J, Bloch V, Stockinger H, Berglund AC, Blanchet C, Bongcam-Rudloff E, Combet C, Da Costa AL, Deleage G, Diarena M, Fabbretti R, Fettahi G, Flegel V, Gisel A, Kasam V, Kervinen T, Korpelainen E, Mattila K, Pagni M, Reichstadt M, Breton V, Tickle IJ, G V (2009a) PDB_REDO: automated re-refinement of X-ray structure models in the pdb. J Appl Crystallogr 42:376–384
Joosten RP, Womack T, Vriend G, Bricogne G (2009b) Re-refinement from deposited X-ray data can deliver improved models for most PDB entries. Acta Crystallogr D Biol Crystallogr 65(Pt 2):176–185. doi:7591
Kleywegt GJ (2009) On vital aid: the why, what and how of validation. Acta Crystallogr D Biol Crystallogr 65(Pt 2):134–139. doi:10.1107/S090744490900081X
Kleywegt GJ, Harris MR, Zou JY, Taylor TC, Wählby A, Jones TA (2004) The uppsala electron-density server. Acta Crystallogr D Biol Crystallogr 60(Pt 12 Pt 1):2240–2249. doi:1107/S0907444904013253
Lüthy R, Bowie JU, Eisenberg D (1992) Assessment of protein models with three-dimensional profiles. Nature 356(6364):83–85. doi:10.1038/356083a0
Melo F, Feytmans E (1998) Assessing protein structures with a non-local atomic interaction energy. J Mol Biol 277(5):1141–1152. doi:10.1006/jmbi.1998.1665
Read RJ, Kleywegt GJ (2009) Case-controlled structure validation. Acta Crystallogr D Biol Crystallogr 65(Pt 2):140–147. doi:10.1107/S0907444908041085
Saccenti E, Rosato A (2008) The war of tools: how can NMR spectroscopists detect errors in their structures? J Biomol NMR 40(4):251–261. doi:10.1007/s10858-008-9228-4
Sippl MJ (1993) Recognition of errors in three-dimensional structures of proteins. Proteins 17(4):355–362. doi:10.1002/prot.340170404
Sippl MJ, Wiederstein M (2008) A note on difficult structure alignment problems. Bioinformatics 24(3):426–427. doi:10.1093/bioinformatics/btm622
Suhrer S, Wiederstein M, Gruber M, Sippl MJ (2009) COPS—a novel workbench for explorations in fold space. Nucleic Acids Res 37:W539–W544. doi:10.1093/nar/gkp411
Tronrud DE, Matthews BW (2009) Sorting the chaff from the wheat at the PDB. Protein Sci 18(1):2–5. doi:10.1002/pro.13
Vriend G, Sander C (1993) Quality control of protein models: directional atomic contact analysis. J Appl Cryst 26:47–60
Weichenberger CX, Sippl MJ (2006) Self-consistent assignment of asparagine and glutamine amide rotamers in protein crystal structures. Structure 14(6):967–972. doi:10.1016/j.str.2006.04.002
Word JM, Lovell SC, Richardson JS, Richardson DC (1999) Asparagine and glutamine: using hydrogen atom contacts in the choice of side-chain amide orientation. J Mol Biol 285(4):1735–1747. doi:10.1006/jmbi.1998.2401
Acknowledgments
We thank Bernhard Rupp for his answers to questions about X-ray crystallography and Sandra Pühringer for fruitful discussions and suggestions. This work was supported by the the Austrian Science Fund (FWF), grant P21294-B12.
Open Access
This article is distributed under the terms of the Creative Commons Attribution Noncommercial License which permits any noncommercial use, distribution, and reproduction in any medium, provided the original author(s) and source are credited.
Author information
Authors and Affiliations
Corresponding author
Electronic supplementary material
Below is the link to the electronic supplementary material.
Rights and permissions
Open Access This is an open access article distributed under the terms of the Creative Commons Attribution Noncommercial License (https://creativecommons.org/licenses/by-nc/2.0), which permits any noncommercial use, distribution, and reproduction in any medium, provided the original author(s) and source are credited.
About this article
Cite this article
Ginzinger, S.W., Weichenberger, C.X. & Sippl, M.J. Detection of unrealistic molecular environments in protein structures based on expected electron densities. J Biomol NMR 47, 33–40 (2010). https://doi.org/10.1007/s10858-010-9408-x
Received:
Accepted:
Published:
Issue Date:
DOI: https://doi.org/10.1007/s10858-010-9408-x