
Abstract
A thermodynamic assessment of the Ni–Te system has been performed using the Calphad method, based on experimental data available in the literature. The proposed description has been developed for use in the modeling of fission-product-induced internal corrosion of stainless steel cladding in Generation IV nuclear reactors. DFT calculations were performed to obtain 0 K properties of solid phases to assist the thermodynamic optimization. The ionic liquid two-sublattice model was used, and most solution phases were modeled using interstitial metal sub-lattices. With a strict number of parameters, the resulting description satisfactorily reproduces all thermodynamic properties and high-temperature phase transitions. The metastable miscibility gap in the Ni-rich liquid that is experimentally suggested is not present in the final description. The \(\delta \) phase exhibits a metastable order-disorder transition between the CdI\(_{2}\) and NiAs types of interstitial nickel distribution. The CdI\(_{2}\) prototype is the stable space group at room temperature. Low-temperature ordering phase transitions have been disregarded in this description, since they are not of interest to the application of corrosion in nuclear reactors.
Introduction
Internal corrosion of stainless steel fuel pins for Generation IV nuclear reactors, induced by the fission products Cs and Te [1,2,3,4,5,6], might limit the lifetime of the type of reactor, and the corrosion must be modeled in order to predict its potential impact on the fuel pin integrity. Therefore, a thermodynamic database of transition-metal tellurides is underdevelopment to be incorporated into the thermodynamics of advanced fuels-international database (TAF-ID) [7]. Descriptions of the Fe–Te and Fe–Ni systems are available in the literature [8, 9], and in order to model the Fe–Ni–Te system, Ni–Te has to be assessed and that is the topic of the present paper. DFT calculations were performed in order to get an estimate of the formation enthalpy and lattice stabilities of certain Ni–Te compounds.
State of the art on the Ni–Te system
Phase diagrams and crystallography
The phase relations in the Ni–Te system have been studied by a few authors [10,11,12,13,14,15]. Lee and Nash [16] assessed the data to construct the most recent phase diagram as seen in Fig. 1. Crystallographic data have been well studied for the \(\beta 2\), \(\gamma 1\) and \(\delta \) phases (Table 1) [12, 17,18,19].
The intermediate phases \(\delta \), \(\beta 2\) and \(\gamma 1\) consist of almost close-packed lattices of Te-atoms with Ni partially occupying interstitial sites. The \(\beta 2\) phase has at high temperature a Cu\(_{2}\)Sb-type structure with additional interstitial Ni partially occupying the Ni(2) octahedral site [12, 17]. The phase has two different ordered structures at the low-temperature solubility limits: The nickel-rich structure is monoclinic, below \({140}^\circ \hbox {C}\) [12], and the tellurium-rich one is orthorhombic, below 190–310 \(^\circ \hbox {C}\) [20]. The close relation of these structures to the Cu\(_{2}\)Sb-type allotrope is well described by Gulay et al. [17], who in a later paper determined the structure of the \(\gamma 1\) phase [19]. Several authors have verified that the \(\delta \) phase experiences an order-disorder transition at about 54.8 at.% Te [18] and a maximum in the c-axis, with the Ni-rich side being of the NiAs-type disordered structure and the Te-rich side of CdI\(_{2}\)-type ordering of defects into every other interstitial layer [12, 13, 18, 21,22,23]. Barstad et al. [13] reported that there is no solubility of Te in FCC–Ni based on lattice parameter measurements, and Abakarov et al. [24] published a solubility of 0.022 at.% Ni in Te at room temperature based on the same method.
The \(\beta 1\) and \(\gamma 2\) phases decompose on quenching, hence the lack of data. The \(\beta 1\) phase has an ordered superstructure of doubled axes, \(\beta 1'\), on the Ni-rich side between 731 and \({793}^\circ \hbox {C}\) [16]. Stevels [20] presented in a thesis high-T XRD data on the \(\beta 1\) phase and its ordered allotrope \(\beta 1'\). With calculations, they reproduced powder patterns of the \(F\bar{4}3m\) space group with varying metal-site occupancies and got a good description with 3.8 Ni-atoms in 4(c), 1.2 in 4(b) and 1 atom in 16(e). They compared this with the \(\beta \)-Cu\(_{2}\)Se phase of very similar lattice parameter of a = 5.69 Å, but that phase has later been re-characterized as \(Fm\bar{3}m\) [25]. The essential difference is that in \(Fm\bar{3}m\) the number of clusters of 4(c) sites each surrounded by four 16(e) sites is doubled by vertical mirroring.
The structure of the \(\gamma 2\) phase is still unknown.
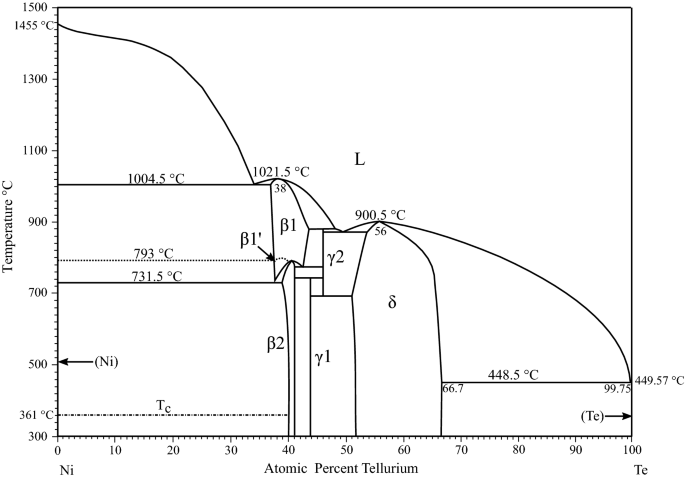
A digital reproduction of The Ni–Te phase diagram assessed by Lee and Nash [16], but with updated phase names. (This figure is reproduced with permission of ASM International. All rights reserved. www.asminternational.org)
Thermodynamic data
Table 2 summarizes thermodynamic quantities on the phases of the Ni–Te system available in the literature. Heat capacity has been measured on the \(\beta 2\) and \(\delta \) phases by several authors in a cryostat [27], via adiabatic shield calorimetry (AShC) [28, 29], differential scanning calorimetry (DSC) [30] and adiabatic scanning calorimetry (AScC) [31]; they are all consistent, and the \(\beta 2\) phase measurements show several lambda-type transitions. Enthalpy of formation has only been measured by solution calorimetry on the \(\beta 2\) phase by Shukla et al. [32], and supposedly on \(\delta \) by Predel and Ruge [33], although their composition corresponds to \(\gamma 1+\delta \). Jandl et al. [34] evaluated 0 K formation enthalpies of the \(\delta \) phase by DFT calculations. Activity data have been collected on most phases of the system via isopiestic measurements [14], Knudsen effusion mass spectrometry (KEMS) [35, 36] and electromotive force (EMF) [21, 37,38,39]. Maekawa and Yokokawa measured the partial excess enthalpy of solution of several transition metals in liquid tellurium [40].
DFT methodology
Total energies at 0 K were calculated via density functional theory (DFT) calculations performed using the Vienna Ab initio Simulations Package (VASP) [41,42,43,44] with the projector-augmented wave (PAW) method [45, 46]. The generalized gradient approximation (GGA) [47, 48] was used for the exchange-correlation effects. Cutoff energy and k-points were converged followed by optimization of volume by energy minimization with lattice parameter variation. Where applicable, internal degrees of freedom were optimized by shape relaxation. The pure element phases were compared with experimental data on lattice parameters and Voigt average bulk modulus, \(K_V\), as well as controlling that the DOS and final magnetic moment are reasonable. The bulk modulus was obtained by displacing every atom in every direction and calculating the elastic tensor, from which the bulk modulus is obtained as \(K_V=[C_{11}+C_{22}+C_{33}+2(C_{12}+C_{13}+C_{23})]/9\). Table 3 shows selected input and converged parameters of pure Ni and Te used in the DFT calculations, as well as calculated unit cell volumes and bulk moduli \(K_{V}\) compared with experiment [49, 50]. For FCC calculations, the Monkhorst pack k-point mesh was used, for HCP and the \(\gamma 1\) phase \(\Gamma \)-centered grids were used and for \(\beta 2\) the k-points were mapped with the automatic setting. The converged lattice parameters from 0 K DFT are very close to experimental data, as expressed via the volumes in Table 3 while the bulk moduli differ at most 26 %.
The lattice stability of HCP tellurium was evaluated, as well as the energy of formation of the compounds \(\beta 2-\mathrm{Ni}_{2}\mathrm{Te}\), \(\beta 2-\mathrm{NiTe}\) and \(\gamma 1-\mathrm{Ni}_{52}\mathrm{Te}_{40}\). The energy of a compound \(\mathrm{Ni}_{a}\mathrm{Te}_{b}\) at 0 K was evaluated via
with a and b being the stoichiometric proportions of the constituents of the phase, and the reference energies \(E_{\mathrm{Ni}}^{\mathrm{BCC}}\) and \(E_{\mathrm{Te}}^{A8}\) were calculated with the settings in Table 3. For a certain formation energy, the compound \(\mathrm{Ni}_{a}\mathrm{Te}_{b}\) and the reference states were all calculated with the same cutoff energies, selecting the highest necessary \(E_{\mathrm{cutoff}}\) of three for convergence. The energy of \(\gamma _1-\mathrm{Ni}_{52}\mathrm{Te}_{40}\) was calculated by creating 50 supercells, each constructed of five unit cells stacked in the b-direction, and randomly removing four each of the Ni(2) and Ni(3) interstitials. An average of the total energy was taken; how this average converges with the number of sampled energies was also controlled.
Calphad methodology
The Calphad method [52] was used to perform a thermodynamic assessment on the Ni–Te system, with solution phases modeled via the compound energy formalism (CEF) [53]. In the CEF, a phase is divided into sublattices and a Gibbs energy surface stretched between end-members, stable or hypothetical (metastable) compounds comprising all possible combinations of the sublattices each filled with one constituent. These are the compounds for which the total energy was computed via DFT; even though some end-members are not stable, in the Calphad method they must have a free energy assigned. If a formation energy has not been evaluated, it is common to use 5 kJ/mol per atom [52].
where \(^{\rm srf}G_\mathrm{m}^{\alpha }\) is the reference energy surface contribution from theoretical mechanical mixing of the constituents, with \(I_{0}\) being a zeroth-order constituent array describing an end-member with a constituent in each sublattice, \(P_{I_{0}}\) the product of the fractions of those constituents and \({^\circ }G_{I_{0}}\) the Gibbs energy of formation of that end-member compound. The configurational entropy of random mixing gives a contribution via \(^\mathrm{cnf}G_\mathrm{m}^{\alpha }\), the contribution from interaction between constituents on the same sublattice is represented by the excess energy \(^{E}G_\mathrm{m}^{\alpha }\) and other physical contributions, such as magnetism, are usually assigned to \(^\mathrm{phys}G_\mathrm{m}^{\alpha }\). For a more thorough explanation of the equations, see relevant literature [52, 53].
Solution phases
Table 4 summarizes the sublattice models of all intermediate phases used in this assessment of the Ni–Te system, with their respective end-members and composition ranges.
For simplicity, the \(\beta 1\) phase was modeled with two sublattices as \((\mathrm{Ni,Te})_{2}(\mathrm{Te})_{1}\), since the crystal structure is not well known. The 2:1 ratio was chosen to create an end-member close to the Ni-rich phase boundary. The order–disorder transformation into \(\beta 1'\) at lower temperature and higher Ni content is disregarded in this work. The \(\beta 2\) phase was modeled as \((\mathrm{Ni})_{1}(\mathrm{Te})_{1}(\mathrm{Ni,Va})_{1}\) according to the tetragonal P4 / nmm space group, compatible to the Fe–Te \(\beta \) phase modeled in a previous assessment [8]. The low-temperature ordering into space groups P21 / m (monoclinic) and Pma2 (orthorhombic) at high and low Ni content, respectively, is not modeled here since it is not of particular interest to the application of nuclear reactors, which operate at higher temperatures. The \(\delta \) phase was modeled as \((\mathrm{Ni,Va})_{1}(\mathrm{Ni,Va})_{1}(\mathrm{Te})_{2}\) in order to facilitate the second-order transition between the NiAs type disordering of vacancies to the CdI\(_{2}\)-type layering of vacancies in every other Ni layer (hence the separation of the (Ni,Va) interstitial sites into two sublattices) as has been experimentally verified [18, 22]. This is how the \(\delta \) phase was previously modeled in the Fe–Te system [8], and compatibility was accommodated for complete exchange of Fe and Ni in the Fe–Ni–Te system.
With experimental \(C_\mathrm{P}\) data available in the literature, Gibbs energy for a generic end-member \(A_{i}B_{j}\) can be modeled with a power series with temperature as
where \(H^{\mathrm{SER}}_\mathrm{m}\) is the standard element reference, i.e., the enthalpy of the stable state at 1 bar of pressure at room temperature. If \(C_\mathrm{P}\) data are not available for a phase, it is more convenient to use the Neumann–Kopp rule (NKR) which assumes a linear combination of the contributions from the \(C_\mathrm{P}\) of pure constituents, usually expressed via the Gibbs energy as:
Liquid phase
Fitting the eutectic point at around 50 at.% Te together with a high Ni-rich liquidus proved difficult with a substitutional model for the liquid phase. It was therefore decided to use the ionic liquid model as \((\mathrm{Ni}^{+2})_{P}(\mathrm{Te}^{-2},\mathrm{Va}^{-Q},\mathrm{Te}^{0})_{Q}\), which is in accordance with published findings showing short-range order (SRO) of ions in the liquid [54]. Here, P and Q, respectively, equal the average charge of the opposite sublattice; hence, Q is always 2 and P varies as \(P=2y''_{\mathrm{Te}{-2}}+Qy''_{\mathrm{Va}}\). This model is compatible with the ionic liquid used in the Fe–Te system [8] and will accommodate addition of oxygen. The neutral \(\mathrm{Te}^{0}\) species in the anionic sublattice makes it possible to cover the whole composition range; the charged vacancy maintains charge neutrality. This model creates an end-member at 50 at.% Te, making it easier to control the shape of the liquidus separately on both sides of the central eutecticum. This model can be made equivalent to a substitutional solution model with an associate as (Ni,NiTe,Te). Equations 3, 4 and 5 are for the ionic liquid changed into
where \(y'_{\mathrm{Ni}^{+2}}=1\) as there is only one cation; it is retained in the equations above for clarity.
Stoichiometric phases
The stoichiometric \(\gamma 1\) phase was modeled as \((\mathrm Ni)_{52}(\mathrm Te)_{40}\) and the \(\gamma 2\) phase as \((\mathrm Ni)_{20}(\mathrm Te)_{17}\), and the NKR was used for both. The pure Te phase (hexagonal A8) and \(\gamma -\)Ni (FCC), \(\alpha -\)Ni (BCC) and \(\epsilon -\)Ni (HCP) were taken directly from Dinsdale’s descriptions in the PURE5 database from SGTE [55]. No nickel was added to the A8 phase, but Te was added to the Ni sites of FCC, BCC and HCP. HCP was included in the assessment only to enter the tellurium lattice stability evaluated via DFT.
Optimization procedure
A thermodynamic assessment was performed using the PARROT module of the Thermo-Calc Software package [56] for parameter optimization. The assessment began by using a substitutional solution model for the liquid, with parameters of appropriate order of magnitude. Thereafter, solid phases were introduced one by one and optimized in the following manner.
Liquid, gas and terminal phases
The gas phase description was not optimized in this work, but merely extracted from the SGTE SSUB5 database [57,58,59,60].
After solid phases had been introduced, liquid model parameters were optimized to fit the congruent points of the \(\beta 1\) and \(\delta \) phases, as well as a tentative liquidus point representing the “melting effect” found at 1663 K for 15 at.% Te by Klepp and Komarek [15]. There were no further details about that data point in their paper. When those solid phases were approximately in place, the interaction terms in the liquid could be further optimized to fit liquidus and activity data [11, 14, 15], and the liquid \(\mathrm{Ni}_{2}\mathrm{Te}_{2}\) end-member was used to help fit the eutectic point between \(\gamma 2\) and \(\delta \).
No solubility was modeled in the pure terminal phases, although a small amount of Ni might be soluble in pure Te [24].
\(\beta 1\) and \(\delta \) phases
The end-member and interaction parameters of the \(\beta 1\) phase were first manually adjusted in order to get the phase in the approximately correct location in the phase diagram. The parameters were then optimized to fit the \(L\rightarrow \mathrm{FCC}+\beta 1\) eutecticum and activity data [14, 35, 36, 39]
All terms except the entropy terms (bT in Eq. 6) of the \(\delta -\)NiTe and \(\delta -\mathrm{NiTe}_{2}\) end-members were fitted to the formation enthalpy data evaluated via DFT by Jandl et al. [34] and the heat capacity data of Grønvold [29] and Tsuji and Ishida [31]. The interaction terms were then optimized to fit activity data [14, 21, 38] and the bT terms to fit solidus data [14, 15] and the phase boundaries evaluated by Barstad et al. [13]. The interaction term \(^{0}L^{\delta }_{\mathrm{Ni,Va:Va:Te}}={^{0}}L^{\delta }_{\mathrm{Va:Ni,Va:Te}}\), affecting the range NiTe\(_{2}-\)Te, was given a constant positive value in order to suppress a higher Te-solubility than about 66.67 at.% Te.
\(\beta 2\), \(\gamma 1\) and \(\gamma 2\) phases
The end-members of the \(\beta 2\) phase were first manually adjusted to make the phase appear in approximately the correct temperature and composition range. Both end-members, i.e., \(\beta 2-\mathrm{Ni}_{2}Te\) and \(\beta 2-\)NiTe, were modeled using the NKR. The stable composition range of the phase is narrow and lies roughly in the middle between the end-members; the end-members are thus rather far away from the compositions of available heat capacity data [29], which made it difficult to fit the data with end-members described as power series (Eq. 6). Instead, it worked well to model it as a power-series contribution to the interaction parameter \(^{0}L^{\beta 2}_{\mathrm{Ni:Ni,Va:Te}}\). The a- and b-terms of the interaction parameters together with the b-term of \(\beta 2-\mathrm{Ni}_{2}\mathrm{Te}\) could then be optimized to fit activity data [35, 39] and the congruent reaction \(\beta 2 \rightleftharpoons \beta 1\). The a-terms of the end-members were optimized to fit a sort of compromise between the enthalpy of formation of the end-members evaluated via DFT in this work and the calorimetric point by Shukla et al. [32]. If the latter enthalpy of formation were to be fit well, the phase would be too stable to allow the proper shape of the \(\delta \) phase.
The a-term of the \(\gamma 1\) phase was first fitted to the DFT enthalpy of formation value evaluated in this work, but was then lowered to fit the phase diagram; with a formation enthalpy of the \(\beta 2\) phase so low, the \(\gamma 1\) phase enthalpy must also be rather low to form the Gibbs energy tangent between the \(\beta 2\) and \(\delta \) necessary to have them all stable at low T. The b-term was fitted to relevant invariant reactions. The \(\gamma 2\) phase was added last, and its parameters were optimized to fit the phase diagram only, since there are virtually no other data available on the phase.
DFT Results and discussion
The formation energies of end-members of Ni–Te phases and lattice stability of HCP_A3 tellurium are summarized in Table 5 together with converged parameters and lattice parameters compared with experimental values. For the \(\gamma 1\) phase calculations, full volume relaxation was not performed since it was desired to only affect the energy by removing atoms, without allowing the cell shape or atom movement to compensate. Out of the 50 different cells, the one with the largest total energy had the vacancies clustered close together, and one with the lowest energy had the vacancies spread over the supercell. Figure 2 shows how the average total energy of \(\gamma 1-\mathrm{Ni}_{52}\mathrm{Te}_{40}\) converges with the number of sampled results. The last two points differ about 50 J/mol-atom.

Convergence of average total energy of \(\gamma 1-\mathrm{Ni}_{52}\mathrm{Te}_{40}\) with number of data samples out of the total of 50 different cells
Calphad modeling results and discussion
Thermodynamic properties
The formation enthalpy by Jandl et al. is very close to the calorimetric data point of a NiTe sample by Predel and Ruge [33], whose analyzed composition corresponds to a two-phase equilibrium of \(\delta +\gamma 1.\) Figure 3 shows the calculated enthalpy of formation, separately calculated, for all phases in the system. The enthalpy of the \(\beta 2\) phase closer fits DFT values than the experimental data point, while the \(\delta \) phase has a lower enthalpy than predicted by DFT at the NiTe end-member [34]. Therefore, the \(\gamma 1\) phase has a lower enthalpy than predicted by DFT in order to lie on a line in Gibbs energy between \(\beta 2\) and \(\delta. \)
Figure 4 shows the calculated heat capacity of \(\beta 2\) compared with experimental data of 40 at.% Te and 41.1 at.% Te [28]. The lambda peaks were not modeled; it is a satisfying fit to the pseudo-linear portions of the datasets. The heat capacity of the \(\delta \) phase fits experimental data well [27, 29, 31], as shown in Figs. 5 and 6. Figure 6 shows for 57.1 at.% Te a bump in \(C_\mathrm{P}\) at around 350 K; this was not modeled but the general slope of the data is satisfactory.
Figures 7 and 8 show the negative logarithm of the calculated thermodynamic activity of the Ni–Te system compared with the isopiestic data by Ettenberg [14] at 600 and \({875}\,^\circ \hbox {C}\), respectively. It was difficult to obtain a good fit together with other activity data (as seen in Figs. 9,10, 11 and 12), and the greater deviation from experiments in Fig. 8 is due to the Te-rich solidus of the \(\delta \) phase not matching the experimental phase diagram data [11, 15] at that temperature, as will be presented in "Phase diagram" section. Note that the chemical potential in Fig. 10 seems to deviate much from experimental data, but that the scale of the maximum deviation is only about 6%; it was difficult to improve the fit beyond this.
The description sufficiently reproduces the chemical potential data derived from EMF measurements by Carbonara and Hoch [21] and Geiderikh et al. [38], as seen in Figs. 11 and 12. The three upper points in the latter dataset (Fig. 12) lie in the \(\gamma 2+\delta \) region, and the discrepancy is probably due to the \(\gamma 2\) description.


Calculated heat capacity of the \(\beta 2\) phase compared with experimental data [28]

Calculated \(C_\mathrm{P}\) of the \(\delta \) phase at low temperatures compared with experimental data [27]


Negative logarithm of the tellurium activity of the Ni–Te system at \({600}\,^\circ \hbox {C}\) [14], with liquid as reference state

Negative logarithm of the tellurium activity of the Ni–Te system at \({875}\,^\circ \hbox {C}\) [14], with liquid as reference state


Chemical potential of Te in the two-phase regions of FCC and respective \(\beta 1\) and \(\beta 2\) phases, with temperature, compared with partial pressure data [36]

Chemical potential of Ni in \(\delta \) phase at ca \({400}\,^\circ \hbox {C}\) compared with EMF data by Carbonara and Hoch [21]

Chemical potential of Ni in \(\delta \) phase at 700 K compared with EMF data of Geiderikh et al. [38]
Phase diagram
The calculated phase diagram of the Ni–Te system is shown in Fig. 13. The final description is a compromise of fitting thermodynamic data and the phase diagram as best as reasonably achievable, and it is apparent from the figure that some aspects have been sacrificed. As seen in the zoomed-in Fig. 14 the \(\beta 1\) and \(\beta 2,\) congruent and solvus lines do not fit perfectly, whereas the invariant reactions are well reproduced. The \(\beta 1\) liquidus on the Te-rich side is slightly higher than measured by Klepp and Komarek [15] while the solvus fits well.
Furthermore, the \(\delta \) phase was rather difficult to optimize. Prioritizing a decent fit of the solubility limits by Barstad et al. [13], the congruent point and \(\delta +L\) liquidus together with activity data resulted in a rather large discrepancy in the Te-rich solidus at high temperature from the data by Westrum and Machol [11]. The \(\delta -\)NiTe end-member is stable from 0 to 38 K (Fig. 13), an artifact of the enthalpies of formation that does not affect the application to nuclear reactors since the description is not valid below room temperature. The phase diagram largely resembles the experimental ones in the literature, showing a wide solubility of \(\delta \) at room temperature, as well as estimating that \(\beta 2\), \(\gamma 1\) are both stable there.


As a result of the optimization, a transition between NiAs-type disorder of interstitials and \(CdI_{2}\) order appears in the \(\delta \) phase. This transition was calculated for the metastable \(\delta \) phase diagram and overlies the zoomed-in Ni–Te diagram in Fig. 15. The position of this line could be optimized to fit the data in the literature [18, 22], but doing so resulted in a poor fit of the phase boundaries; therefore, it was not prioritized with the application in mind. Figure 16 shows the site fractions of all constituents in the \(\delta \) phase from 50 to 66.67 at.% Te at 962 K. It is seen that the interstitials are fully disordered (NiAs-like) up to 52.06 at.% Te, i.e., outside the equilibrium solubility limit of Ni in the phase at 52.17 at.% Te, above which nickel rapidly shifts to the second sublattice; therefore, the completely disordered region only exists mainly in the metastable delta phase region, although there is a very narrow stable disordered interval right by the leftmost \(\delta \) corner at the invariant \( \gamma 2\leftrightarrow \gamma 1+\delta \). At 54.3 at.% Te, the phase is very close to \(CdI_{2}\) type ordering with \(y'' _\mathrm{Ni}=0.99\).
The experimental phase diagram seems to feature a metastable liquid miscibility gap evident by the kink in curvature of the Ni-rich liquidus (see Fig 1). Miscibility gaps in transition-metal telluride liquids are not surprising. It is acceptable that the liquidus in this region is about 100 K lower than the “melting effect” noted in the literature [15], since this data point might not be very accurate at such high temperatures with the experimental method used (above the stability limit of silica capsules). It is, however, possible that there is a stable miscibility gap in the liquid and that the reported melting effect [15] is the invariant \(\mathrm{Liquid}\#1\leftrightarrow \mathrm{Liquid}\#2+\mathrm{FCC}\) reaction, which would make it similar to our assessment of the Fe–Te system [8]. Until whether there are miscibility gaps in these systems or not is experimentally proven, it is merely a matter of taste and convenience if one chooses to model them. The Ni–Te liquidus can be described rather well without even a metastable miscibility gap in the liquid, while the Fe–Te liquidus cannot.

Zoomed-in region of Ni–Te phase diagram showing the order–disorder transition in the \(\delta \) phase. Dashed line described by the condition \(y' _\mathrm{Ni} -y'' _\mathrm{Ni}=0.001\)

Variation of site fractions of all constituents with composition in the \(\delta \) phase, at 962 K. \(y''' _\mathrm{Te}=1\) and is omitted
Conclusions and future work
A thermodynamic assessment of the Ni–Te system has been performed, supported by DFT calculations. The thermodynamic description is deemed good for the conditions present in the application to nuclear reactors. The liquid was modeled using the ionic two-sublattice model. There is an order–disorder transition in the metastable \(\delta \) phase but its exact position was not optimized. The description does not model all known ordered superstructures of the Ni–Te alloys; for such applications where that is desired, the description should be modified to include those phases, e.g., by modifying the sublattice models accordingly, introducing ordering parameters, or modeling them as separate phases. An assessment of the Fe–Ni–Te system is in progress.
References
Adamson MG, Aitken EA, Lindemer TB (1985) Chemical thermodynamics of Cs and Te fission product interactions in irradiated LMFBR mixed-oxide fuel pins. J Nuclear Mater 130:375–392. https://doi.org/10.1016/0022-3115(85)90325-3
Adamson MG, Aitken EA (1985) Cs and Te fission product-induced attack and embrittlement of stainless steel cladding in oxide fuel pins. J Nuclear Mater 132:160–166
Pulham RJ, Richards MW (1990a) Chemical reactions of caesium, tellurium and oxygen with fast breeder reactor cladding alloys Part I—the corrosion by tellurium. J Nuclear Mater 171:319–326. https://doi.org/10.1016/0022-3115(90)90378-Z
Pulham RJ, Richards MW (1990b) Chemical reactions of caesium, tellurium and oxygen with fast breeder reactor cladding alloys. Part II–the corrosion by caesium-oxygen mixtures and oxygen. J Nuclear Mater 172:47–53. https://doi.org/10.1016/0022-3115(90)90008-B
Pulham RJ, Richards MW (1990) Chemical reactions of caesium, tellurium and oxygen with fast breeder reactor cladding alloys. Part III–the effect of oxygen potential on the corrosion by caesium-tellurium mixtures. J Nuclear Mater 172:206–219. https://doi.org/10.1016/0022-3115(90)90439-T
Pulham RJ, Richards MW (1990d) Chemical reactions of caesium, tellurium and oxygen with fast breeder reactor cladding alloys. Part IV–the corrosion of ferritic steels. J Nuclear Mater 172:304–313. https://doi.org/10.1016/0022-3115(90)90285-U
OECD-NEA (2017) NEA Nuclear Science Committee: thermodynamics of advanced fuels—International Database (TAF-ID). https://www.oecd-nea.org/science/taf-id/. Accessed 03 Dec 2018
Arvhult CM, Guéneau C, Gossé S, Selleby M (2018) Thermodynamic assessment of the Fe–Te system. Part II: thermodynamic modelling. J Alloys Compd 767:883–893. https://doi.org/10.1016/j.jallcom.2018.07.051
Cacciamani G, Dinsdale A, Palumbo M, Pasturel A (2010) The Fe–Ni system: thermodynamic modelling assisted by atomistic calculations. Intermetallics 18(6):1148–1162. https://doi.org/10.1016/j.intermet.2010.02.026
Uchida E, Kondoh H (1956) Magnetic properties of nickel telluride. J Phys Soc Jpn 11(1):21–27. https://doi.org/10.1143/JPSJ.11.21
Westrum EF, Machol RE (1958) Thermodynamics of nonstoichiometric nickel tellurides. II. Dissociation pressures and phase relations of tellurium-rich compositions. J Chem Phys 29(4):824–828. https://doi.org/10.1063/1.1744597
Kok RB, Wiegers GA, Jellinek F (1965) The system nickel-tellurium. 1. Structure and some superstructures of the Ni3+-qTe2 phase. Recueil 84:1585–1588
Barstad J, Grønvold F, Røst E, Vestersjø E (1966) On the tellurides of Nickel. Acta Chem Scand 20:2865–2879
Ettenberg M, Komarek KL, Miller E (1970) Thermodynamic properties of Nickel–Tellurium alloys. J Solid State Chem 1:583–592
Klepp KO, Komarek KL (1972) Übergangsmetall–Chalkogensysteme, 3. Mitt.: das system nickel–tellur. Monatshefte fur Chemie - Chemical Monthly Chem 103:934–946
Lee SY, Nash P (1990) Ni–Te (Nickel–Tellurium). In: Massalski TB, Okamoto H, Subramanian PR, Kacprzak L (eds) Binary alloy phase diagrams, vol 3, 2nd edn. ASM International, pp 2869–2872
Gulay LD, Olekseyuk ID (2004) Crystal structures of the compounds Ni3Te2, Ni3-\(\delta \)Te2(\(\delta \) = 0.12) and Ni1.29Te. J Alloys Compd 376(1—-2):131–138. https://doi.org/10.1016/j.jallcom.2003.12.022
Norén L, Ting V, Withers RL, van Tendeloo G (2001) An electron and X-Ray diffraction investigation of Ni1+xTe2 and Ni1+xSe2 CdI2/NiAs type solid solution phases. J Solid State Chem 161:266–273. https://doi.org/10.1006/jssc.2001.9309
Gulay LD, Daszkiewicz M, Pietraszko A (2007) Evidence of a centre of symmetry: redetermination of Ni 2.60Te2 from single-crystal data. Acta Crystallogr Sect E Struct Rep Online 63(11):i188. https://doi.org/10.1107/S1600536807050568
Stevels ALN (1969) Phase transitions in Nickel and Copper Selenides and Tellurides. Ph.D. thesis, University of Groningen
Carbonara RS, Hoch M (1972) Thermodynamics and Structure of Ni1-xTe. Monatshefte fur Chemie Chemical Monthly Chem 715(103):695–715
Coffin P, Jacobson AJ, Fender BEF (1974) The observation of an order-disorder transition in the Ni–Te system by neutron diffraction. J Phys C Solid State Phys 7:2781–2790
Bensch W, Heid W (1996) Anionic polymeric bonds in nickel ditelluride: crystal structure, and experimental and theoretical band structure. J Solid State Chem 121(13):87–94. https://doi.org/10.1006/jssc.1996.0013
Abakarov SA, Bagduev GB, Dazhaev PS (1970) Solubility of Various Elements in Tellurium. Izvestiya Akademii Nauk SSSR, Neorganicheskie Materialy 6(6):1169–1170
Yamamoto K, Kashida S (1991) X-ray study of the average structures of Cu2Se and Cu1.8S in the room temperature and the high temperature phases. J Solid State Chem. https://doi.org/10.1016/0022-4596(91)90289-T
Adenis C, Langer V, Lindqvist O (1989) Reinvestigation of the structure of tellurium. Acta Crystallogr Sect C Cryst Struct Commun 45(6):941–942. https://doi.org/10.1107/S0108270188014453
Westrum EF, Chou JC, Machol RE (1958) Thermodynamics of nonstoichiometric Nickel tellurides. 1. Heat Capacity and Thermodynamic Functions of the delta phase from 5 to 350 K. J Chem Phys 28(3):497–503
Grønvold F, Kveseth NJ, Sveen A (1972) The Ni3+-xTe2 phases. Heat capacities in the range 298 to 900 k and transition behavior. J Chem Thermodyn 4:337–348
Grønvold F (1973) Heat capacities and thermodynamic properties of Cr3Te4and Ni3Te4from 298 to 950 K. Structural order-disorder transitions. J Chem Thermodyn 5(4):545–551. https://doi.org/10.1016/S0021-9614(73)80102-8
Mills KC (1974) Heat capacity of nickel and cobalt tellurides. J Chem Soc Faraday Trans 1 Phys Chem Condens Phases 70(7):2224–2231. https://doi.org/10.1039/f19747002224
Tsuji T, Ishida K (1995) heat capacities of Cr5Te8 and Ni5Te8 from 325 to 930 K. Thermochim Acta 253:11–18
Shukla NK, Prasad R, Roy KN, Sood DD (1990) Standard molar enthalpies of formation at the temperature 298.15 K of iron telluride (FeTe0.9) and of nickel telluride (Ni0.595Te0.405). J Chem Thermodyn 22(9):899–903. https://doi.org/10.1016/0021-9614(90)90178-S
Predel B, Ruge H (1972) Bildungsenthalpien und bindungsverhältnisse in einigen intermetallischen verbindungen vom NiAs-Typ. Thermochim Acta 3(5):411–418. https://doi.org/10.1016/0040-6031(72)87055-2
Jandl I, Ipser H, Richter KW (2015) Thermodynamic modelling of the general NiAs-type structure: a study of first principle energies of formation for binary Ni-containing B8 compounds. Calphad Comput Coupling Phase Diagr Thermochem 50:174–181. https://doi.org/10.1016/j.calphad.2015.06.006
Prasad R, IYer VS, Venugopal V, Sundaresh V, Singh Z, Sood DD (1987) Partial and integral molar thermodynamic properties of NixTe1-x(s, x=0.595 to 0.630) alloys. J Chem Thermodyn 19:891–896
Viswanathan R, Baba MS, Raj DDA, Balasubramanian R, Saha B, Mathews CK (1987) Vaporisation thermodynamics of the nickel-rich phases in the Ni–Te binary system–a high-temperature mass-spectrometric study. J Nuclear Mater 149:302–311
Kutsenok IB, Geiderikh VA, Valuev IA (1980) Use of the instantaneous measuring of EMF method for the study of thermodynamic properties of solid alloys. Vestnik Moskovskogo Universiteta Seriya 2 Khimiya 21(6):554–558
Geiderikh VA, Sheveleva SN, Kutsenok IB, Krivovsheya NS (1980) Thermodynamic properties of nickel tellurides. Zhurnal Fizicheskoi Khimii 54(4):1068–1071
Prasad R, Iyer VS, Venugopal V, Singh Z, Sood DD (1987) Thermodynamic Study of Ni3Te2 by E.M.F. measurements. J Chem Thermodyn 19:613–616
Maekawa T, Yokokawa T (1975) The enthalpies of binary mixtures of chalcogen elements with various metals. J Chem Thermodyn 7:505–506
Kresse G, Hafner J (1993) Ab initio molecular dynamics for liquid metals. Phys Rev B. https://doi.org/10.1103/PhysRevB.47.558
Kresse G, Hafner J (1994) Ab initio molecular-dynamics simulation of the liquid-metalamorphous- semiconductor transition in germanium. Phys Rev B. https://doi.org/10.1103/PhysRevB.49.14251
Kresse G, Furthmüller J (1996a) Efficient iterative schemes for ab initio total-energy calculations using a plane-wave basis set. Phys Rev B. https://doi.org/10.1103/PhysRevB.54.11169
Kresse G, Furthmüller J (1996b) Efficiency of ab-initio total energy calculations for metals and semiconductors using a plane-wave basis set. Comput Mater Sci. https://doi.org/10.1016/0927-0256(96),00008-0
Blöchl PE (1994) Projector augmented-wave method. Phys Rev B. 50:17953–17979. https://doi.org/10.1103/PhysRevB.50.17953
Joubert D (1999) From ultrasoft pseudopotentials to the projector augmented-wave method. Phys Rev B Condens Matter Mater Phys. https://doi.org/10.1103/PhysRevB.59.1758
Perdew JP, Burke K, Ernzerhof M (1996) Generalized gradient approximation made simple. Phys Rev Lett. https://doi.org/10.1103/PhysRevLett.78.1396
Perdew JP, Burke K, Ernzerhof M (1997) Erratum: generalized gradient approximation made simple. Phys Rev Lett. https://doi.org/10.1103/PhysRevLett.78.1396
Ledbetter HM, Reed RP (1973) Elastic properties of metals and alloys, I. Iron, nickel, and iron-nickel alloys. J Phys Chem Ref Data. https://doi.org/10.1063/1.3253127
SpringerMaterials (1998) Tellurium (Te) elastic moduli. Non-tetrahedrally bonded elements and binary compounds I, vol 41. Springer, Berlin, pp 1–2. https://doi.org/10.1007/10681727_1279
Van Ingen RP, Fastenau RH, Mittemeijer EJ (1994) Laser ablation deposition of Cu–Ni and Ag–Ni films: nonconservation of alloy composition and film microstructure. J Appl Phys 76(3):1871–1883. https://doi.org/10.1063/1.357711
Lukas HL, Fries SG, Sundman B (eds) (2007) Computational thermodynamics: the Calphad method. Cambridge University Press, Cambridge. https://doi.org/10.1017/CBO9780511804137
Hillert M (2001) The compound energy formalism. J Alloys Compd 320(2):161–176. https://doi.org/10.1016/S0925-8388(00)01481-X
Nguyen VT, Gay M, Enderby JE, Newport RJ, Howe RA (1982) The structure and electrical properties of liquid semiconductors: I. The structure of liquid NiTe2 and NiTe. J Phys Chem 15:4627–4634
Dinsdale AT (1991) SGTE data for pure elements. Calphad 15(4):317–425
Andersson JO, Helander T, Höglund L, Shi P, Sundman B (2002) Thermo-Calc & DICTRA, computational tools for materials science. Calphad Comput Coupl Phase Diagr Thermochem 26:273–312. https://doi.org/10.1016/S0364-5916(02)00037-8
SGTE 2019 SGTE Substance database: SGTE—Scientific group thermodata Europe. https://www.sgte.net/en/neu. Accessed 15 Jan 2019
Davydov AV, Rand MH, Argent BB (1995) Review of Heat Capacity Data for Tellurium. Calphad Comput Coupl Phase Diagr Thermochem 19(3):375–387
Cheynet B, Chevalier PY, Fischer E (2002) Thermosuite. Calphad 26(2):167–174. https://doi.org/10.1016/S0364-5916(02)00033-0
Belov G, Iorish V, Yungman VS (1999) IVTANTHERMO for Windows-database on thermodynamic properties and related software. Calphad 23(2):173–180. https://doi.org/10.1016/S0364-5916(99)00023-1
Acknowledgements
The authors are grateful to the Swedish Research Council (Vetenskapsrådet) for funding the SAFARI project. Carl-Magnus thanks his colleagues at CEA and KTH, as well as Drs Bonnie Lindahl and Nathalie Dupin for invaluable advice on modeling, Andrei Ruban for advice about DFT calculations. C.-M. further extends thanks to Mats Kronberg at the National Supercomputer Centre, Linköping, for keeping a backup of the DFT data when it was believed to be erased.
Author information
Authors and Affiliations
Corresponding author
Ethics declarations
Conflicts of interest
The authors declare that they have no conflict of interest.
Additional information
Publisher's Note
Springer Nature remains neutral with regard to jurisdictional claims in published maps and institutional affiliations.
Appendix 1: thermodynamic tables
Appendix 1: thermodynamic tables
Rights and permissions
Open Access This article is distributed under the terms of the Creative Commons Attribution 4.0 International License (http://creativecommons.org/licenses/by/4.0/), which permits unrestricted use, distribution, and reproduction in any medium, provided you give appropriate credit to the original author(s) and the source, provide a link to the Creative Commons license, and indicate if changes were made.
About this article

Cite this article
Arvhult, CM., Guéneau, C., Gossé, S. et al. Thermodynamic assessment of the Ni–Te system. J Mater Sci 54, 11304–11319 (2019). https://doi.org/10.1007/s10853-019-03689-0
Received:
Accepted:
Published:
Issue Date:
DOI: https://doi.org/10.1007/s10853-019-03689-0