
Abstract
In the tire manufacturing field, the pursuit of uncompromised product quality stands as a cornerstone. This paper introduces an innovative multimodal approach aimed at automating the tire quality control process through the use of deep learning on data obtained from stereo-photometric cameras meticulously integrated into a purpose-built, sophisticated tire acquisition system capable of comprehensive data capture across all tire zones. The defects sought exhibit significant variations in size (ranging from a few millimeters to several tens of centimeters) and type (including abnormal stains during processing, marks resulting from demolding issues, foreign particles, air bubbles, deformations, etc.). Our proposed methodology comprises two distinct stages: an initial instance segmentation phase for defect detection and localization, followed by a classification stage based on severity levels, integrating features extracted from the detection network of the first stage alongside tire metadata. Experimental validation demonstrates that the proposed approach achieves automation objectives, attaining satisfactory results in terms of defect detection and classification according to severity, with a F1 score between 0.7 and 0.89 depending on the tire zone. In addition, this study presents a novel method applicable to all tire areas, addressing a wide variety of defects within the domain.
Introduction
In the tire industry, as in many other industries, all the products must be verified at the very end of the production line. Historically, each one of them is manually inspected by trained workers. Today, with the rise of industry 4.0 (Vaidya et al., 2018), the automation of this task is necessary to increase productivity and limit the arduousness of work due to its repetitive and non-ergonomic part. On the other hand, many technical and mechanical difficulties complicate the task, such as obtaining good-quality images of all the tire zones in a reasonable time. A bespoke acquisition machine with an embedded stereo-photometric image acquisition system (Mourougaya, 2019) has been designed to solve this problem, whereas this article focuses on the image processing part.
Tire quality process control is a complex process and each manufacturer defines his own specific requirements. In order to have an automatic inspection system, the ultimate goal is not only to detect defects, but to classify them according to their severity (or criticality).

Two examples of different tread patterns
Classical machine vision algorithms, such as SVM (Hearst et al., 1998) and hand-crafted feature extraction have demonstrated that they can be highly efficient and fast in a static and perfectly controlled environment (Kuo et al., 2019; Aminzadeh & Kurfess, 2019) but they are encountering troubles for a good generalization across products, and this is particularly the case for tires whose tread patterns are completely different from one type of product to another. Moreover, a tire defect even grouped by family doesn’t necessarily have the same appearance as another. Because of the high variability of defects, it is impossible to extract manual features for defect detection. A more suitable approach would be to use deep learning, which enables better generalization and learning from complex backgrounds. Consequently, the prerequisite is to collect a large database of images with a sufficient variety of defects. We provided this effort to obtain a dataset with quality annotations and the required characteristics.
For the severity classification task, directly applying theoretical severity rules to detected defects proves unsuitable due to certain unknown features (such as depth and qualitative aspects) and the impracticality of applying numerous rules. Alternatively, manually analyzing the outputs of the segmentation network to define custom rules is not conducive to robust generalization across factories with diverse types of tires.
This paper investigates suitable deep learning architectures for defect detection and classification, with a focus on novel areas that, to our knowledge, have not been previously explored in visual inspection. The main contributions of this study include:
-
1.
Real-time processing of high-resolution stereo-photometric tire images, from defect detection to severity classification, stands as an innovative advancement in the tire industry.
-
2.
The definition of a fine-tuning strategy and training procedure in order to be able to treat all areas of the tire, inside and outside.
-
3.
The design of an innovative two-stage architecture:
-
A detection network based on MASK-RCNN, augmented with two additional IoU prediction branches.
-
A multimodal deep learning model for classifying large images along with their accompanying metadata, leveraging GRU and the attention mechanism.
-
The remainder of the paper is structured as follows. Firstly, Section “Related work" part is devoted to the state of the art in visual inspection, with a particular focus on the detection of tire appearance defects. Secondly, Section “Dataset presentation" part presents the dataset with its particularities and annotations. Thirdly, Section “Proposed approach" part is dedicated to the explanation of the proposed method for defect detection and classification. Then, the results will be presented in the “Results" section. Lastly, the paper concludes with a “Discussion and conclusion" section.
Related work
Deep learning for visual inspection
With the arrival of convolutional neural networks in 2012 and their superior performance on Imagenet (Deng et al., 2009) classification tasks, they were also investigated for visual inspection and defect detection tasks in industrial environments. One of the first applications was to detect surface defects in tunnels (Loupos et al., 2015) and (Protopapadakis & Doulamis, 2015) and on steel surface (Soukup & Huber-Mörk, 2014). For these specific tasks, all defects (cracks) share important visual similarities and no further defect classification is studied. With the advent of the Fast-RCNN (Girshick, 2015) and its improved version: Faster RCNN by Ren et al. (2015), it has established itself as a benchmark for object detection, opening up new horizons for defect inspection. The main advantage of this two-stage detector is its accuracy despite its relative slow inference time. Kang et al. (2018) proposed a typical application of the Faster-RCNN for the detection of surface defects in high-speed railway insulators, in combination with a deep multitasking network composed of a classifier and a Denoising AutoEncoder (Vincent et al., 2008) to deduce the defect state. Many Faster-RCNN-based approaches have been tested with dataset-specific enhancements such as Zhou et al. (2019) with the use of K-Means to determine the optimal anchor size and ratio for associated defects. Sun et al. (2019) also suggested an upgraded version of the Faster-RCNN using transfer learning and a modified version of ZF net (Hafizur & Masum, 2014) with a sliding convolution layer rather than max pooling at the end of the RPN for wheel hub surface defect recognition.
While many papers have opted for semantic segmentation approaches (Tabernik et al., 2019) with favorable outcomes, our objective is to explore the feasibility of individually characterizing each defect, a task that proves challenging to implement using semantic segmentation.
Transformers (Vaswani et al., 2017) are gradually being introduced into the literature of detection with SAM (Kirillov et al., 2023) as an attempt of creating a foundation model, but still few visual inspection papers are using them due to the training costs, inference time and the consequent data needed. For these specific data, texture information is important as convolutional layers are better than transformers at learning from such information. Conversely, transformers are better at aggregating results, as they benefit from a global context (Yan et al., 2021).
Tire surface defect detection
Recognizing tire surface defects is one of the most difficult tasks in visual inspection. The literature on this specific subject is not very dense due to the difficulty of collecting high-quality images, although some papers lay the foundations. Tada and Sugiura (2021) presented a method using a two-step patch classifier with the definition of three classes: good part, quasi-good part and defective. Their results seem to be good on their dataset, but they only treat inner surfaces, and the metrics are not computed per defect instances but per percentage of defect area, as their aim is not to to completely automate the verification process but to assist the operator.

An example of defects from the same visual family (Bumps) in the annotation interface on the inside of the tread, but with different degrees of severity (Top defect: severe, to repair / Bottom defect: not severe)

The proposed method for the detection and classification of tire surface defects
Massaro et al. (2020) studied how to detect large sidewall deformations caused by problems during tire assembly. For acquisition, profilometers are used to obtain a 3D reconstruction that is then converted into a 2D image for computational cost reasons. They compared three image processing methods: Discrete Fourier Transform, K-Means and Long Short-Term Memory-Fully Connected neural networks, and this showed that the combination of DFT and K-Means was the best solution in terms of computational cost and accuracy. However, two limitations should be noted: the observed area is limited to the sidewall and the detected defects are only deformations generated by possible material stresses and not correct tire-wheel rim coupling caused during assembling.
In the same field, Kuric et al. (2021) combined 3D scanning and vision system in order to detect and classify tire surface defects on the sidewall as well. They tried to use RCNN to detect defects but did not get satisfactory results. Rather, they designed a two-step method: 1) Unsupervised anomaly detection with a clustering algorithm (DBSCAN) applied to potentially anomalous data with respect to their definition of a defect-free tire (deviations higher than 0.5 mm) 2) Classification of detected abnormalities using the VGG-16 neural network. Their results are promising, but the need to define what constitutes a defect-free tire prevents easy generalization across dimensions. Moreover, the classification task is limited to two types of defects, the concept of severity is not addressed, and the study is also restricted to the sidewall only.
More recently, Liu et al. (2023) suggested to extract features (HOG and LBP) from normal and defect tire images to then pass them as input to a SVM classifier. They demonstrated that HOG and LBP features perform better when combined (with an approximate accuracy of 84%) than when taken separately as input to the SVM classifier. They are using images from different tires areas, different manufacturers, and different sources, without annotation masks or polygons, meaning that the acquisition system is not controlled, and only binary classification is possible. Another binary classification study was carried out by Lin (2023) using an improved version of Shufflenet which achieved good results with an accuracy of 94%.
Dataset presentation
Image acquisition
Before considering image processing, the first step is to choose the right acquisition system suitable for this task. Detecting defects on black textured surfaces like tires is challenging and requires some specific industrial equipment. Two classical choices seem the most suitable:
-
A linear camera with a white light
-
A 3D profilometer
The first option produces a 2D image with a high vertical resolution (3096 pixels) but without depth information, as opposed to the profilometer which generates lower resolution with less texture information but with depth information. The adopted solution is based on stereo-photometry. The main idea is to have different lighting angles with the same camera viewpoint. Theoretically, it’s possible to estimate normal surfaces and depth from these different lightning conditions. We are not considering the option of reconstructing the depth or Albedo map, as this would consume too much time. Also, it’s possible to use deep learning networks for this reconstruction, but the computational cost is high, especially for high resolution images. For these reasons, we decided to concatenate each light modality along the channel dimension, with the intuition that the depth information is already present since the surface map can be obtained from these plans only. The number of lights varies from 3 to 4 depending on the zone, but we have chosen to process 3 lights only in order to facilitate transfer learning between zones. Figure 6 displays how lighting conditions affect the visualization of defects. Furthermore, we observe the distinct contributions of each lighting condition in enhancing or diminishing the visibility of defects, depending on the specific tire zone and type of defect.
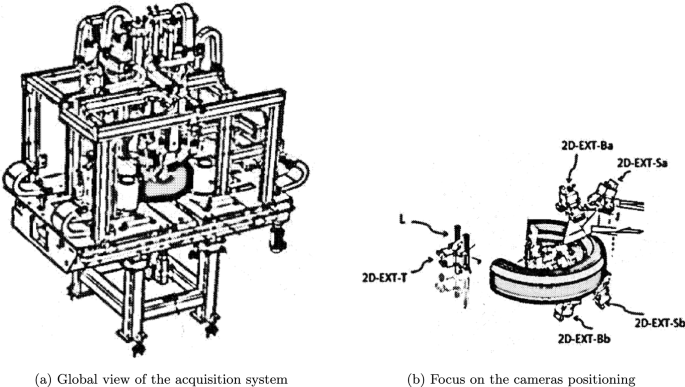
A complete tire acquisition necessitates 11 cameras, each equipped with its own embedded lighting system. The definition of tire zone names is explained in Fig. 4. A simplified schematic representation of the acquisition machine, derived from the patent Mourougaya (2019), is depicted in Fig. 5. To manage the diversity of tire dimensions, the acquisition machine automatically adapts the placement of its cameras using complex predefined PLC (Programmable Logic Controller). Therefore, the vertical resolution, tailored to the defect size under consideration, may vary based on the tire zone and dimensions. Additional details regarding the acquisition machine are available in the referenced patent.

Tire zone nomenclature
Schematic representation of the acquisition system
Annotations
Having quality annotations is a mandatory criterion to localize and classify defects. The total number of annotated images is 25,450 (14,100 of which are healthy). We have defined 10 defect types:
-
Bumps (2107 instances)
-
Surface Roughness (3298 instances)
-
Imprint (1210 instances)
-
Cut (837 instances)
-
Contrast Difference (2086 instances)
-
Tread Pattern Erosion (70 instances)
-
Flashes (3726 instances)
-
Smooth Dent (214 instances)
According to the zone, some defects will be more or less present, sometimes with visual differences. In other terms, the intra-class differences are low for the same camera zone but can be high between zones. Common defects samples under the different possible lighting conditions are shown in Fig. 6.

Samples of common defects, each demonstrating its visual characteristics under varying lighting conditions
We also have another annotation information at the polygon scale: the associated risk level, with 4 levels of severity that we decided to simplify into two levels: severe or not severe. This combination helps to rebalance severity classification.
All our experiments were performed on truck tires coming from the same factory. The annotations were made by experts directly in the factory to ensure the accuracy of their annotations. In fact, some annotation errors still persist in the dataset since even for an expert this task is extremely challenging.
In addition to these annotations, we also have tire metadata at our disposal. This textual information contains the tire’s dimensions and range (for example size 385/65R225 with X LINE ENERGY range).
Proposed approach
The global approach is shown in Fig. 3. Our proposed approach divides the global method into two parts: defect detection and defect severity classification. We will see that these two tasks cannot be easily combined, as some defects may have the same visual aspect but different degrees of severity (see Fig. 2). We have chosen to first detect and segment defects according to their visual families as direct detection of severity makes no sense, given the large number of defects of the same type with different severity levels. We prefer to predict severity in a subsequent step, using a dedicated network. The advantages of decoupling the detection and severity classification processes can be summarized as follows:
-
Alignment with real-world operations: By mirroring the sequential workflow of an aspect operator who first detects defects and then applies specific rules for classification, the model’s operational realism is enhanced.
-
Reduced black-box effect: decoupling the tasks mitigates the opacity inherent in attempting to perform both in a single step.
-
Enhanced memory efficiency: working with high-resolution images becomes more practical and memory-efficient when tasks are separated, as combining them would lead to a cumulative rise in memory usage.
-
Correction of false positives: the second classification stage has the capacity to rectify instances of false positives encountered in the initial detection stage, thereby improving overall accuracy.
-
Modular training approach: the ability to train the two stages separately provides flexibility and efficiency, allowing for focused training efforts on the second stage, which typically requires less time to train compared to the entire network.
First stage: defect detection
For defect detection, our network architecture uses a MASK-RCNN with two additional branches:
-
A mask-IOU branch to predict Intersection-over-Union (IoU) between the predicted mask and its ground truth mask. The aim is to describe the segmentation quality of instances and eliminate false positives not only based on classification scores but also with this predicted IoU. The IoU branch architecture is taken from Huang et al. (2019).
-
A bbox-IOU branch inspired from Wang et al. (2020) to predict IoU between the predicted bbox and its ground truth bbox for the same reasons as the mask-IOU branch.
By providing insights into the segmentation and detection quality of instances, these branches play a crucial role in mitigating false positives, thereby enhancing the overall precision of defect detection. Furthermore, they enrich the extracted features for the following classification stage by incorporating the two predicted IoU values together with the confidence score present in the original MASK-RCNN.
We have defined a training procedure to finetune models shown in Fig. 8. First, we take the weights of the pre-trained MASK-RCNN on the COCO dataset. Next, we train the neural network globally with all the images at the original ratio but re-scaled to fit a size of 1024 by 1024. This first training allows the network to adapt to stereo-photometric images and localize defects. After that, a zone-by-zone fine-tuning strategy is applied with respect to the original image’s ratio and size. We keep the maximum possible resolution with respect to the memory available on our GPUs (16 GB) for training.
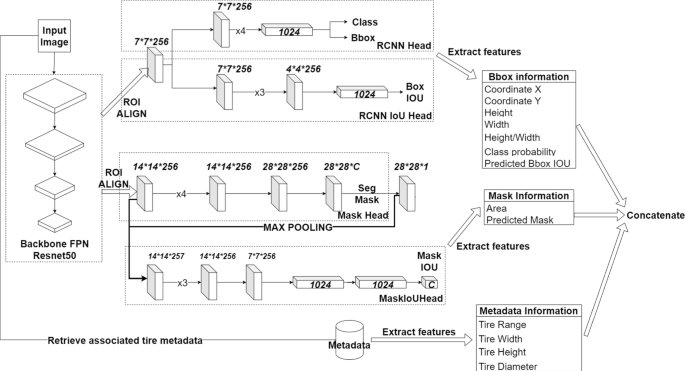
The detailed architecture of the defect detection and feature extraction modules

Zone-by-zone fine-tuning strategy
Loss functions
For training the improved version of the MASK-RCNN, we minimize an overall loss which is the weighted sum of the following loss functions:
The RPN classification loss \(\mathcal {L}_{\text {rpn}\_\text {cls}}\) which is a cross-entropy loss for anchor classification between background and objects:
with \(N_{rpn\_cls}\) the number of proposed anchors, \(y_i\) the target value (1 if an object is present, 0 for the background), \(p_i\) the predicted probability by the RPN that there is an object in the ith anchor.
The RPN regression loss \(\mathcal {L}_{\text {rpn}\_\text {reg}}\) for the regression of the anchors localization:
with \(N_{rpn\_reg}\) the number of sampled anchors from the candidates, \(p_i^*\) the binary ground truth label indicates whether anchor i is a positive sample, \(t_i\) the predicted offset for the ith anchor, \(t_i^*\) the target offset for the ith anchor.
The definition of the smooth-l1 function:
The faster-rcnn classification loss \(\mathcal {L}_{\text {cls}}\) which is a cross-entropy loss for the classification of bounding boxes according to their classes:
with \(N_{\text {cls}}\) the number of sampled bounding boxes ater the ROI head, M the number of classes, \(p_{c}\) the predicted probability that the i-th bounding box is of the c-th class and \(y_{c}\) the binary target that the i-th bounding box is of the c-th class.
The faster-rcnn regression loss \(\mathcal {L}_{\text {reg}}\) which is the same as the RPN regression loss except that the loss is applied on a sampled set of Regions Of Interest:
with \(N_{reg}\) the number of sampled ROI from the proposed, \(p_i^*\) the binary ground truth label indicating whether the i-th ROI is a positive sample, \(t_i\) the predicted offset for the i-th bounding box, \(t_i^*\) the target offset for the i-th bounding box.
The previous losses all come from Ren et al. (2015). The mask branch generates an \( m \times m \) mask for every Region of Interest (RoI) and each of the \( M \) classes, resulting in a total output size of \( Mm^2 \). Since the model aims to learn a distinct mask for each class, there is no competition among classes in generating masks. Therefore, we can formulate the mask loss, \( \mathcal {L}_{\text {mask}} \), as follows (defined in He et al. (2017))::
with \({N_{\text {mask}}}\) the number of ROI used for the mask branch (which is equal to \(N_{\text {reg}}\) less the ROI number without object to segment), m the resolution of the masks (in pixels), \(y_{icj}\) the ground-truth value of the j-th pixel in the c-th mask for the i-th ROI (1 if the pixel belongs to the object, 0 otherwise), \(p_{icj}\) the predicted probability of the j-th pixel in the c-th mask being part of the object class c for the i-th ROI.
The IoU bbox loss \(\mathcal {L}_{\text {IoU }\_\text { bbox}}\) (used in Wang et al. (2020)) which is a MSE loss between the target IoU (between the predicted bounding boxes and the target bounding boxes) and the predicted IoU:
with \(N_{reg}\) the number of sampled ROI from the proposed, \(IoU_i\) the predicted IoU, \(IoU_i^*\) the target IoU.
The IoU mask loss \(\mathcal {L}_{\text {IoU }\_\text { mask}}\) (used in Huang et al. (2019)) which is exactly the same as for the IoU bbox loss except that the IoU is computed per pixel inside each bounding box.
The Total loss may be written as the weighted sum of the previous losses:
Second stage: severity classification
After the detection, we need to extract the characteristics of each detected defect instance in order to classify them according to their severity. These specific features are selected as follows:
-
Coordinate of the defect (bounding box center), as severity depends on its location.
-
Relative vertical position (y) in the image.
-
Horizontal position, represented by a discrete value ranging from 1 to 12, corresponding to the twelve sectors into which the tire is divided.
-
-
Height and Width of the defect’s bounding box and the ratio Height/Width.
-
Classification branch class probability.
-
Mask IoU and bbox IoU predictions.
-
Defect area calculated on the defect mask.
-
Metadata information (Tire range, width, height, diameter). Some defects are more likely to appear on certain dimensions or ranges.
In regard to the severity classification part of our processing pipeline, we compared two approaches. The first is our baseline, which strictly utilizes the top layer of the neural network and a machine learning classifier based on the output of the extracted features. In order to improve our results, we proposed an approach which incorporates the original image with the extracted features using a customized multimodal deep learning neural network. There is one dataset per tire zone, with one instance of detected defect per line. The algorithm used to build this dataset is described in Algorithm 1
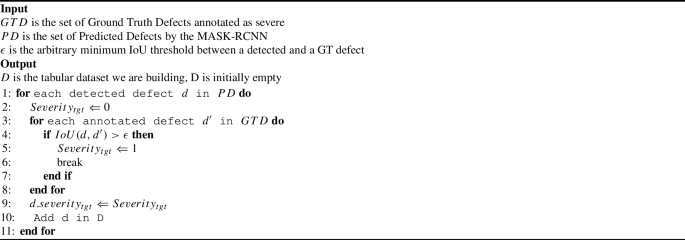
Build severity classification dataset
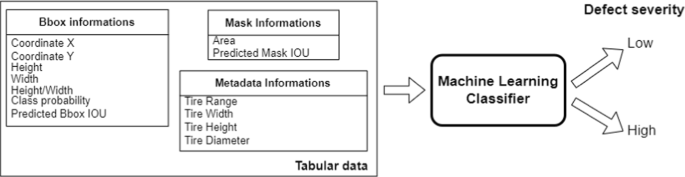
Baseline Model: machine Learning classification with a boosting tree model

Our proposed deep learning-based severity classification approach
The deep learning approach we suggest for the severity classification is composed of 3 parts:
-
A MLP to extract features from tabular data.
-
A method of feature extraction using a Resnet18 encoder to extract features from patches and a GRU to catch interactions between patches.
-
A network using MLP and the attention mechanism to fuse visual and tabular features.
In order to imagine this architecture, we drew our inspiration from the medical field. For skin lesion classification, metadata are important because certain factors such a person’s sex or age, are linked to the type of the lesion. Ou et al. (2022) showed that incorporating metadata improves classification results and that their multi-modal architecture with the attention-mechanism is better than a simple concatenation to fuse multimodal features. The self-attention module enables the network to exclude irrelevant information (such as background). The cross-attention module ensures that each modality guides the other. For instance, due to the pattern designs (see Fig. 1), a given dimension may result in some false positives appearing on the tread, and this cross-attention module can learn these complex relations.
For feature extraction in the image, we first trained a resnet18 encoder per zone to classify small patches according to their severity with 3 classes (no defect, not severe defect, severe defect). This pre-training task ensures that the extracted features are relevant. Then, we use a method tested in the medical sector proposed by Tripathi et al. (2021) for breast tumor classification. This BiLSTM approach using context-based patch modelling has the ambition to classify sequence of patches from high resolution-images. The RNN is useful to treat sequences of different lengths. Moreover, this makes our method independent from the original image size, the defect bounding box area in our case, and we can treat the image at full resolution without resizing it. We kept the same scanning technique to sample patches, but we replaced the BiLSTM with a bi-directional GRU (Chung et al., 2014) because it gave us better results empirically and has less parameters. The drawback of our architecture is that it is very sensitive to hyperparameters. To overcome this problem, we have done automatic hyperparameters research with the framework optuna. Before the input in the GRU layer, we added two linear layers separated by a Relu activation. The parameters of the search are the following:
-
GRU parameters:
-
Number of stacked GRU (between 1 and 5)
-
Dropout between GRU layers (between 0 and 0.5)
-
Number of hidden nodes (between 16 and 1024)
-
-
MLP parameters:
-
Dropout of the final linear classifier (between 0 and 0.5)
-
Embedded sizes of the linear layers (between 8 and 512)
-
-
Initial learning rate (between 0.0001 and 0.001)
For the research, we use a Tree-structured Parzen Estimator sampler (Bergstra et al., 2011) with a HyperBandPruner (Li et al., 2017). The metric to optimize is the F1-score. It can be defined as follows:
with \(\beta = 1 \)
This metric is suited for our classification task, as the dataset may be unbalanced depending on the tire zone.
Attention mechanism for multimodal features fusion
A self-attention layer may be useful to focus on the most relevant information inside each modality. As we have two modalities (images and tabular data), each of them has its own multiheaded self-attention module. This attention module first linearly projects its input into a Query (Q), Key (K) and Value (V). Then, the vector V is multiplied by the attention weight obtained from the scaled dot-product of the Query and Key passed through a Softmax layer. Formally, it can be written as follows:
Applied to \(x_{img}\) and \(x_{tab}\), we obtain two output vectors \(x'_{img}\) and \(x'_{tab}\) respectively.
The multiheaded attention is based on this mechanism except that each combination of K, Q, V is split into multiple heads and the dot-product attention is applied to each head independently.
The Cross-Attention for inter-modality feature fusion module also relies on the same principle as for the self-attention. The main difference lies in the fact that we want image feature to guide the selection of relevant features from tabular data and vice versa. For this purpose, the cross-attention module is designed as follows: the Query \(Q_{img}\) and Value \(V_{img}\) come from \(x'_{img}\) projection and the Key \(K_{tab}\) is taken from the output of the tabular features went through its self-attention module. This time, the output can be written as:
The same module is built symmetrically in order to guide the selection of relevant tabular features from images:
Finally, we concatenate \( x''_{img}\) and \( x''_{tab}\) to obtain the final feature vector that is passed to the last MLP.
Implementation details
In our experiments, for each zone, we are splitting the data with 80% for training and 20% for validation. To get an equal amount of samples viewed with the majority class for each zone, a balancing method is used: we repeat the less represented classes. For the defect detection and severity classification tasks, the training and validation sets differ because we want our severity classification model to be able to generalize on less certain predictions from the detection model (training examples will generally have a higher classification and IoU score than validation samples from the MASK-RCNN). In regard of the deep learning parts, our implementations are based on the pytorch framework, and the Adam optimizer (Kingma & Ba, 2014) is used.
Detection stage
For the first global training, we take all images from different tire zones, and we resize them to a size of 1024*1024 pixels. The initial learning rate is 0.0002 with a batch size of 4 per GPU and the weights of the loss are equal to \(\lambda _1=\lambda _2=\lambda _3=\lambda _4=\lambda _5=\lambda _6=\lambda _7=1\). After each epoch, the learning rate is decreased by 0.5 and we train the network until there is no further improvement after 6 epochs. As for the data augmentation, we consider that the acquisition system is well controlled and for this reason we only apply Color Jitter before resizing. Adding unrealistic augmentations would not help generalization as images have a low real variability. Mixed precision is applied with a distributed data parallel strategy on eight T4 GPUs. All the original MASK-RCNN hyperparameters are kept as they were initially in torchvision except the box_nms_threshold and rpn_nms_threshold with custom values set at 0.05 and 0.3 respectively.
For the fine-tuning of the MASK-RCNN per zone, we retain the same parameters as for the global pre-training apart from the initial learning rate, whose value is reduced to 5e-05. The number of images used and the custom size per zone is defined in Fig. 8. The batch size per GPU is set to 1.
Severity classification stage
The process of extracting patch features involves fine-tuning of a resnet18 classifier previously trained on Imagenet. The patch size is 128*128 for all zones, except for the interior shoulder with a patch size of 258*258 because of the difference in size of the original image. The batch size is 128, the initial learning rate is 0.0005 and the network is trained for 15 epochs with cross-entropy loss. We also trained one model per zone, utilizing the same images as in the detection stage, albeit at a patch scale.
The tabular data processing encodes categorical features (defect type, camera zone and tire informations) with embeddings. The number of neurons chosen for each embedding corresponds to half of the possible input values (for example if we have 4 dimensions in the dataset, the corresponding embedding will encode this information into 2 neurons). In addition, as proposed by Cai et al. (2022), we introduced a Soft Label Encoder (SLE), which means that instead of filling negative categorical values with 0, we fill them with the value 0.1. The aim of SLE is to help the categorical tabular features to be more expressive and more suitable for the input of the network. We create a special category for rare occurrences of categorical features where we can group them together. After the individual features extraction from categorical and numerical values through embeddings and a linear layer respectively, these features are concatenated and sent to a new MLP which stacks two successions of linear layers, batch normalizations and ReLu separated with a Dropout. For the self-attention and cross-attention modules, we fix the head number of the multiheaded attention to 8.
As this stage relies on the initial detection outputs, the number of rows (where each row corresponds to a detection in the first stage) is provided in Table 1. As evident, the count of detected instances is higher in the exterior zones due to the larger quantity of images and a comparatively elevated defect rate.
The Hyperparameters search is constrained by the following settings: the maximum number of epochs is set to 70 and the minimum number of epochs before early stopping is set to 20. The optimizer is coupled with a step scheduler which multiply by 0.2 the learning rate every 10 epochs. The parameters of the resnet18 are frozen, only the GRU and metadata parts are trained to optimize the cross-entropy loss.
Results
Detection stage
As we can see in Table 2, the F1-score is not uniform across the zones and defect types, as we depend on available data and the quality of the annotation. Furthermore, defects may vary from one zone to another, and the number of examples also varies. These results might seem weak at first glance, but this detection task can be extremely difficult; for instance, it takes an aspect operator six months to get proficient at detecting these defects directly on the tire.
If we look at the results in details, contrast differences and surface roughness have the lowest scores in average, because it’s hard to label them as they can be diffused. As a result, even if the metric is not as high as expected, the qualitative results are satisfying (see Table 4) which we believe is sufficient for the next part since the severity classification task will reduce false positives. In addition, the quality of the annotations could be challenged: some defects are very hard to label due to their diffuse shape or because of the proximity between certain classes which leads the model to predict several instances of each defect type that are similar at the same location. These annotation difficulties are illustrated in Table 5.
Severity classification stage
As we can see in Table 3, our deep learning multimodal architecture improves the F1-score by an average of 21% per zone compared with our baseline. Our experiences showed that LightGBM (Ke et al., 2017) performed best for this classifier with one fine-tuned model per zone. As a reminder, this simple model consists of a binary classifier that only takes tabular data as input. We used the library Pycaret for this experiment.
Due to the dependency of this classification stage on the quality of the detection stage, it is imperative to experimentally verify the utility of IoU branches for the classification process. Essentially, this entails assessing whether the predicted IoU effectively supplements the severity classifier when MASK-RCNN fails to provide confident detections. In such instances, the predicted IoU is expected to be low, thus becoming a crucial feature for severity classification. To scrutinize this aspect, we employed the Shapley additive explanations (SHAP) method (Lundberg & Lee, 2017) to analyze the feature importance of the baseline boosting tree classifier. The Shapley values derived from the boosting tree model trained on interior tread data are illustrated in Fig. 11. Notably, the box IoU emerges as the third most influential feature, preceding even the confidence score, while the mask IoU also demonstrates significant importance as the eighth feature. This observation validates our hypothesis, affirming two key points:
-
1.
The effectiveness of the additional branches predicting Mask IoU and bbox IoU.
-
2.
The resilience of the severity classification stage in relation to the detection stage, as it can leverage predicted IoU scores as confidence features to refine severity predictions. In instances where the initial detection model’s performance is inadequate for certain images, this deficiency is accounted for by the second stage model through the confidence score and predicted IoU scores.
Upon further analysis of Fig. 11 (refer to Second stage: severity classification subsection for detailed definitions of each feature), it becomes evident that both the area and vertical position are the most influential factors for this zone, exhibiting a clear positive correlation in the former and a more intricate relationship in the latter. This finding is logical and confirms that the model prioritizes relevant features; indeed, it is well-established that a larger defect area generally correlates with increased severity probability. Additionally, regarding vertical position, certain locations exhibit abrupt increases in defect severity, underscoring its significance in the model’s decision-making process.
The Top 12 Shapley values reveal several other noteworthy features. For instance, Sector 12 (where a tire is segmented into 12 sectors to assess the horizontal position of a defect) indicates a lower likelihood of severe defects overall. Furthermore, Visual Family Bumps emerges as another significant criterion positively correlated with severity for the interior tread, a conclusion consistent with expert opinions.
In summary, the Shapley values align with established quality rules. It would be intriguing to explore whether this model interpretation could potentially simplify these rules in future analyses.

Feature importance analysis of baseline boosting tree model tuned on interior tread zone: focusing on the Top 12 Shapley values
We also wanted to evaluate the impact of the metadata tire information, which is why we made an ablation study focused on the area most affected: the exterior of the tread (tire metadata such as the range is correlated to the tread patterns). As a result, we noticed a +1% point increase on the F1-score with the addition of tire metadata on this specific zone. We didn’t pursue experiments on other zones due to the computational cost of searching for hyperparameters. For the same reasons, we didn’t compare the effectiveness of the multimodal concatenation through attention with a simple concatenation. Besides, this concatenation method has already been validated as being better for multimodal features fusion (Ou et al., 2022) and (Cai et al., 2022). Nevertheless, we carried out empirical tests on the outer tread area and found a gain of around 1% point on the F1-score with the attention mechanism.
Discussion and conclusion
A new approach for detecting tire defect surfaces and classifying their severity is proposed in this article, with an F1-score that varies from 0.7 to 0.89 depending on the tire zone. These results are highly satisfactory in relation to the task difficulty and the huge quantity of defect types. While the performance of the second stage relies on the outcomes of the initial detection phase, our experimental findings underscore its robustness and validate the significance of the two IoU prediction branches in encapsulating a form of uncertainty inherent in the initial model, effectively captured by the classification model. This is also the first study to propose a functional method for all tire zones at the same time. The novelty also lies in the use of tire metadata and the multimodal aspect. However, our results can be further improved by working on the data: using model output to improve the quality of annotations. Also, for the time being, we aren’t defining an aggregation strategy for the predictions, the tire severity decision is taken at the bounding box scale, but ideally, we would like to have a model that makes a single decision at the image or tire scale, i.e., one that can capture the existing relationships between the detected defects. Additionally, our architecture is deployable but complex to implement, as it involves a certain number of steps (detection, pre-training of patches classifier, hyperparameters searching etc...). Without any optimization, the total inference time for each zone of the tire is empirically measured at 20 s. It would be interesting to study whether this time could be reduced.
Another interesting approach that has not yet been tested is semantic segmentation, which involves a simpler architecture but does not allow individual defect instances to be identified.
Data Availibility
The datasets generated during and/or analyzed as part of the current study are not publicly available due to the confidential information they contain about the process and quality standards.
References
Aminzadeh, M., & Kurfess, T. (2019). Online quality inspection using bayesian classification in powder-bed additive manufacturing from high-resolution visual camera images. Journal of Intelligent Manufacturing, 30, 2505–2523. https://doi.org/10.1007/s10845-018-1412-0
Bergstra, J., Bardenet, R., Bengio, Y., & Kégl, B. (2011). Algorithms for hyper-parameter optimization. In Advances in Neural Information Processing Systems, volume 24.
Cai, G., Zhu, Y., Wu, Y., Jiang, X., Ye, J., & Yang, D. (2022). A multimodal transformer to fuse images and metadata for skin disease classification. The Visual Computer, 39(7), 2781–2793. https://doi.org/10.1007/s00371-022-02492-4
Chung, J., Gulcehre, C., Cho, K., & Bengio, Y. (2014). Empirical evaluation of gated recurrent neural networks on sequence modeling.
Deng, J., Dong, W., Socher, R., Li, L.-J., Li, K., & Li, F.-F. (2009). Imagenet: a large-scale hierarchical image database. In 2009 IEEE Conference on Computer Vision and Pattern Recognition (pp. 248–255). https://doi.org/10.1109/CVPR.2009.5206848.
Girshick, R. (2015). Fast r-cnn. In 2015 IEEE International Conference on Computer Vision (ICCV) (pp. 1440–1448).
Hafizur, M., & Masum, M. H. R. (2014). Visualizing and understanding convolutional networks. In Computer Vision—ECCV 2014 (pp. 818–833). https://doi.org/10.13140/RG.2.2.12182.22080.
He, K., Gkioxari, G., Dollar, P., & Girshick, R. (2017). Mask r-cnn. (pp. 2980–2988). https://doi.org/10.1109/ICCV.2017.322.
Hearst, M., Dumais, S., Osman, E., Platt, J., & Scholkopf, B. (1998). Support vector machines. Intelligent Systems and Their Applications, IEEE, 13, 18–28. https://doi.org/10.1109/5254.708428
Huang, Z., Huang, L., Gong, Y., Huang, C., & Wang, X. (2019). Mask scoring r-cnn. In 2019 IEEE/CVF Conference on Computer Vision and Pattern Recognition (CVPR) (pp. 6402–6411).
Kang, G., Gao, S., Yu, L., & Zhang, D. (2018). Deep architecture for high-speed railway insulator surface defect detection: Denoising autoencoder with multitask learning. IEEE Transactions on Instrumentation and Measurement, 68, 2679–2690. https://doi.org/10.1109/TIM.2018.2868490
Ke, G., Meng, Q., Finley, T., Wang, T., Chen, W., Ma, W., Ye, Q. & Liu, T.-Y. (2017). Lightgbm: A highly efficient gradient boosting decision tree (Vol. 30, pp. 146–3154).
Kingma, D., & Ba, J. (2014). Adam: A method for stochastic optimization. In International Conference on Learning Representations.
Kirillov, A., Mintun, E., Ravi, N., Mao, H., Rolland, C., Gustafson, L., Xiao, T., Whitehead, S., Berg, A. C., Lo, W.-Y., Dollár, P., & Girshick, R. (2023). Segment anything. arXiv:2304.02643.
Kuo, J., Tung, C.-P., & Weng, W. (2019). Applying the support vector machine with optimal parameter design into an automatic inspection system for classifying micro-defects on surfaces of light-emitting diode chips. Journal of Intelligent Manufacturing, 30, 727–741. https://doi.org/10.1007/s10845-016-1275-1
Kuric, I., Klarak, J., Sága, M., Císar, M., Hajdučík, A., & Wiecek, D. (2021). Analysis of the possibilities of tire-defect inspection based on unsupervised learning and deep learning. Sensors, 21, 7073. https://doi.org/10.3390/s21217073
Li, L., Jamieson, K., DeSalvo, G., Rostamizadeh, A., Talwalkar, A. (2017). Efficient hyperparameter optimization and infinitely many armed bandits. In 5th International Conference on Learning Representations (p. 03).
Lin, S.-L. (2023). Research on tire crack detection using image deep learning method. Scientific Reports, 13, 8027. https://doi.org/10.1038/s41598-023-35227-z
Liu, H., Jia, X., Su, C., Yang, H., & Li, C. (2023). Tire appearance defect detection method via combining hog and lbp features. Frontiers in Physics, 10, 1099261. https://doi.org/10.3389/fphy.2022.1099261
Loupos, K., Makantasis, K., Protopapadakis, E., Doulamis, A., & Doulamis, N. (2015). Deep convolutional neural networks for efficient vision based tunnel inspection. In 2015 IEEE international conference on intelligent computer communication and processing (ICCP) (pp. 335–342) https://doi.org/10.1109/ICCP.2015.7312681
Lundberg, S. M., & Lee, S.-I. (2017). A unified approach to interpreting model predictions. (pp. 4765–4774).
Massaro, A., Dipierro, G., Cannella, E., & Galiano, A. (2020). Comparative analysis among discrete fourier transform, k-means and artificial neural networks image processing techniques oriented on quality control of assembled tires. Information (Switzerland), 11, 257. https://doi.org/10.3390/info11050257.
Mourougaya, F. (2019). Système d’évaluation de l’état de la surface d’un pneumatique. https://data.inpi.fr/brevets/WO2021105597?q=Syst%C3%A8me%20d%27%C3%A9valuation%20de%20l%27%C3%A9tat%20de%20la%20surface%20d%27un%20pneumatique#WO2021105597.
Ou, C., Zhou, S., Yang, R., Jiang, W., He, H., Gan, W., Chen, W., Qin, X., Luo, W., Pi, X., & Li, J. (2022). A deep learning based multimodal fusion model for skin lesion diagnosis using smartphone collected clinical images and metadata. Frontiers in Surgery. https://doi.org/10.3389/fsurg.2022.1029991
Protopapadakis, E., & Doulamis, N. (2015). Image based approaches for tunnels’ defects recognition via robotic inspectors (pp. 706–716). https://doi.org/10.1007/978-3-319-27857-5_63.
Ren, S., He, K., Girshick, R., & Sun, J. (2015). Faster r-cnn: Towards real-time object detection with region proposal networks. IEEE Transactions on Pattern Analysis and Machine Intelligence, 39, 1137–1149. https://doi.org/10.1109/TPAMI.2016.2577031
Soukup, D., & Huber-Mörk, R. (2014). Convolutional neural networks for steel surface defect detection from photometric stereo image (pp. 668–677). https://doi.org/10.1007/978-3-319-14249-4_64.
Sun, X., Gu, J., Huang, R., Zou, R., & Palomares, B. (2019). Surface defects recognition of wheel hub based on improved faster r-cnn. Electronics, 8, 481. https://doi.org/10.3390/electronics8050481
Tabernik, D., Šela, S., Skvarc, J., & Skočaj, D. (2019). Segmentation-based deep-learning approach for surface-defect detection. Journal of Intelligent Manufacturing, 31, 759–776. https://doi.org/10.1007/s10845-019-01476-x
Tada, H., & Sugiura, A. (2021). Defect classification on automobile tire inner surfaces with functional classifiers. Transactions of the Institute of Systems, Control and Information Engineers, 34, 1–10. https://doi.org/10.5687/iscie.34.1
Tripathi, S., Singh, S. K., & Lee, H. (2021). An end-to-end breast tumour classification model using context-based patch modelling—a bilstm approach for image classification. Computerized Medical Imaging and Graphics, 87, 101838.
Vaidya, S., Ambad, P. M., & Bhosle, S. M. (2018). Industry 4.0—A glimpse. Procedia Manufacturing, 20, 233–238.
Vaswani, A., Shazeer, N., Parmar, N., Uszkoreit, J., Jones, L., Gomez, A. N., Kaiser, L. u., & Polosukhin, I. (2017). Attention is all you need. In Proceedings of the 31st International Conference on Neural Information Processing Systems (Vol. 30, pp. 6000–6010). Curran Associates, Inc. https://doi.org/10.5555/3295222.3295349.
Vincent, P., Larochelle, H., Bengio, Y., & Manzagol, P.-A. (2008). Extracting and composing robust features with denoising autoencoders (pp. 1096–1103). https://doi.org/10.1145/1390156.1390294.
Wang, J., Shaoguo, W., Chen, K., Yu, J., gao, P., & Xie, G. (2020). Semi-supervised active learning for instance segmentation via scoring predictions. In BMVC 2020.
Yan, H., Li, Z., Li, W., Wang, C., Wu, M., & Zhang, C. (2021). Contnet: Why not use convolution and transformer at the same time? arXiv preprint arXiv:2104.13497.
Zhou, Z., Lu, Q., Wang, Z., & Huang, H. (2019). Detection of micro-defects on irregular reflective surfaces based on improved faster r-cnn. Sensors, 19, 5000. https://doi.org/10.3390/s19225000
Author information
Authors and Affiliations
Corresponding author
Ethics declarations
Conflict of interest
The authors declare that they have no Conflict of interest.
Additional information
Publisher's Note
Springer Nature remains neutral with regard to jurisdictional claims in published maps and institutional affiliations.
Rights and permissions
Open Access This article is licensed under a Creative Commons Attribution 4.0 International License, which permits use, sharing, adaptation, distribution and reproduction in any medium or format, as long as you give appropriate credit to the original author(s) and the source, provide a link to the Creative Commons licence, and indicate if changes were made. The images or other third party material in this article are included in the article’s Creative Commons licence, unless indicated otherwise in a credit line to the material. If material is not included in the article’s Creative Commons licence and your intended use is not permitted by statutory regulation or exceeds the permitted use, you will need to obtain permission directly from the copyright holder. To view a copy of this licence, visit http://creativecommons.org/licenses/by/4.0/.
About this article

Cite this article
Mignot, T., Ponchon, F., Derville, A. et al. An automatic inspection system for the detection of tire surface defects and their severity classification through a two-stage multimodal deep learning approach. J Intell Manuf (2024). https://doi.org/10.1007/s10845-024-02378-3
Received:
Accepted:
Published:
DOI: https://doi.org/10.1007/s10845-024-02378-3