
Abstract
This paper quantitatively derives the welfare-improving earnings test within an optimal income tax framework. I construct a life cycle model of labor supply and savings to compute social welfare. The preference parameters are estimated by the method of simulated moments using Japanese data. I find that social welfare under the current earnings test with large changes of marginal tax rates at thresholds is substantially lower than social welfare under the earnings test with a linear tax rate. In addition, an earnings test with negative marginal tax rates will increase social welfare more than a system without negative marginal tax rates.


Notes
In the U.S, the marginal tax rates are 0%, 33%, or 50%. There are disproportionate jumps at the threshold.
Basic Policy on Economic and Fiscal Management and Reform 2019.
This model is based on the pension system in 2013, so I assume that all people start to receive pension benefit after 60.
In French (2005), matching moments are the life cycle profile of savings, hours worked, and labor force participation rate. The life cycle profile of savings is included in this paper. The life cycle profile of hours worked and labor force participation rate are not directly included in the matching moments, but they are used as an out of sample validation.
The estimated coefficient of \({ I} \{60\le age \}\) is − 0.13 (0.068). The coefficient is statistically significant. Estimated values of \(\beta _1\) and \(\beta _2\) are − 0.12 (0.08) and 0.0008 (0.0007). Values in parentheses are the standard error.
To compensate for the small sample size, people aged between 50 and 52 are used to estimate the wealth distribution at the initial period.
Assuming certainty and the interior condition, the Frisch elasticity of labor is \(- \frac{L-H_t-\theta }{H_t} \times \frac{\gamma (1-\nu )-1}{\nu }\). The elasticity of labor depends on the ratio of leisure to labor, so it is age-dependent.
The relative risk aversion is from \(-C_t \times \frac{\partial ^2 U_t / \partial ^2 C_t}{ \partial U_t / \partial C_t} = - \left( \gamma (1-\nu ) -1 \right) \).
The figures show the simulation and data of matching moments. (a) is the share of not working, part-time, and full-time for people aged above 60. Part-time workers are defined as people who work between 1 and 36 h per week. Full-time workers are defined as people who work more than 36 h per week. (b) is the 20th, 40th, 60th, and 80th percentile of earnings for people above 60. (c) is the profile of mean savings. The horizontal axis is age.
The value of \(\mu \) is close to the value in Blundell and Shephard (2011). \(-\mu =-\Gamma ^{\prime \prime } (U,\mu ) / \Gamma ^\prime (U,\mu )\) so that \(-\mu \) can be interpreted as the absolute inequality aversion.
In this model, the government’s expenditure is only pension benefit. The pension benefit which individuals receive is the full amount of pension benefit minus the deduction by the earnings test. The full amount of pension benefit is described in Appendix 1.2. The earnings test’s deduction amount depends on the full amount of pension benefit and earnings. Detail is described in Appendix 1.1. The government budget constraint states that this expenditure should not exceed exogenously given \({\bar{T}}\). There is no source of income for the government.
When the counterfactual earnings test is defined as (20), Eq. (19) can be rewritten as
$$\begin{aligned}&\text{ Average } \text{ pension } \text{ before } \text{ deduction } - \tau \times \text{ Average } \text{ labor } \text{ income } + \text{ Transfer }\times \text{ Labor } \text{ force } \text{ participation } \text{ rate }\\\le & {} \text{ Average } \text{ pension } \text{ before } \text{ deduction } - \text{ Average } \text{ deduction } \text{ under } \text{ the } \text{ current } \text{ earnings } \text{ test } \end{aligned}$$The left-hand side is the pension expenditure under the counterfactual earnings test, and the right-hand side is the pension expenditure under the current earnings test. In the later quantitative exercise, average annual pension expenditure before deduction is approximately 800,000 yen. Under the optimal earnings test derived in Sect. 8.1, \(\tau =0.1\), and annual transfer is 200,000 yen. In the later simulation, \(\tau \times \text{ Average } \text{ labor } \text{ income }\) is 100,000 yen. Transfer \(\times \) Labor force participation rate is 75,000 yen. Average pension deduction under the current earnings test is 25,000 yen. Therefore, Eq. (19) holds with equality.
Pension expenditure when raising pension eligibility age by 1 year is approximately equal to that when cutting pension benefits by 40,000 yen in my model.
For comparison, I list the example of welfare gain from policies. Krusell et al. (2009) show that the welfare gain from eliminating business cycles is 1% in consumption equivalence. Lucas and Robert (2003) shows that welfare gain from reducing the annual inflation rate from 10 to 0% is a perpetual consumption flow of 1% of income.
Basic Policy on Economic and Fiscal Management and Reform 2019.
Source ‘The fourth Social Security Council in 2011’ by The Ministry of Health, Labor and Welfare. One trillion yen is 1% of the total annual government expenditure in Japan.
The labor force participation rate for people aged above 50 years old is analyzed.
References
Altonji, J. G., & Segal, L. M. (1996). Small-sample bias in GMM estimation of covariance structures. Journal of Business and Economic Statistics, 14(3), 353–366.
Attanasio, O. P., & Weber, G. (1995). Is consumption growth consistent with intertemporal optimization? Evidence from the consumer expenditure survey. Journal of Political Economy, 103(6), 1121–1157.
Blundell, R., & MaCurdy, T. (1999). Labor supply: A review of alternative approaches. Handbook of labor economics (Vol. 3, pp. 1559–1695). Elsevier.
Blundell, R., Brewer, M., Haan, P., & Shephard, A. (2009). Optimal income taxation of lone mothers: An empirical comparison of the UK and Germany. The Economic Journal, 119(535), F101–F121.
Blundell, R., & Shephard, A. (2011). Employment, hours of work and the optimal taxation of low-income families. The Review of Economic Studies, 79(2), 481–510.
Börsch-Supan, A., Bucher-Koenen, T., Kutlu-Koc, V., & Goll, N. (2018a). Dangerous flexibility-retirement reforms reconsidered. Economic Policy, 33(94), 315–355.
Börsch-Supan, A., Härtl, K., & Leite, D. N. (2018b). Earnings test, non-actuarial adjustments and flexible retirement. Economics Letters, 173, 78–83.
Braun, R. A., Kopecky, K. A., & Koreshkova, T. (2017). Old, sick, alone, and poor: A welfare analysis of old-age social insurance programmes. The Review of Economic Studies, 84(2), 580–612.
Braun, R. A., Kopecky, K. A., & Koreshkova, T. (2019). Old, frail, and uninsured: Accounting for features of the US Long-Term care insurance market. Econometrica, 87(3), 981–1019.
Brinch, C. N., Fredriksen, D., & Vestad, O. L. (2018). Life expectancy and claiming behavior in a flexible pension system. The Scandinavian Journal of Economics, 120(4), 979–1010.
De Nardi, M., French, E., & Jones, J. B. (2010). Why do the elderly save? The role of medical expenses. Journal of Political Economy, 118(1), 39–75.
Diamond, P. A. (1998). Optimal income taxation: An example with a U-shaped pattern of optimal marginal tax rates. American Economic Review, 83–95.
Disney, R., & Smith, S. (2002). The labour supply effect of the abolition of the earnings rule for older workers in the United Kingdom. The Economic Journal, 112(478), C136–C152.
French, E. (2005). The effects of health, wealth, and wages on labour supply and retirement behaviour. The Review of Economic Studies, 72(2), 395–427.
French, E., & Jones, J. B. (2011). The effects of health insurance and self-insurance on retirement behavior. Econometrica, 79(3), 693–732.
Friedberg, L. (2000). The labor supply effects of the social security earnings test. Review of Economics and Statistics, 82(1), 48–63.
Fukai, T., Ichimura, H., Kitao, S., & Mikoshiba, M. (2021). Medical expenditures over the life cycle: Persistent risks and insurance.
Geyer, J., Haan, P., Hammerschmid, A., & Peters, M. (2020). Labor market and distributional effects of an increase in the retirement age. Labour Economics, 101817.
Gourinchas, P.-O., & Parker, J. A. (2002). Consumption over the life cycle. Econometrica, 70(1), 47–89.
Gruber, J., & Wise, D. A. (Eds.) (1999). Social security and retirement around the world. National Bureau of Economic Research. Conference Report. University of Chicago Press.
Gustman, A. L., & Steinmeier, T. L. (1986). A structural retirement model. Econometrica, 54(3), 555–584.
Heckman, J. J. (1976). A life-cycle model of earnings, learning, and consumption. Journal of Political Economy, 84(4), S9–S44.
Ichimura, H., Hashimoto, H., & Shimizutani, S. (2009). Japanese study of aging and retirement. JSTAR first results.
Immervoll, H., Kleven, H. J., Kreiner, C. T., & Saez, E. (2007). Welfare reform in European countries: A microsimulation analysis. The Economic Journal, 117(516), 1–44.
İmrohoroğlu, S., & Kitao, S. (2009). Labor supply elasticity and social security reform. Journal of Public Economics, 93(7–8), 867–878.
Imrohoroğlu, S., & Kitao, S. (2012). Social security reforms: Benefit claiming, labor force participation, and long-run sustainability. American Economic Journal: Macroeconomics, 4(3), 96–127.
Kitao, S. (2015). Fiscal cost of demographic transition in Japan. Journal of Economic Dynamics and Control, 54, 37–58.
Kondo, A. (2014). Does the Elderly Employment Security Act increase the employment of elderly people? The policy evaluation of the Elderly Employment Security Act. Journal of Japanese Labor Research, 56(1), 13–22.
Kondo, A., & Shigeoka, H. (2017). The effectiveness of demand-side government intervention to promote elderly employment: Evidence from Japan. ILR Review, 70(4), 1008–1036.
Kopecky, K. A., & Koreshkova, T. (2014). The impact of medical and nursing home expenses on savings. American Economic Journal: Macroeconomics, 6(3), 29–72.
Krusell, P., Mukoyama, T., Sahin, A., & Smith, A. A., Jr. (2009). Revisiting the welfare effects of eliminating business cycles. Review of Economic Dynamics, 12(3), 393–404.
Kuroda, S., & Yamamoto, I. (2008). Estimating Frisch labor supply elasticity in Japan. Journal of the Japanese and International Economies, 22(4), 566–585.
Laroque, G. (2005). Income maintenance and labor force participation. Econometrica, 73(2), 341–376.
Laun, T., & Wallenius, J. (2016). Social insurance and retirement: A cross-country perspective. Review of Economic Dynamics, 22, 72–92.
Lucas, R. E., Jr. (2003). Macroeconomic priorities. American Economic Review, 93(1), 1–14.
MaCurdy, T. E. (1981). An empirical model of labor supply in a life-cycle setting. Journal of Political Economy, 89(6), 1059–1085.
Mirrlees, J. A. (1971). An exploration in the theory of optimum income taxation. The Review of Economic Studies, 38(2), 175–208.
Oecd. (2016). Pensions at a glance. OECD.
Pakes, A., & Pollard, D. (1989). Simulation and the asymptotics of optimization estimators. Econometrica: Journal of the Econometric Society, 1027–1057.
Powell, J. L. (1994). Estimation of semiparametric models. Handbook of Econometrics, 4, 2443–2521.
Rogerson, R., & Wallenius, J. (2013). Nonconvexities, retirement, and the elasticity of labor supply. American Economic Review, 103(4), 1445–62.
Saez, E. (2002). Optimal income transfer programs: Intensive versus extensive labor supply responses. The Quarterly Journal of Economics, 117(3), 1039–1073.
Sefton, J., Van De Ven, J., & Weale, M. (2008). Means testing retirement benefits: Fostering equity or discouraging savings? The Economic Journal, 118(528), 556–590.
Song, J. G., & Manchester, J. (2007). New evidence on earnings and benefit claims following changes in the retirement earnings test in 2000. Journal of Public Economics, 91(3–4), 669–700.
Tran, C., & Woodland, A. (2014). Trade-offs in means tested pension design. Journal of Economic Dynamics and Control, 47, 72–93.
Vigtel, T. C. (2018). The retirement age and the hiring of senior workers. Labour Economics, 51, 247–270.
Acknowledgements
This paper is based on my master’s thesis at the University of Tokyo. I am extremely grateful to my advisor Shintaro Yamaguchi for his guidance and support throughout this project. I appreciate two anonymous referees and editors of International Tax and Public Finance, especially David R. Agrawal, for their critical comments that improve this paper substantially. I thank Kosuke Aoki, Kei Ikegami, Sagiri Kitao, Daiji Kawaguchi, Andrew Griffin, Daniel Marszalec, Shiko Maruyama, Tomoyuki Nakajima, Koki Okumura for their helpful comments. All remaining errors are mine. Data used in this article can be obtained from Research Institute of Economy, Trade and Industry. The author has no relevant or material financial interests that relate to the research described in this paper.
Funding
Funding was provided by Mccracken fellowship.
Author information
Authors and Affiliations
Corresponding author
Additional information
Publisher's Note
Springer Nature remains neutral with regard to jurisdictional claims in published maps and institutional affiliations.
Supplementary Information
Below is the link to the electronic supplementary material.
Appendix 1: Pension system in Japan
Appendix 1: Pension system in Japan
1.1 Earnings test in Japan
In Japan, earnings test is targeted to people above 60. Earnings test which people aged between 60 and 64 years old face is the following. I define monthly earnings as annual salaries plus annual bonus divided by 12. Total income is the sum of monthly earnings and monthly pension. Note that 100 yen \(\approx \) 1 USD. There are five cases.
-
1.
If the total income is below 2,80,000 yen, pension is not deducted. deduction = 0
-
2.
The case when monthly pension is below 2,80,000 yen and the total income is below 470000 yen deduction = (monthly earnings + monthly pension − 2,80,000) \(\times \) 0.5 \(\times \) 12
-
3.
When monthly pension below 2,80,000 yen and the total income is above 4,70,000 yen deduction = (4,70,000 + monthly pension − 2,80,000) \(\times \) 0.5 + (monthly earnings − 4,70,000) \(\times \) 12
-
4.
When monthly pension above 2,80,000 yen and the total income is below 4,70,000 yen deduction = monthly earnings \(\times \) 0.5 \(\times \) 12
-
5.
When monthly pension above 2,80,000 yen and the total income is above 4,70,000 yen deduction = 4,70,000 \(\times \) 0.5 + (monthly earnings − 4,70,000) \(\times \) 12
This amount of deduction is deducted from the pension benefit. Marginal tax rates are 0% or 50% or 100%. In the case 1, marginal tax rate is 0%. In the case 2 and 4, it is 50%. In the case 3 and 5, it is 100%. According to data set, almost all people receive monthly pension below 2,80,000 yen. 99 percentile of pension benefit is 2,50,000 yen, so the case 4 and 5 is excluded in my model.
Figure 11 describes the income deducted by the earnings test under different pension benefit. The horizontal axis is labor income. The vertical axis is the pension benefit deducted by the earnings test. When income is low, people get full amount of pension benefit. When the income is higher than a specified threshold, the marginal tax rate is 50%. When the income is higher than another threshold, they receive zero pension benefit and they face 0% marginal tax rate.
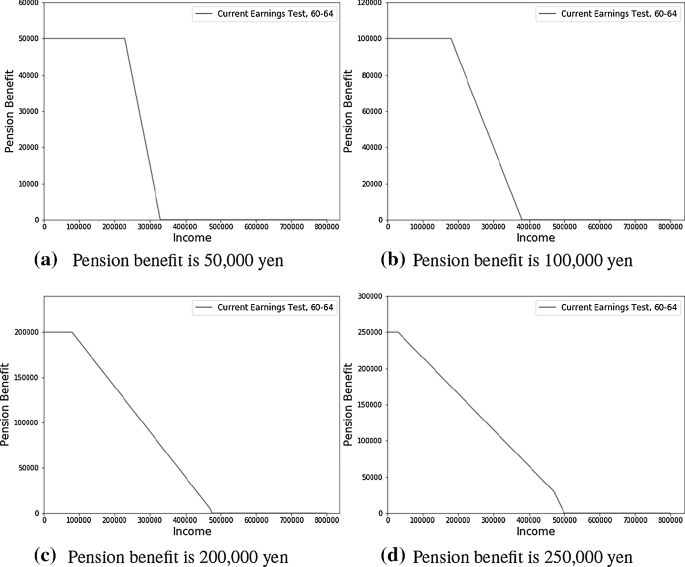
Earnings test targeted to 60–64
People aged above 65 years old face the following system.
-
1.
If the total income is below 4,70,000 yen, pension is not deducted. deduction = 0
-
2.
If the total income is above 4,70,000 yen, deduction = (monthly earnings + monthly pension − 4,70,000) \(\times \) 0.5 \(\times \) 12
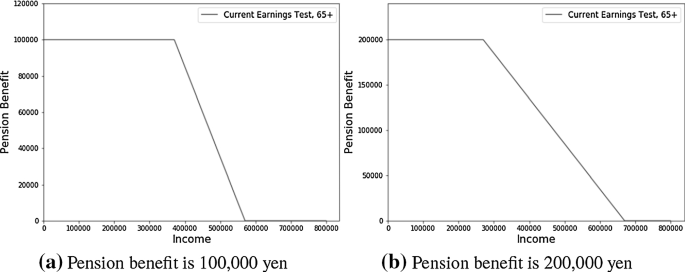
Earnings test targeted to 65+
Figure 12 shows the income deducted by the earnings test under different pension benefit. People above 65 face lower marginal tax rates than people aged 60–64. The area with zero marginal tax rates is broader than earnings test targeted to 60–64. Labor supply for people 60–64 is more discouraged.
1.2 Other aspects of pension system
First, I describe how the pension benefit before deduction that simulated individuals receive is decided in the model. Pension benefit is denoted as \(Pb_t\) in the budget constraint. In the Japanese system, the amount of pension benefit is the sum of basic part, which does not depend on past earnings, and the proportional part, which is proportional to past earnings. Since it is too complicated to incorporate the full pension system into the model, I simplify the pension system so that the distribution of pension benefits in data is approximately equal to the distribution pension benefits that simulated individuals receive in models.
In a simulated model, annual pension benefits people receive take 12 values that are equally distributed from 250,000 yen (\(\approx \) 2500 US dollars) to 3,000,000 yen (\(\approx \) 30,000 US dollars). The lower bound of 250,000 yen is considered as the fixed part of pension benefits. The reason why 3,000,000 yen is set as the upper bound is that 3,000,000 yen is 99 percentile of pension benefit in data. In a model, annual pension benefits people receive take 12 values that are equally distributed from 250,000 yen (\(\approx \) 2500 US dollars) to 3,000,000 yen (\(\approx \) 30,000 US dollars). The lower bound of 250,000 yen is considered as the fixed part of pension benefits. 17% of people in data receive pension benefits less than 250,000 yen. 3,000,000 yen is set as the upper bound because 3,000,000 yen is 99 percentile of pension benefit in data. Although 3,000,000 yen seems to be high, only 3% of people receive between 2,750,000 yen and 3,000,000 yen in data. Therefore, it is not quantitatively significant, but it is included for robustness.
Table 6 shows the distribution of pension pension benefits people receive in data. For example, 17% of people receive 250,000 yen of pension benefit in my model. This ratio is approximately equal to the ratio in my data set. In the same way, this distribution of pension benefits in simulated model is approximately equal to the distribution of pension benefits in data.
In the model, there is heterogeneity in the amount of pension benefits. Who receives higher pension benefits and who receives lower pension benefits in the model? The way to determine the individuals’ amount of pension benefits is based on by the total amount of wages they earned between 50 and 60 years old. In this sense, pension benefit is proportional to the past earnings. For instance, people whose amount of wages they earned between 50 and 60 years old is in the 10th percentile in this model receive the 10th percentile of pension distribution in the data, which is 250,000 yen. The pension benefit before deduction is constant over lifecycle though the earnings test is age-dependent.
Since the pension benefit is completely decided by exogenous wages in the model, individuals in this model will not increase their hours worked to receive more pension in the future. Once pension benefit is decided at 60 years old, it is constant over the life cycle in my model.
I discuss when people start to receive pension in my model. In Japan, people can choose the pension eligibility age under the current pension system. The eligibility age can be from 60 to 70 years old. In contrast, in my model, it is assumed that all people receive a pension from 60. The current pension system and my research objectives justify this assumption. My goal is finding the welfare improving earnings test. In Japan, even if working elderly people prolong to claim the pension benefit, pension is deducted by the earnings test. If they work, the amount of benefit, which they will receive in the future is decreased. Individuals cannot take advantage of delaying the claim of pension. For example, suppose there is a person A aged 60 who earns 400,000 yen monthly and can receive 300,000 yen of pension benefits monthly. Under the earnings test, 200,000 yen is deducted from pension benefits monthly if they receive pension benefits at 60. Importantly, even if they postpone their pension, 200,000 yen is deducted from pension benefits after they start to receive pension. Suppose a person A postpones pension benefits at 60 and start to receive them at 61. His pension benefit is 100,000 yen (= 300,000–200,000) at 61. In this sense, when people start to receive pension does not matter if this paper focuses on the earnings test. Therefore, it is justified to assume that all people receive a pension from 60 in my model. Also, in my data set, 68% of people start to receive pension from 60. 11% of people start to receive pension from 61. 10% of people of people start to receive pension between 62 and 64. 5% of people start to receive pension from 65. Given this data, I believe that the assumption that all people start to receive pension from 60 can be justified.
Rights and permissions
About this article

Cite this article
Okada, M. The optimal earnings test and retirement behavior. Int Tax Public Finance 30, 1036–1068 (2023). https://doi.org/10.1007/s10797-022-09734-0
Accepted:
Published:
Issue Date:
DOI: https://doi.org/10.1007/s10797-022-09734-0