
Abstract
The retail industry is becoming increasingly competitive; as a result, companies are seeking to reduce inefficiencies in their supply chains. One way of increasing the efficiency of operations inside a warehouse is by better allocating products in the available spaces. In this paper, we propose a new heuristic approach to solving the storage location assignment problem (SLAP) considering precedence constraints, in multi-aisle, multi-product picking warehouses. A two-phase heuristic procedure is developed: the products are clustered and assigned to the available spaces. We tested the procedure in the non-perishables warehouse of a real-world Portuguese retail chain, which supplies 191 stores per day. The results show that the new assignment of products allows for an improvement of up to 15% on the distance travelled by the pickers, which implies savings of approximately 477 km per month. This problem is a special case of SLAP since we are dealing with large percentages of non-uniform products. This procedure incorporates four relevant criteria for the allocation decision: the products’ similarity, demand and weight, and the distance travelled by the picker. By using a two-phase heuristic method, this study offers companies and academics an alternative and more effective solution for SLAP than the usual methods based on the creation of density zones.
1 Introduction
The retail sector plays a unique role in human activity. It serves over a billion times a day as the link between manufacturers and consumers across Europe. The retail and wholesale sector is a dynamic, labour-intensive and major area of the European economy. It generates 11% of the European gross domestic product (Eurocommerce 2019). It is also a major source of employment creation (Moons et al. 2018). Over 33 million Europeans work in this sector, and it is one of the few sectors steadily creating employment across Europe (Eurocommerce 2019).
Since the first half of 2013, the retail trade volume has been increasing relatively steadily. In the middle of 2019, it reached a level of 10 percentage points above the pre-crisis high; the equivalent of 111 million euros (Eurostat 2020). The above growth has been further enhanced by the arrival of the coronavirus pandemic. Between obeying the social distance guidelines and accounting for the closing of physical stores, retailers and customers have joined online platforms, making it more important than ever to have efficient picking operations to respond to smaller and customized orders (Ivanov 2020).
Order picking (OP) accounts for about 50% of the total operating costs of a warehouse (Tompkins et al. 2010; Richards 2014). The high cost of OP is mainly due to the fact that pickers spend approximately 50% of the total order picking time travelling, which is not productive (De Santis et al. 2018; Xie et al. 2018). Therefore, selecting the right OP method is a key decision for many retailers as it impacts their ability to meet their orders accurately and in a cost-effective manner (Bozer and Aldarondo 2018; Masae et al. 2020).
OP activities can be performed by humans or machines. OP systems involving humans can be organized as parts-to-picker or picker-to-parts systems. Unlike pickers-to-parts systems, parts-to-picker systems are automated to some extent (Gajšek et al. 2017). Even with the various advantages warehouse automation offers, OP is still characterized by a high share of human work (see Chen et al. 2018; Grosse et al. 2017; Kulak et al. 2012; Žulj et al. 2018). Eighty percent of warehouses are still manually operated (Chen et al. 2018; Grosse et al. 2015; Kulak et al. 2012). This is because, human operators are often more flexible than automated approaches, which is particularly important for heterogeneous product portfolios, which are increasingly common due to the increasing trend towards product customization. (Grosse et al. 2017).
One way of improving OP, in manual or automated warehouses, is by performing a better assignment of the products to the warehouses’ available spaces (Glock et al. 2019; Reyes et al. 2019). This gives rise to the storage location assignment problem (SLAP), which has been represented as a critical issue in operations since 1976 (Battista et al. 2011). A study performed by Reyes et al. (2019) shows that the number of publications in this area is still increasing.
Recently, research on SLAP has started to consider more realistic characteristics of real-world warehouse activities such as, for instance, characteristics of the products, like the perishability (see Farahani et al. 2012) and human factors (see Matusiak et al. 2014; Chabot et al. 2017). In practice, OP is often subject to precedence constraints (Chabot et al. 2017). These constraints express the fact that certain products need to be collected before others because of fragility, shape and size, or preferred unloading sequence. Such constraints can often be found in the retail sector in which the high percentages of non-uniform products require pickers to take special care while building the pallets in order to ensure that the products are not damaged during the OP operation (Shah and Khanzode 2018).
This paper deals with the precedence constraint of picking heavy products before light products. We investigate the influence of a new storage assignment strategy on OP productivity. This work is inspired by a practical case of a manual warehouse for retail products in Portugal. We propose a new integrated strategy for SLAP, an alternative two-phase heuristic for warehouses with a high level of non-uniform products that operate in a stock environment.
The heuristic procedure incorporates four criteria that were identified in the literature: the products’ similarity, the products’ demand (Liu 2004), the products’ weight (Diaz 2016) and the distance travelled by the picker (Diaz 2016). First, clustering analysis is performed to extract information about the correlation between the products. Second, a four-stage rule procedure is devised to assign the products into the available locations. The assignment of products is based on the correlated storage policy. This policy is based on the idea that the more the products with demand dependence are stored together, the greater the chance of reducing the distance travelled to collect the orders (Xiao & Zheng 2010).
Although SLAP, in general, has been fairly well researched in the literature, SLAP with precedence constraints, in this instance concerning weight, has not received much consideration (van Gils et al. 2018; Zûlj et al. 2018). In the studies that investigate this subject, the solutions regarding weight constraints consisted of creating density zones (Battini et al. 2015; Chabot et al. 2017; Diaz 2016) and/or limiting the number of boxes loaded on each other (Glock and Grosse 2012; Grosse et al. 2014; Xiao and Zheng 2012).
However, these strategies may not be appropriate for warehouses with a high number of non-uniform products. This is because, with the density zones, a significant number of fast moving products may be placed away from the start–end point (due to weight), and the capacity constraint may be impracticable when dealing with products with very different weights. Therefore, our research question can be defined as follows:
RQ
How can we set locations of the products in warehouses with high product-weight variability within fast moving products?
The main theoretical contribution of this paper is the development of an alternative heuristic procedure that answers our research question, inspired by the retail industry. SLAP was proved to be a non-deterministic, polynomial-time-hard (NP-hard) problem (Frazelle and Sharp 1989). Therefore, finding an exact solution for large orders becomes rapidly intractable, especially when the problem has to be solved multiple times a day. For this reason, a new heuristic procedure is proposed for large warehouses with high product-weight variability: one that uses the two phases of first, clustering and then, weight ordering, rather than employing density zones or capacity constraints.
Moreover, the proposed technique may be used to improve the performance of many other companies. Particularly companies that have high product-weigh variability, as happens in the retail industry, especially in the grocery sector, in which there is a high variety of products (i.e. household appliances, pets food, drinking straws). We derive insights for warehouse managers regarding the cost impact of the precedence constraint in the manual OP. We show that the developed heuristic performs well for SLAP with weight constraints, with high product-weight variability.
Section 2 presents the literature review. Section 3 provides the methodology. Section 4 describes our case study, and Sect. 5 gives its results and presents the sensitivity analysis. Section 6 provides the theoretical and managerial implications. Finally, Sect. 7 presents the main conclusion, limitations and future research.
2 Literature review
SLAP has received considerable attention in the literature. For example, Reyes et al. (2019) cite 71 publications on SLAP from 2005 to 2017. While van Gils et al. (2018) cite 61 publications on OP systems, from 1998 to 2017, with 30 on SLAP. However, the authors emphasize the need for research that particularly takes into account real-life characteristics, such as real-time order arrival, precedence constraints and multiple locations of a single product.
SLAP concerns the allocation of products into a storage space, with the aim of optimizing handling costs and best-utilizing storage space. SLAP complications include aspects such as storage area, storage space, warehouse capacity, the physical characteristics of the products, and product demand. In terms of complexity, Frazelle and Sharp (1989) classify SLAP as NP-hard, due to variations caused by the number of products and warehouse storage characteristics.
The literature presents several storage assignment policies that can be classified in one of the following main categories: random, dedicated, class-based or correlated storage. The random storage policy randomly assigns products to the available spaces in the warehouse. The dedicated storage policy, assigns products to a specific storage zone, according to predefined criteria. The class-based storage policy classifies the products and assigns them to a pre-established location, depending on their classification criteria. The correlated storage assignment policy locates products with a high degree of correlation to each other. The correlation between two products is usually based on the frequency with which they appear together in orders (Bindi et al. 2009).
2.1 Correlated assignment policy
A lot of studies have been designed for a correlated assignment policy. Various clustering and (meta-) heuristic approaches have been employed to apply this policy. Bindi et al. (2009) developed, tested and compared a set of different storage assignment policies based on the application of clustering techniques. The authors also proposed a similarity index to evaluate the correlation of two products based on turnover. Brynzér and Johansson (1996) proposed a storage assignment strategy based on the product structure. The authors considered the frequency of every co-occurrence demand of the varied groups of products to assign products to warehouse locations. Chuang et al. (2012) put forward a two-stage clustering-assignment problem model. The authors drew item association indices, based on the orders, through a mathematical programming model and then, applied assignment techniques to locate the clustered groups. Kim et al. (2020) developed heuristic methods to optimize the order picking travel distance based on slot selection and frequent itemset grouping. First, a slot selection strategy is applied to find the best slot for an individual product. Second, an itemset grouping is used to determine the order of products in sequence. Kofler et al. (2015) proposed an extension of the dynamic ABC approach developed by Pierre et al. (see Pierre et al. 2003) to generate robust assignments, suitable for warehouses that have frequent changes in demand patterns. Lee et al. (2020) proposed a two-stage storage assignment procedure of first, clustering and then, assignment; to minimize travel time and congestion for order-picking operations. Liu (2004) developed a zero–one quadratic generalized assignment model, to allocate products based on the characteristics of customer order demand. The author developed a heuristic procedure to find near-optimal solutions. Manzini et al. (2012) proposed different storage assignment rules based on the application of hierarchical clustering algorithms and positioning rules, supported by an ISO-time mapping of the storage area. Petering et al. (2017) linked a seaport container terminal’s overall productivity to the arrangement that automatically selected storage locations for export containers in real-time as they entered the depot. Rosenwein (1994) presented an optimization model, based on clustering techniques, to group products according to their demand and then allocate them to the available spaces. Wutthisirisart et al. (2015) proposed a linear placement algorithm to capture the correlation between two products based on both order frequency and order size. The authors addressed the situation in which the order size varied significantly from order to order. Yu et al. (2015) developed a travel time model and an algorithm that could be used for determining the optimal number and boundaries of storage classes in warehouses in a class-based storage assignment policy. Zhang (2016) presented diverse correlated storage assignment policies to reduce the travel distance in the picker-to-parts OP system in a single-block warehouse.
2.2 Weight precedent constraints
Our survey of the literature on correlated storage policies shows that constraints arising in real-world applications have often been neglected in prior research. Focusing on the precedence constraint of picking heavy items before light items, it is possible to find two different approaches. There is the creation of density zones, which means that products are placed, in zones, according to their weight. Within those zones, they are distributed by demand criteria—the highest demand products are placed in the aisle nearest to the start–end point (see Battini et al. 2015; Diaz 2010, 2016). Then, there is the approach of maximum capacity, that is limiting the number of boxes that can be loaded on top of each other (see Chabot et al. 2017; Glock and Grosse 2012; Grosse et al. 2014; Xiao and Zheng 2012). For instance, Battini et al. (2015) presented a storage assignment and travel distance estimation joint method, to design and evaluate a manual picker-to-parts picking system, focusing on goods allocation and distance estimation. The method is applicable at different levels of detail (macro, aisle and location level), allowing some flexibility within each area to establish some rules regarding the positioning of the products, which can encompass the weight of the products, in a form of density zones. Chabot et al. (2017) proposed two distinct mathematical models, solved by a branch-and-cut algorithm, and developed five heuristic methods to solve OP problems with weight, fragility and category constraints. Diaz (2010, 2016) developed a heuristic procedure based on quadratic integer programming to generate a solution that considers customer demand and order clustering. A simulation model is used to investigate the effects of creating and implementing these solutions in conjunction with density zones based on the products’ weight. Li et al. (2021) presented a heuristic method to optimize the order picking travel distance based on two considerations: the frequent itemset grouping and the weight distribution of the items. Unlike Battini et al. (2015), Chabot et al. (2017) and Diaz (2010, 2016), Glock and Grosse (2012) integrated weight constraints regarding the maximum capacity of a batch. The authors analysed a special case of an OP system in a U-shaped warehouse and described the OP system in a formal model to examine the impact of different storage assignment policies. Grosse et al. (2014) proposed a simulated annealing approach for solving order batching and OP routing with weight constraints (concerning the maximum capacity of a batch). Xiao and Zheng (2012) designed a correlated storage assignment system by storing products with demand dependences, in terms of the product's bill of materials, together to minimize zone visits when picking materials/parts in production lines. Like Glock and Grosse (2012) and Grosse et al. (2014), the authors also took into consideration the batch weight as a constraint.
Table 1 summarizes the literature review, the clear focus on SLAP with weight constraints and the strategies used. Also, Table 1 contrasts what has already been done with what is proposed in this study.
3 Methodology
Based on the literature review, we believe it is necessary to create a different approach that considers a higher non-uniformity of fast moving products. For ease of understanding, here is an example:
Think of a warehouse that serves several grocery stores where the most popular products are microwaves, fans, drinking straws and toothbrushes. In this scenario, it is relevant to consider weight precedence constraints, to prevent damage to the products. That is, while building the pallets, pickers must place first the microwaves and the fans, at the bottom of the pallet, and then, place the drinking straws and toothbrushes, above.
In this scenario, if we consider a Density Zone strategy, as Diaz (2016), the fast moving products will be placed at two different extremes. Microwaves and fans in the heavy products zone. Drinking straws and toothbrushes in the light products zone. This forces the picker to go through two zones, positioned at opposite extremes of the warehouse, in nearly all orders (considering that these products are fast movers). Moreover, the capacity constraint strategy (other strategy considered in the literature) is not enough to guarantee that the heaviest products are the first to be collected, as this merely defines that the sum of the weight of the products must not exceed a predefined weight (which, under the circumstances, is insufficient).
In this sense, we propose an alternative strategy, for use with SLAP with weight precedence constraints, in which instead of creating density zones for products, we create frequency zones (based on the demand and similarity of the products) and within these zones we locate the products considering the weight. In this way, we ensure that the picker in most orders will only travel through the fast movers' zone, which is going to be located close to the start–end point (reducing the distance travelled by the picker) and we ensure that heavy products are picked first.
The methodology used for solving the problem under study is based on a deductive approach. During the design of the proposed method, we took into consideration several aspects, namely the capacity and conditions of the warehouse (locations and seismic conditions), the characteristics of the products (association, correlation and compatibility), the configuration of the operation (routing, security and energy), the market conditions (demand and sales) and the logistic resources (equipment and workers).
In this study, we assume an S-shape routing strategy due to the consideration of a narrow-aisle warehouse (which constrains the application of different routing strategies). This constraint is common across many retail warehouses. A lot of warehouses do have narrow aisles to get the maximum storage capacity per square foot (Burinskienė et al. 2018). We consider products weight restrictions as they constrain the construction of routing schemes using an S-shaped routing structure (for additional references, see Roodbergen and Koster (2001)).
In this section, we will first present the problem, then the heuristic building concepts and finally, we will describe the heuristic procedure.
3.1 Problem description
The problem at hand can be defined as stated below.
Given:
rsj—The distance from the start–end point to each one of the slots j;
djl—The distance from one slot j to another slot l;
K—The number of products to be allocated;
P—The number of existing slots;
Si—The storage needs for a product i;
ysik—The similarity between two products i and k (in terms of demand pattern);
fi—The demand of a product I; and.
ywik—The similarity between two products i and k (in terms of weight).
We want to determine the assignment of the products:
xij—(a binary variable) with 1 if the product i is assigned to slot j, and 0 otherwise.
The aim is to minimize the objective function:
Subject to:
where
The objective function (Eq. 1) has two parts: the first part of the equation, given by the product fi and sikwikdjlxijxkl, aims to reduce the distance covered by the picker within the slots and to locate products with similar weight and demand patterns near each other, simultaneously. The second part of the equation, given by the product of fi and rsjxij, defines the expected distance required to go from the start–end point to slot j. It is assumed that a picker can travel from slot j to some other slot l during the picking trip.
Equation (2) guarantees that only one product i is assigned to slot j. It is assumed that we cannot have more than one product per slot. Equation (3) assures that the number of slots assigned to product i equals Si. Equation (4) restricts the limits of the binary variable values to zero or one. Equation (5) ensures that the number of slots needed by the product does not exceed the number of available slots. Finally, Eq. (6) ensures that the number of products does not exceed the number of available slots.
The optimal solution of the model cannot be obtained for such large solution spaces; this is for a large amount of data, a scenario that is very common for the retail sector (i.e. the study company has, on average, 11,033 per day and up to 400 products per order). For this reason, the problem is solved by using a heuristic procedure developed for this purpose. The procedure is presented in the next section.
3.2 Heuristic building
The proposed methodology dictates the allocation of the products to the warehouse locations while minimizing the total distance travelled by the picker when an order is placed. This distance is given by the sum of the picking and shipping distances. The picking distance is given by the distance travelled by the pickers within the aisles, while collecting the products. The shipping distance is given by the sum of the distance travelled from the start–end point to the first aisle and the distance travelled from the last aisle to the start–end point. The distance takes into account the multiple trips needed for the orders.
The placement of products is based on three criteria: similarity, demand and weight. The similarity is defined by the number of times that products appear together in the orders that arrive at the warehouse. The higher the number, the higher the similarity between the two products. Demand is defined by the number of times the products appear on the orders. Weight is defined by the real weight of the product (in kg). In the end, the highest requested products must be placed in the aisles that are next to the start–end point, the products with higher similarity must be placed next to each other and the products with the highest weight should be placed at the start of the route.
3.3 Heuristic procedure
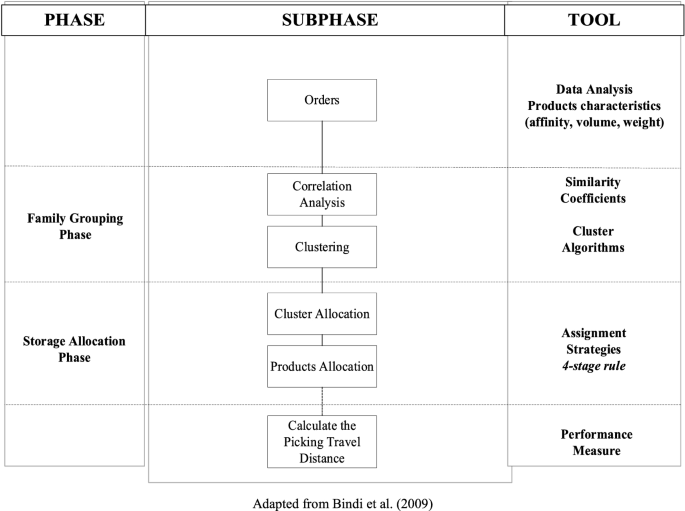
In a traditional warehouse that stores non-uniform products, the weight of each product is assessed and assigned to a density zone. This study proposes an alternative heuristic procedure to density zones, feasible for multi-aisle, multi-product picking warehouses that operate in a stock environment. This procedure was inspired by the work of Bindi et al. (2009) and developed to incorporate weight positioning rules. It has two main phases: the grouping phase and the storage assignment phase (see Fig. 1), which are now described. To illustrate how this method works, a numerical study has been conducted and is presented in the next section.
Adapted from Bindi et al. (2009)
Systematic procedure for correlated storage assignment.
3.3.1 Family grouping process
The family grouping process phase consists of the formation of the clusters taking into consideration both the products’ demand and the products’ similarity. The process can be summarised as follows (for more details see Bindi et al. 2009).
Process 1.1 Correlation Analysis
-
1.
Design an incidence matrix, based on the products ordered per order. The incidence matrix only presents 0–1 values (1—If a product appears on an order; 0—otherwise).
-
2.
Build a similarity matrix, using the Jaccard coefficient (developed by McAuley 1972), as recommended by Bag et al. (2019).
Process 1.2 Clustering
-
3.
Cluster the products, to ensure that the items within the same group are highly correlated with each other and poorly correlated with those in other clusters. For this purpose, use the package NbClust (available on RStudio) to define the number of clusters, and the clustering algorithm that best fits the data.
3.3.2 Storage assignment phase
The first phase of the storage allocation process is the development of a priority list where the previously obtained clusters of products are arranged in agreement with the assignment rule adopted. The assignment rule establishes the insertion order of the clusters and consequently of its products (for more details see Bindi et al. 2009). In this phase, we propose a new four-stage storage assignment rule. This rule sorts the clusters according to the average demand and ABC classification of its products and then it sorts the products in each cluster according to three different criteria (randomness, frequency and weight). The four steps of the process are now detailed.
-
1.
Perform an ABC analysis of the products, taking into consideration the quantity ordered.
-
2.
Categorize the clusters from the average demand and ABC classification of its products.
-
3.
Allocate the clusters into the available areas, giving priority to the ones that have a higher average demand. That is first place the cluster with higher average demand and the highest percentage of fast moving products in the area closest to the start–end point. After this, place the second cluster with the higher average demand in the second area closest to the start–end point, and so on.
-
4.
Allocate the products, within the clusters, based on different rules. Two different rules and corresponding scenarios are designed for this study. Products are allocated: randomly (random scenario) or based on their weight and demand (weight-constraint scenario).
In the weight-constraint scenario, products are assigned and sorted based on their weight and demand. The products are sorted in descending order of weight. That is, the heaviest products are placed in the first aisle of each cluster zone. When products weigh the same, the product’s demand comes into effect (see Algorithm 1). The application of the algorithm covers all the aisles of one cluster and follows the S-shape route performed by the picker.
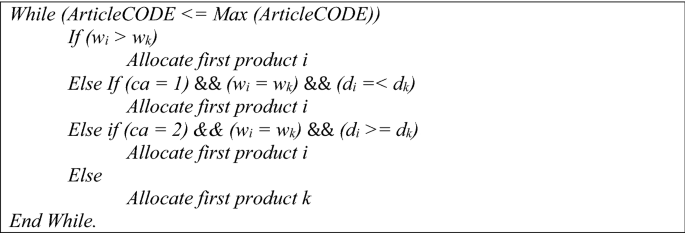
Where: ArticleCODE—SKU of the product; wi—Weight of product i; wk—Weight of product k; di—Demand of product i; dk—Demand of product k; ca—Cluster a, where a = 1 means cluster positioned at the right side of the start-end point and a = 2 means cluster positioned on the left side of the start-end point.
Note that, in the weight-constraint scenario, there is the need for performing cluster zoning to ensure that the heaviest products are placed at the bottom of the pallet.
4 Warehouse description and problem assumptions
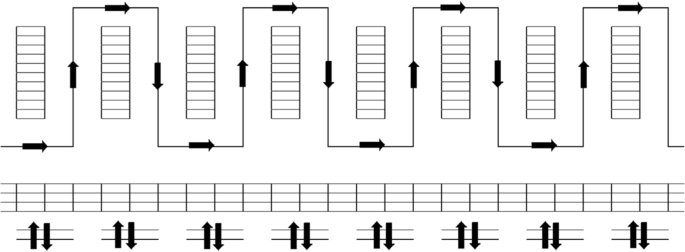
The company under study is known internationally and represents one of the biggest food distributors in Portugal. The warehouse in Northern Portugal serves over 191 stores and is currently organized as four sub-warehouses: non-perishables, fish, codfish, and fruit and vegetables. In this paper, we address the layout of the non-food section of the non-perishables warehouse. Figure 2 exhibits the warehouse under study. On the lower side of the figure, the docks used to received and ship the products are represented.
Adapted from the company report
Warehouse layout scheme.
The warehouse has a typical layout of a manual picker-to-part system that consists of several aisles, with storage locations on both sides of each aisle. It is assumed that one item type occupies exactly one storage location and that a storage location contains only one item type—Single deep racks. The product mix is composed of 1047 different items (with up to 11,033 orders per day and up to 400 products per order). The company has a conventional, manual picking operation using low-level picking. Products ready for collection are on low-level racks. The higher racks, above, are used for storage (see Masae et al. 2020).
Also, this paper considers a typical layout of a manual picker-to-part warehouse with a narrow pick aisle as sketched (as Chen et al. 2018). For that reason, we assumed an S-shape routing strategy, in one direction only (other routing strategies may not be applied in this context). Orders are completed one at a time and products are collected according to the sequence given by the voice-speaking system. During the process, the picker retrieves products on both sides of the aisles (taking a zigzag course).
Given the fact that the warehouse is two-dimensional and that different types of items are placed at different locations, the travel distance will be given by the distance from switching from one item to the other. We also assume that the cost of replenishment is not taken into account, since the cost is minimal compared to the cost of order-picking due to bulk replenishment.
5 Results
This section covers the application of the heuristic procedure to the company studied. In this section, the proposed planning approach is evaluated through a number of numerical tests. We developed the main test set consisting of orders based on the real setting of the retail company at hand. We compared the results with the density zone procedure (Sect. 5.1) and we derive three additional test sets from the main set for testing the robustness of the procedure (Sect. 5.2).
A multi-scenario was carried out to identify the best configuration of the system and to minimize the total travel distance assuming a lengthwise configuration of the system layout. In the application of the two-phase procedure, we used information about 4667 orders performed in a regular month. The results obtained are represented in terms of the distance travelled by the picker, a performance measure used in similar studies, namely: Battini et al. (2016), Wutthisirisart et al. (2015) and Xiao and Zheng (2010). In the computation of the distance, we used Visual Studio 2017. In order to validate the process, a pilot test for the programme design was conducted for ten different instances, each one with 12 random orders, with multiple products. The data used in this section can be found at Havard Dataverse (see Trindade et al. 2021).
Table 2 provides information about the three clusters that resulted from the application of the first part of the heuristic procedure, where the formation of the clusters takes into consideration both products’ demand and products’ similarity. We use the package NbClust (available on RStudio) to define the most suitable number of clusters, in this case, three and, the most suitable cluster algorithm, in this case, the nearest neighbour. The NbClust package provides thirty indices for determining the number of clusters and offers the best clustering scheme from the different results obtained by varying all combinations of the number of clusters, distance measures and clustering methods.
After performing the clusters at R-studio, we classified them (Table 2) and we established the priority sequence for the allocation of the clusters according to the average demand: Cluster 2—Cluster 1—Cluster 3. Then, we allocated the clusters into the available areas, using that order, placing the one with the higher average demand next to the start–end point. Finally, we assigned the products, following the zigzag positioning rule (that the pickers use), within the clusters, according to the positioning rules established for each of the scenarios (random and weight-constraint)—see Sect. 3.3.
Figure 3 presents the distance, in km/month, for each of the scenarios. The current scenario—a scenario that evaluates the layout currently implemented in the warehouse—results in a total distance travelled equal to 4239 km/month (picking operation accounts for 59% of the total distance). The weight-constraint scenario, the scenario designed for the case study, has a total distance travelled equal to 3762 km/month (picking operation accounts for 54% of the total distance).
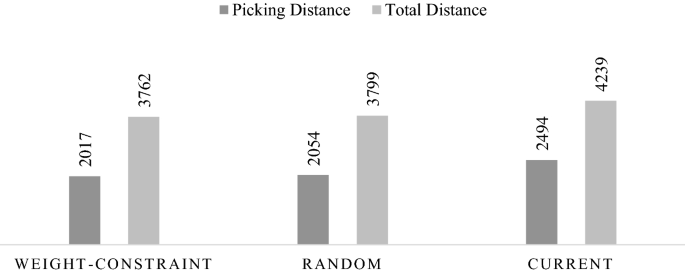
Comparison of distance travelled indicators: current vs weight-constraint and random scenarios (km/month)
Note that the Total Distance = Picking Distance + Shipping Distance. Where: Picking Distance = Distance travelled by the picker within the corridors and Shipping distance = Sum of the distance travelled from the start–end point to the first corridor and the distance travelled from the last corridor to the start–end point.
Table 3 is an extract of the results obtained in the different scenarios, detailed by distance components, this distance encompasses the multiple trips necessary to pick the products for the orders. The new scenarios are compared with the current scenario of the company. The weight-constraint scenario led to a reduction in the total distance travelled of up to 11%.
The generic travelled distance (km/month) can be converted to a cost (€/month), quantifying the necessary number of pickers in the system. Table 4 presents this analysis, showing the potential savings by each of the scenarios. The allocation of the products in the weight-constraint scenario enables a reduction of the distance travelled monthly of 477 km. As the warehouse operates 26 days a month and the picking machines used in the warehouse move at an average speed of 2 km, operations can be reduced up to nine hours a day. This reduction leads to the conclusion that it is possible to maintain the same warehouse activity level with one employee less (if each employee works on average 7.5 h per day). Alternatively, the company could maintain the same number of employees but operate more efficiently.
Note that the implementation of the layout obtained in each of the new scenarios might create future costs, arising from the changes in the location of the products. These changes involve modifications in the warehouse management system used by the company and employees adapting to a different work environment. They are reliable for the circumstances investigated and demonstrate the effectiveness of the presented techniques.
5.1 Density zones strategy
In this subsection, the approach of using density zones (following the process created by Diaz. 2016) is compared with the developed heuristic procedure. Four density zones were defined: light, medium-light, medium-heavy and heavy products and, within each density zone, products were allocated based on their demand characteristics (for more details see Diaz 2016). The result was that the most frequent products, in each density zone, were placed in the aisle nearest to the start–end point. This procedure allowed for a total saving of 3% (a reduction of approximately 128 km when compared to the current situation of the company), far from the 11% achieved using the weight-constraint scenario. This is easily explained by the high variability of the weight of the products in the fast mover clusters (std. deviation: 4.80 kg; maximum weight: 18.18 kg; minimum weight: 0.03 kg).
5.2 Sensitivity analysis
A sensitivity analysis was conducted to identify the most critical factors affecting system performance. The results obtained were based on the real setting of the retail company at hand. The principal questions addressed in the numerical studies aim to test the robustness of the procedures adopted to set the location of the clusters; the number of clusters; the segregation between fast and slow moving products and to overcome the limitation of the dataset used (data from one company only). Therefore, the experimental design aims to answer the following questions:
-
1.
What is the effect of changing the rule, defined in the developed procedure, to set the sequence of the clusters? (Sect. 5.2.1.)
-
2.
How do the changes of the number of clusters, defined in the developed procedure by the NbClust package (R-Studio), impact the overall solution quality? (Sect. 5.2.2.)
-
3.
What happens if we apply a different allocation procedure to slow and fast moving products? (Sect. 5.2.2.)
-
4.
Is the developed procedure appropriate only to this specific case? What happens if we generate random order samples? (Sect. 5.2.3.)
The values of the distance are always compared to the current scenario of the company.
5.2.1 Clusters location
Table 5 shows that the total distance travelled by the picker was calculated for the six possible combinations. The sequence adopted during the design of the heuristic procedure (Cluster 3—Cluster 1—Cluster 2) continues to lead to the highest percentage of improvement (in comparison with the current scenario).
5.2.2 Number of clusters
In this subsection, the sensitivity analysis is the result of the combination of the following sets of values:
-
Ten different numbers of clusters: Without clusters, 2, 3,4,5,6,7,8,9 and 10.
-
Two different scenarios: normal clusters and slow mover clusters.
In the normal clusters, we cluster all the products. In the slow mover clusters, we only clustered the products classified as C, in the ABC analysis, with a weight of under 10 kg. In this last scenario, we first placed, next to the start–end point, the most frequent and heaviest products and then, we placed the slow mover clusters by following the developed heuristic procedure (see Sect. 3.3).
Table 6 provides the results. In the normal clusters, the best solution was given by the formation of two clusters, with a reduction of the distance travelled by the picker of 15%. In the slow mover clusters, the best solution was given by the formation of three slow moving clusters, with an improvement of approximately 10%.
It should be noted that the solution given for clustering all the products (that is, without the separation of the slow and fast movers) achieves better results, independent of the number of clusters created (Fig. 4).
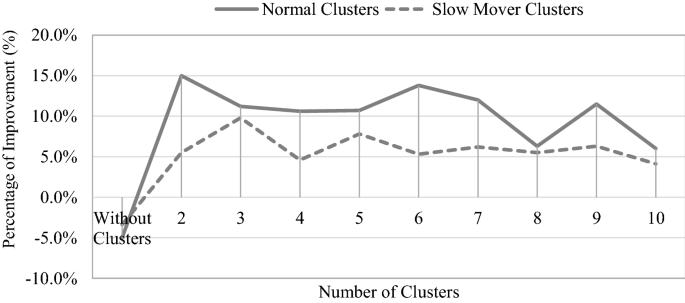
Comparison of the percentage of improvement between the normal clusters and the slow mover cluster scenarios
5.2.3 Random demand
In this subsection, to test the robustness of the procedure, we ran the heuristic for ten different samples in which the frequency with which each product appears on the orders was randomly generated from a Gaussian Random Number Generator, that generates random numbers from a Gaussian distribution. The randomness, in this program, comes from atmospheric noise. Table 7 provides the results.
Results indicate that the overall savings may be even higher and could go up to 33%.
6 Theoretical and managerial implications
This section highlights implications of the study for theory as well as for practice.
First, theoretically, we proposed a new heuristic procedure to deal with SLAP when there are weight precedent constraints. The developed heuristic procedure is of potential interest for narrow-aisle warehouses, that apply S-shape routing policies and that store a high number of non-uniform fast moving products. This situation is very common in the retail industry as the S-shape routing policy is usually applied in practice because of its simplicity (Masae et al. 2020) and narrow aisles appear to provide an alternative to increase space use with minimal investment costs (Gue et al. 2006).
The heuristic method was thought to prevent fast moving products to be placed further from the I/O point just because of their weight (as occurs in the density zones strategy) and it allows the exact calculation of the travelling distance to be made, instead of the expected distance (as most of the studies on the literature).
The proposed heuristic has the potential to be further extended to incorporate a different routing or batching method and to be applied in warehouses with non-traditional layouts (such as inverted-v, fishbone, flying-v and chevron) since the location of the product zones of the fast moving products is always defined based on the relative distance (from and to the I/O point).
Second, on the empirical side, the results show that the proposed heuristic is effective in improving the overall warehousing operating efficiency (savings on the distance travelled by the picker can go up to 33%). Therefore, the developed procedure can potentially help operational managers in the development of an efficient storage assignment policy, allowing them to save time and operate in a faster way.
Also, the heuristic procedure allows for the location of items within the aisle to be changed without damaging the results. The method is easy to apply in practice and works with a high amount of data (most of the models presented in the literature do not).
7 Conclusions
In warehouses with a great diversity of weight within the existing products; during the construction of pallets, pickers must take special care to ensure that the products are not damaged. It is therefore important to ensure that the heaviest products are the first to be collected. In the literature, the solution that is given for the allocation of items in warehouses whose routing policy is restricted is the creation of density zones. However, in a context of high weight-variability within fast-moving products, this strategy may be inefficient. This is because it forces pickers to travel through several weight zones to satisfy one regular order.
This paper presents a solution to deal with this inefficiency, inspired by a practical case of a manual OP retail warehouse with a high percentage of non-uniform products. A warehouse where the item weight influences the sequence of the OP operations. The designed solution prevents fast-moving products from being moved away from the start–end point (just because of their weight) by applying, as storage assignment policy, a two-phase procedure of first clustering and then weight ordering. The purposed storage-assignment strategy was thought to be easily understood and implemented in practice (in real-world warehouses). Thus, it can benefit the industry as it uses data to which the companies have easy access. This may ultimately contribute to the economy of the countries in which the technique is implemented.
In the numerical study, we compare our strategy to the strategy used by a retail company and to the density zones approach. The analysis showed that, with the proposed strategy, warehouse managers can reduce the pickers’ travel distance for completing customer orders. When considering weight constraints, the procedure meant a total savings of approximately 636 km a month, for the company studied (in comparison with the strategy used). Also, the total savings was higher than that achieved by using density zones (the procedure generally accepted to deal with this problem, in the literature). The efficiency of the process was afterwards reinforced by the successful application of the same procedure in randomly generated samples; indicating that the overall savings may be even higher and could go up to 33%.
The main limitations of the study are the constraints given by the fixed layout of the company warehouse and the consideration of one regular month as a reference. In addition, other operations that could potentially improve picking operations are not considered, for example, the routing method, batching operations and pallet construction processes. It was not feasible to consider these in the case under study.
Future studies can, therefore, investigate the effect of applying the heuristic method in a different kind of warehouse; for example, in a warehouse that has a different picking method and/or layout, such as a warehouse with a fishbone configuration. There is also the potential to incorporate in the heuristic a routing problem, by trying to combine this procedure with a different routing method, for example, the largest gap routing strategy and/or combined routing strategy. Furthermore, there is potential to include a model of classification of products to examine the impact on productivity. Other suggestions include applying the model to other types of companies to investigate the results obtained; developing an alternative similarity index to be incorporated in the procedure and attempting to incorporate other kinds of precedence constraints (such as shape, fragility or others).
References
Burinskienė A, Davidavičienė V, Raudeliūnienė J, Meidutė-Kavaliauskienė I (2018) Simulation and order picking in a very-narrow-aisle warehouse. Econ Res Ekonomska Istraživanja 31(1):1574–1589
Bag S, Kumar SK, Tiwari MK (2019) An efficient recommendation generation using relevant jaccard similarity. Inf Sci 483(1):53–64
Battini D, Calzavara M, Persona A, Sgarbossa F (2015) Order picking system design: the storage assignment and travel distance estimation (SA&TDE) joint method. Int J Prod Res 53(4):1077–1093
Battini D, Glock CH, Grosse EH, Persona A, Sgarbossa F (2016) Human energy expenditure in order picking storage assignment: a bi-objective method. Comput Ind Eng 94(2016):147–157
Battista C, Fumi A, Giordano F, Schiraldi M (2011) Storage location assignment problem: implementation in a warehouse design optimization tool. In: Proceedings of the conference breaking down the barriers between research and industry. Padua, Italy, pp 14–16
Bindi F, Manzini R, Pareschi A, Regattieri A (2009) Similarity-based storage allocation rules in an order-picking system: an application to the food service industry. Int J Log Res Appl 12(4):233–247
Bozer YA, Aldarondo FJ (2018) A simulation-based comparison of two goods-to-person order picking systems in an online retail setting. Int J Prod Res 56(11):1–21
Brynzér H, Johansson MI (1996) Storage location assignment: using the product structure to reduce order picking times. Int J Prod Econ 46–47(1996):595–603
Carvalho, J. M. C. (2002). Logística, Edições Silabo, 3rd edn, pp 226–227
Chabot T, Lahyani R, Coelho LC, Renaud J (2017) Order picking problems under weight, fragility and category constraints. Int J Prod Res 55(21):6361–6379
Chen F, Wei Y, Wang H (2018) Heuristic based batching and assigning method for online customer orders. Flex Serv Manuf J 30(2018):640–685
Chuang Y-F, Lee H-T, Lai Y-C (2012) Item-associated cluster assignment model on storage allocation problems. Comput Ind Eng 63(4):1171–1177
De Santis R, Montanari R, Vignali G, Botanni E (2018) An adapted and colony optimization algorithm for the minimization of the travel distance of pickers in manual warehouses. Eur J Oper Res 267(1):120–137
Diaz R (2010) Using optimization coupled with simulation to construct layout solutions. In: Proceedings of the 2010 spring simulation multiconference on—springsim ’10. Florida, Orlando, pp 1–8
Diaz R (2016) Using dynamic demand information and zoning for the storage of non-uniform density stock-keeping-units. Int J Prod Res 54(8):2487–2498
Eurocommerce (2019) Retail and wholesale in Europe. https://www.Eurocommerce.Eu/Retail-And-Wholesale-In-Europe.Aspx Accessed 02 Mar 2020
Eurostat (2020) Retail trade volume index overview. https://Ec.Europa.Eu/Eurostat/Documents/2995521/10294516/4-04032020-Ap-En.Pdf/7416ba31-D67e-87db-9d72-E71e32fbc3be. Accessed 06 Mar 2020
Farahani P, Grunow M, Günther HO (2012) Integrated production and distribution planning for perishable food products. Flex Serv Manuf J 24(2012):28–51
Frazele EA, Sharp GP (1989) Correlated assignment strategy can improve any order-picking operation. Ind Eng 21(4):33–37
Gajšek B, Đukić G, Opetuk T, Cajner H (2017) Human in manual order picking systems. In: Conference proceedings-management of technology–step to sustainable production
Glock CH, Grosse EH (2012) Storage policies and order picking strategies in u-shaped order-picking systems with a movable base. Int J Prod Res 50(16):4344–4357
Glock CH, Grosse EH, Abedinnia H, Emde S (2019) An integrated model to improve ergonomic and economic performance in order-picking by rotating pallets. Eur J Oper Res 273(2):516–534
Grosse EH, Glock CH, Jaber MY, Neumann WP (2015) Incorporating human factors in order picking planning models: framework and research opportunities. Int J Prod Res 53(3):695–717
Grosse EH, Glock CH, Ballester-Ripoll R (2014) A simulated annealing approach for the joint order batching and order picker routing problem with weight restrictions. Int J Oper Quant Manage 20(2):65–83
Grosse EH, Glock CH, Neumann WP (2017) Human factors in order picking: a content analysis of the literature. Int J Prod Res 55(5):1260–1276
Gue KR, Meller RD, Skufca JD (2006) The effects of pick density on order picking areas with narrow aisles. IIE Trans 38(10):859–868
Ivanov D (2020) Predicting the impacts of epidemic outbreaks on global supply chains: a simulation-based analysis on the coronavirus outbreak (COVID-19/SARS-Cov-2) Case. Transp Res Part E Logist Transp Rev 136(101922):1–14
Kim J, Méndez F, Jimenez J (2020) Storage location assignment heuristics based on slot selection and frequent itemset grouping for large distribution centers. IEEE Access 8:189025–189035
Kofler M, Beham A, Wagner S, Affenzeller M (2015) Robust storage assignment in warehouses with correlated demand. In: Computational intelligence and efficiency in engineering systems, vol 595. Springer International Publishing, pp 415–428
Kulak O, Sahin Y, Taner ME (2012) Joint order batching and picker routing in single and multiple-cross-aisle warehouses using cluster-based tabu search algorithms. Flex Serv Manuf J 24(2012):52–80
Lee IG, Chung SH, Yoon SW (2020) Two-stage storage assignment to minimize travel time and congestion for warehouse order picking operations. Comput Ind Eng 139(2020):2–13
Li Y, Méndez-Mediavilla FA, Temponi C, Kim J, Jimenez JA (2021) A heuristic storage location assignment based on frequent itemset classes to improve order picking operations. Appl Sci 11(4):1839
Liu C-M (2004) Optimal storage layout and order picking for warehousing. Int J Oper Res 1(1):37–46
Manzini R, Bindi F, Ferrari E, Pareschi A (2012) Correlated storage assignment and iso-time mapping adopting tri-later stackers. A case study from tile industry. In: Warehousing in the global supply chain. Springer, London, pp 373–396
Masae M, Glock CH, Grosse EH (2020) Order picker routing in warehouses: a systematic literature review. Int J Prod Econ 224:107564
Matusiak M, De Koster R, Kroon L, Saarinen J (2014) A fast-simulated annealing method for batching precedence-constrained customer orders in a warehouse. Eur J Oper Res 236(3):968–977
McAuley J (1972) Machine grouping for efficient production. Prod Eng Res Devel 51(2):53–57
Moons S, Ramaekers K, Caris A, Arda Y (2018) Integration of order picking and vehicle routing in a B2C e-commerce context. Flex Serv Manuf J 30(2018):813–843
Petering ME, Wu Y, Li W, Goh M, de Souza R, Murty KG (2017) Real-time container storage location assignment at a seaport container transshipment terminal: dispersion levels, yard templates, and sensitivity analyses. Flex Serv Manuf J 29(3–4):369–402
Pierre B, Vannieuwenhuyse B, Dominanta D, Van Dessel H (2003) Dynamic ABC storage policy in erratic demand environments. Journal Teknik Industri 5(1):1–12
Reyes JJR, Solano-Charris EL, Montoya-Torres JR (2019) The storage location assignment problem: a literature review. Int J Ind Eng Comput 10(2019):199–224
Richards G (2014) Warehouse management: a complete guide to improving efficiency and minimizing costs in the modern warehouse. Kogan Page, London
Roodbergen KJ, Koster R (2001) Routing methods for warehouses with multiple cross aisles. Int J Prod Res 39(9):1865–1883
Rosenwein MB (1994) An application of cluster analysis to the problem of locating items within a warehouse. IIE Trans 26(1):101–103
Shah B, Khanzode V (2018) Designing a lean storage allocation policy for non-uniform unit loads in a forward-reserve model. J Enterp Inform Manage
Tompkins JA, White YA, Bozer EH, Tanchoco JMA (2010) Facilities planning, 4th edn. John Wiley & Sons, Hoboken, NJ
Trindade M et al (2021) Replication data for: ramping up a heuristic procedure for storage location assignment problem with precedence constraints, Harvard Dataverse
Van Gils T, Ramaekers K, Caris A, De Koster RB (2018) Designing efficient order picking systems by combining planning problems: state-of-the-art classification and review. Eur J Oper Res 267(1):1–15
Wutthisirisart P, Noble JS, Chang CA (2015) A two-phased heuristic for relation-based item location. Comput Ind Eng 82(2015):94–102
Xiao J, Zheng L (2010) A correlated storage location assignment problem in a single-block multi-aisle warehouse: considering bill-of-material information. Int J Prod Res 48(5):1321–1338
Xiao J, Zheng L (2012) Correlated storage assignment to minimize zone visits for bom picking. Int J Adv Manuf Technol 61(5–8):797–807
Xie J, Mei Y, Ernst AT, Li X, Song A (2018) A bi-level optimization model for grouping constrained storage location assignment problems. IEEE Trans Cybern 48(1):385–398
Yu Y, Koster R, Guo X (2015) Class-based storage with a finite number of items: using more classes is not always better. Prod Oper Manag 24(8):1235–1247
Zhang Y (2016) Correlated storage assignment strategy to reduce travel distance in order picking. IFAC-Papers Online 49(2):30–35
Žulj I, Glock CH, Grosse EH, Schneider M (2018) Picker routing and storage assignment strategies for precedence-constrained order picking. Comput Ind Eng 123(2018):338–347
Acknowledgements
We gratefully acknowledge the assistance of the blinded reviewers, who reviewed the manuscript. They helped to improve the quality of the paper.
Author information
Authors and Affiliations
Corresponding author
Additional information
Publisher's Note
Springer Nature remains neutral with regard to jurisdictional claims in published maps and institutional affiliations.
Rights and permissions
About this article

Cite this article
Trindade, M.A.M., Sousa, P.S.A. & Moreira, M.R.A. Ramping up a heuristic procedure for storage location assignment problem with precedence constraints. Flex Serv Manuf J 34, 646–669 (2022). https://doi.org/10.1007/s10696-021-09423-w
Accepted:
Published:
Issue Date:
DOI: https://doi.org/10.1007/s10696-021-09423-w