
Abstract
The underpricing of initial public offerings (IPO) is a well-documented fact of empirical equity market research. Theories explain this underpricing with market imperfections. We study three empirically relevant IPO mechanisms under almost perfect market conditions in the laboratory: a stylized book building approach, a closed book auction, and an open book auction. We report underpricing in each of these IPO mechanisms. Uncertainty about the aftermarket behavior may partly explain IPO excess returns but underpricing persists even in the repeated setting where uncertainty is negligible and despite the equilibrium adjustment dynamics, that we observe in the data. The data reveal a market-wide impact of investors’ reluctance to sell in the aftermarket at a price below the offering price. We conclude that a behavioural bias similar to the disposition effect fosters IPO underpricing in our setting.
1 Introduction
The underpricing of initial public offerings (IPO) is a well-documented fact of empirical equity market research. Ritter (2003) reports results from stock exchanges in 38 countries, all of which show evidence of first-day abnormal returns. The size of IPO underpricing is cyclical; for example, at the height of the dot-com bubble the average IPO was underpriced by more than 50%, whereas the long-term average of IPO underpricing is 10–20% in the U.S. (see Ljungqvist 2007, Fig. 1). The underpricing phenomenon is persistent, even across different IPO mechanisms.
We report a laboratory study on underpricing of IPO. Our data indicate that investors’ reluctance to sell their shares at a loss is a driver of IPO underpricing. Shefrin and Statman (1985) coined the term disposition effect to describe the stylized fact that investors hold on to their losing investments for too long and sell their winning investments too early. The disposition effect affects underpricing because IPO investors generally offer their shares for sale in the aftermarket only above but not below the IPO price, while shading their demand in the initial public offering.
The mainstream theories explaining underpricing refer to market imperfections including information asymmetries regarding the ex-ante uncertainty of the issuer’s intrinsic value (e.g. Rock 1986; Beatty and Ritter 1986; Welch 1992; see the literature review in Sect. 2). The present paper challenges the market imperfection account by reporting IPO underpricing in a controlled laboratory experiment in which the concerned market imperfections are nonexistent. In contrast to IPOs in real-world equity markets (see Sect. 2), there is no information asymmetry in the experiment. On the demand side, each investor has common information on the fundamentals of the issued security, including its expected risk and return. On the supply side, there is no discretion regarding the allocation of shares, as an impartial pro-rata scheme is applied. Under identical ex-ante conditions regarding the number of shares, asset values and market liquidity, we compare three relevant IPO mechanisms: two uniform price auctions and a stylized book building procedure. Hence, our setting puts us in a situation where almost all the advanced explanations of empirical IPO underpricing are not applicable. The only uncertainty that remains for investors in our setting is about the aftermarket behavior. This uncertainty is resolved in a repeated setting. In the first IPO, subjects receive perfect information about the aftermarket conditions, but are inexperienced in trading. In the second IPO, subjects are experienced so that their uncertainty about the aftermarket behavior is almost absent.
Our experiment fills a gap in the empirical literature as we observe IPO underpricing in (almost) perfect market conditions. Such an IPO experience cannot be obtained outside of the lab, because information asymmetry, uncertainty and other market imperfections can never be resolved in the real-world financial markets. Observing IPO underpricing in our environment reveals that the market imperfections acknowledged in the mainstream theories of underpricing may well reinforce underpricing, but that the disposition effect might play an important role as well, i.e. the reluctance of IPO investors to sell their shares at a loss which reinforces underpricing of course. In the laboratory, under controlled conditions, we are able to test this behavioral explanation of underpricing.
The paper makes several contributions to the literature. First, we report IPO underpricing in each session of each IPO mechanism. This result is striking, as it is obtained in absence of real-world imperfections of demand-side induced information asymmetries or supply-side driven incentives. This evidence suggests that a behavioral bias like the disposition effect (Shefrin and Statman 1985) must play a role in the IPO. In fact, our comparison of bidding and asking prices in the aftermarket shows that IPO investors are reluctant to realize losses in the aftermarket, thus fostering IPO underpricing.Footnote 1 The extent of underpricing persists even with repetition. This persistence indicates that despite the largely reduced uncertainty, experienced investors request the same excess return for IPO participation as inexperienced investors do. Our data also reveal adaptive adjustments to foregone payoffs, as net purchasers in the aftermarket of the underpriced IPO increase their participation in the subsequent IPO. Our results on IPO underpricing and aftermarket dynamics represent an important contribution to the investigation of IPO underpricing that other studies could not offer before.
Second, in contrast to the secondary data literature, our design enables us to distinguish two measures of IPO excess returns: underpricing and expected excess returns. Underpricing is defined as the IPO return relative to the average market return without an IPO. This approach accounts for market dynamics. Expected excess return is defined as the IPO return relative to the fundamental value, i.e., the constant sum of (discounted) expected future dividends. Underpricing can differ from expected excess return because the latter ignores market dynamics. With secondary data, expected excess returns are generally uncertain and can only be approximated with observed prices. This way, the laboratory data offer valuable information that cannot directly be retrieved from real world data. For the design of our aftermarket we use the standard experimental asset market design of Smith et al. (1988), which has served as a laboratory work horse of many relevant issues (see Palan 2013 for a survey).Footnote 2 Importantly, mispricing persists in markets in the absence of fundamental uncertainty, as beliefs about future market returns need time to move to fundamentals (Haruvy et al. 2007; Carle et al. 2019).Footnote 3 Our baseline treatment, which involves continuous trading prior to the aftermarket, accounts for potential excess returns in the markets without an IPO. Thus, we measure IPO underpricing relative to our baseline treatment. In contrast to non-experimental studies, we are able to measure deviations from the fundamental value and, thus, measure expected excess returns. Remarkably, our data show that reduced uncertainty about the aftermarket affects expected excess returns but not IPO underpricing. Comparing experienced and inexperienced IPO participants, we find that excess returns with respect to fundamentals are significantly reduced, as experienced investors request a smaller absolute uncertainty premium. However, underpricing relative to the baseline treatment persists.
Third, we compare different IPO mechanisms: closed-book auction, open-book auction, and book building. We find suggestive although inconclusive evidence that in the auctions, underpricing is reduced when compared to our book building treatment which seems to be suggested in the literature (Benveniste and Busaba 1997; Derrien and Womack 2003); including experimental studies (Zhang 2009; Trauten and Langer 2012; Bonini and Voloshyna 2013). In contrast to the other experimental designs, our experiment involves an aftermarket in which issued shares pay dividends and trade over multiple periods. Our comparison of closed-book and open-book auctions shows that dynamic auctions with price indication may lead to higher revenues for the seller than sealed bid auctions when investors are inexperienced. Our approach extends the experimental tests on multiple-unit auctions, which usually involve non-tradable assets in a common-value framework (Kagel and Levin 2002), to tradable claims of cash flow. In the framework of Smith et al. (1988), we compare long-term effects of our IPO mechanisms on asset pricing.
The paper is structured as follows. Section 2 briefly surveys the literature on IPO underpricing. Section 3 presents the experimental design and our testable hypotheses. In Sect. 4, we report our experimental results and in Sect. 5 we conclude.
2 Literature review
Recent reviews have summarized the explanations of the financial economics literature on the IPO underpricing phenomenon (Ritter and Welch 2002; Ritter 2003; Ljungqvist 2007; Derrien 2010). Most explanations emphasize different types of institutional imperfections relating to asymmetric information, most importantly concerning the ex-ante uncertainty of the issuer’s intrinsic value (Beatty and Ritter 1986).
Demand-side explanations assume different degrees of information among investors. Some investors are assumed to be informed about the issuer’s value whereas others are uninformed. This asymmetric information leads to oversubscription of attractively priced IPOs as both informed and uninformed investors participate in the offering, whereas unattractively priced IPOs are only subscribed by uninformed investors (Rock 1986). Because uninformed investors’ demand is crowded out in attractive IPOs by informed (institutional) investors, while their orders are filled with unattractive offerings, uninformed investors’ average returns can be negative. This adverse selection problem is known as the winner’s curse problem (Thaler 1988; Amihud et al. 2003). The winner’s curse problem is intensified by the preferential allocation rules applied by investment banks that favor institutional investors (Cornelli and Goldreich 2001; Aggarwal et al. 2002). Cornelli and Goldreich argue that preferential rules are applied by the underwriter to reward informed investors for revealing information on the issuer’s value (Benveniste and Spindt 1989). However, some authors also uncover modes of corruption in relation to the preferential allocation rule (Hao 2007; Liu and Ritter 2010). Finally, Kaustia (2004) also conjectures the existence of a market-wide psychological bias in IPO underpricing; IPO investors are reluctant to realize losses in the aftermarket, therefore, the likelihood of price appreciation is high. Our data support this conjecture. In contrast to our comparison of bidding and asking data of IPO investors in the immediate aftermarket, Kaustia compares the market transaction volume for prices above and below the IPO price for the mid-term period, i.e., 21–508 days after initially going public, for the U.S. IPO market during the period 1980–1996.
Supply-side explanations claim that issuers or underwriters willingly underprice IPOs. Welch (1992) shows that underpricing mitigates the risk of IPO failure in view of the common uncertainty of an issue. Ruud (1993) argues that underpricing reduces the underwriter’s costs of price stabilization in the aftermarket.Footnote 4 Shiller’s (1988) impresario hypothesis suggests that investment banks underprice IPOs to satisfy their long-term clientele. There are behavioral explanations why the issuer does not get upset with underpricing by the underwriter, including the wealth effect for executives who participate in price increases through stock compensation plans (Loughan and Ritter 2002). In the signaling theory to IPO underpricing (Grinblatt and Hwang 1989), however, the issuing company has an interest in a good return for initial investors to attract more interest in subsequent seasoned offerings.Footnote 5 A related argument is that the issuer uses the abnormal first-day return as a marketing event to generate greater brand awareness (Demers and Lewellen 2003). Finally, issuers and underwriters underprice the IPO to decrease the risk of litigation by disappointed shareholders (Tinic 1988).
The reader will notice that all described institutional demand-side and supply-side issues referred to in the literature (other than behavioral ones) are absent from our controlled laboratory study. In our study we test underpricing under almost perfect market conditions.
In the literature, the extent of underpricing has been related to the IPO mechanism used; auctions have been associated with lower average first-day returns than the book building mechanism (Benveniste and Busaba 1997; Derrien and Womack 2003; Kutsuna and Smith 2004). Theory has shown that under particular assumptions the uniform price auction can be an optimal IPO mechanism (Biais et al. 2002). Experimental results show that auctions raise higher IPO revenues than fixed price offerings and thus provide some support for this theory, too (Bonini and Voloshyna 2013). The studies involve common value auctions in the presence (Zhang 2009; Bonini and Voloshyna 2013) or absence of (Trauten and Langer 2012) asymmetric information about the underlying value. In contrast to these studies, our design involves aftermarket trading, multi-period cash flows, and a control treatment that provides us with a market benchmark to measure IPO underpricing. Nevertheless, auctions have less than one percent of market share (Ritter 2003). The literature has partly accounted for this observation by the interaction between issuance-size and the contract-choice decision because smaller offers are more likely to use auctions.Footnote 6 Supply side explanations that predict larger underpricing intended by the issuer argue in favor of the book building approach. According to DeGeorge et al. (2007), for instance, the search for better analyst coverage may also partly explain the willingness of issuers to choose the book building mechanism over auctions.
3 Experimental design
In initial public offerings, information on the prospective cash flows and on the intended exchange listing of the securities in the aftermarket is distributed among potential investors. Investors are requested to submit a demand schedule that includes price and quantity, which determine the IPO price. In our experimental design, the structure of both the IPO mechanism and the aftermarket settings is common information for all participants before the experiment starts, including the number of market participants, financial endowments, and number of issued shares. Following the IPO, the issued shares are traded in a continuous double auction market similar to the stock exchanges around the world.Footnote 7 Note that across our experimental IPO institutions the expected values and tradability of assets in the aftermarket are constant; only the price mechanism varies systematically. Before we explain the mechanisms of our IPO institutions, we describe the aftermarket along with the fundamental value in detail.
3.1 Trading and cash flows of issued securities in the aftermarket
In this study, our aftermarket is implemented via the experimental asset market design of Smith et al. (1988) which includes cash flows of issued securities in form of random dividends after every trading period. Accordingly, nine subjects trade 18 asset-shares for 15 periods. A share is an entitlement to receive a regular cash dividend that is declared and instantly paid out to the shareholders at the end of each period. The dividend per share is determined by an independent random draw from the set of payoffs {0, 8, 28, 60}, where one money unit represents 0.01 Euro. The expected cash dividend per share is thus 24 money units per period. For given zero interest rates, the expected asset-value per share is 360 money units in the first period; it depreciates by 24 money units per period. After the dividend payment in the last period, shares are worthless.
Each of the 15 periods lasts 180 s.Footnote 8 During this time, subjects trade in an electronic continuous double auction market with an open order book.Footnote 9 The bids and asking prices are placed in the order book, which is open and common information to all subjects. An incoming order leads to an immediate transaction if it confirms the best bid or ask on the book, respectively. The transaction price is thus equal to the best outstanding order on the book. Upon transaction, the matched order is removed from the order book and the transaction price is chronologically recorded in the table of historical prices. The cash and shareholdings of buyers and sellers are updated upon the transaction. If an incoming order leads to no transaction, however, it is ranked and registered on the order book; better and older orders rank above worse and newer ones. Orders can be removed from the order book without charge by the traders before they lead to a transaction.
At the end of each period, market participants are given information on the cash dividend per share, their resulting personal dividend income, their updated holdings of cash and shares, and a summary of transaction prices (open, high, low, and close). This past information is recorded in the subject’s history table for each past period, which is available onscreen during the 15 trading periods. At the experiment’s conclusion, participants are paid in cash the amount of their final cash holdings. All trades in the experiment are equity financed, that is, short sales and margin purchases are not permitted.
3.2 Experimental treatments: IPO mechanisms
The treatment variable is the IPO mechanism. The experiment makes use of between-subjects variation as each subject participates in exactly one treatment, which involves two rounds (i.e., repetitions) of the same IPO mechanism. When we compare inexperienced with once-experienced behavior, however, we also make use of within-subject variation. In each round, which is indicated below by index \(\tau = \{ 1,\,2\}\), 18 asset shares are issued to market participants. Each subject is endowed with eIPO = 1,305 money units and submits a demand schedule to purchase asset-shares.Footnote 10 The IPO purchase price is determined from the aggregate demand schedule and shares are placed at a uniform price with the high bidders.
Up to 18 bids submitted by the subject for single asset-shares compose the individual demand schedule. The bids are positive integers and the schedules are constrained to non-negative cash balances for any clearing price. Thus, upon submission of each bid, the subject’s budget constraint is checked. Let \(b_{k} \ge 1\) denote the kth highest bid of the subject, the following individual budget constraint must be met for each k.
If upon bidding, that constraint (1) is violated, the subject is alerted and the demand schedule is not updated until the violation is removed. The IPO market closes after 240 s. The market demand is computed and the shares are allocated to the bidders of the 18 high bids at a uniform price. Ties are broken randomly. If too few bids are submitted, the IPO fails.Footnote 11
In line with empirical practice, the IPO price equals the highest losing bid. Let Bk denote the kth highest bid in the market, then:
Theoretical incentives exist to submit bids in line with and close to the individual preference-revealing amount (Vickrey 1961).Footnote 12 We consider three treatments, IPO = {CB, OB, BB}, that is, closed book auction, open book auction, and book building, respectively.
3.2.1 Closed book auction (CB)
The CB treatment involves a uniform price auction in line with the OpenIPO implemented by WR Hambrecht & Co (DeGeorge et al. 2010). Subjects submit sealed bids, each of which for the purchase of a single asset share. Their own bids are recorded onscreen in view of constraint (1). No information is given on the bids of other subjects or the likelihood of winning during the auction. After all subjects have submitted their demand schedules, the IPO purchase price is determined given the aggregate demand. Asset-shares are placed with the submitters of the winning bids, Bk: k ≤ 18 respecting Eq. (2).
3.2.2 Open book auction (OB)
The OB treatment involves similar rules to the CB regarding bidding, price determination and the allocation of shares to the winning bidders. During the auction, however, subjects receive updated real-time information on the purchase price, B19 and all rejected bids Bk < B19. OB is a dynamic auction in which bidders can react to the submitted bids of the others. If individual valuations are independent, such dynamics must not necessarily affect the bidding and the expected IPO purchase price (Vickrey 1961). Nevertheless, if bids are indications of prices in the asset market, such a revelation of the bids can help to decrease uncertainty about future prices and thus aid price discovery in the IPO. The difference between the IPO price and the aftermarket price might be reduced relative to the other treatments.
One potential adverse effect of the OB is an encouragement of early signaling and late bidding. A late-bidding effect has been documented for single-unit dynamic auctions with a fixed deadline (Roth and Ockenfels 2002; Füllbrunn and Sadrieh 2012). In a related open auction format but with a multi-unit discriminative auction for certificates of deposits such an effect has not been confirmed (Chiang and Kung 2005). For multi-unit uniform price auctions we are the first to investigate the late bidding effect (see the online appendix).
3.2.3 Book building (BB)
The book building-BB treatment represents a stylized book building approach involving a two-stage procedure. The first stage involves the closed-book IPO price determination rule equivalently to the CB treatment. Every subject submits a sealed demand-schedule involving up to 18 bids for multiple assets in agreement with Eq. (1). The IPO purchase price is fixed according to Eq. (2) in the first stage and is publicly announced in the second stage. Upon the announcement, investors state the number of shares they are willing to acquire at that fixed price. Shares are allocated according to a probabilistic pro-rata rule; each share request is equally considered and the winning bids are randomly drawn. The quantity demand of the second stage is individually limited to the number of bids submitted in the first stage. Thus, submission is encouraged of a maximal number of bids in the first stage. As bids in BB have no direct allocation implication, on the other side, incentives exist to low ball on bidding in the first stage to induce a lower offering price (as suggested by Ljunqvist 2007). The IPO price in the BB treatment must therefore be expected to be lower than in the CB treatment.
3.2.4 Design Justification for IPO Treatments
For the design of our treatment conditions, we focus on two aspects. First, the treatment should be close to the existing real-world IPO mechanisms. Second, the treatments should be simple for implementation in the laboratory with minimal differences across treatments. The closed book auction comes very close to the standard IPO auction in the real world. Indeed, the experiment uses a smaller lot size, a shorter submission period and sets a reserve price of zero. The open book auction is a potentially interesting IPO format,Footnote 13 but direct revelation of price information has been rather exceptional in real world public offerings. During the IPO auction of Health Communications Network and Charos Music, the IPO underwriter, Ord Minnetts’s eCapital auction, repeatedly revealed additional bidding information, including average bid price (Jagannathen and Sherman 2006). In related real-world auctions for bond issues WR Hambrecht & Co. typically offers real-time information on the development of the market demand curve. Finally, the book building process in our experiment with the purpose to determine a fixed offer price is simplified and transparent compared to the procedure in the real world. The book runner is usually a consortium of investment banks that elicits opinions from institutional investors to determine a range for the IPO price and the size of the capital raise. Before the first listing on the exchange, this price range is communicated to investors. Based on demand, the IPO price and size are fixed during the final days of the IPO. Hence, our implementation abstracts from many complications in real-world IPOs.
3.3 The baseline BL treatment
Additionally to the IPO treatments, we consider a baseline-BL treatment. The BL is a variant of the design by Smith et al. (1988), including three non-dividend paying periods prior to the start of the 15 dividend paying periods. Subjects are randomly assigned to one of three income classes; the first three subjects are endowed with 225 money units and three shares of assets, the second three subjects are endowed with 585 money units and two shares of assets, and the last three subjects with 945 money units and one shares of assets. Hence, including cash and the expected sum of dividends, the value of each trader’s endowment is 1305 money units, which equals the individual cash endowment in the IPO treatments. Finally, it should be noted that in the first dividend paying period—the aftermarket in the IPO treatments—the fundamental value equals 360 money units in each of our treatments. This treatment serves as a benchmark, i.e. we measure underpricing in the IPO treatments relative to underpricing in BL (which will be discussed in the next section).
3.4 Return measures
To measure underpricing, in line with the literature, we focus on the aftermarket excess return of the IPO. For this purpose, we start by measuring the return in round \(\tau = \{ 1,\,2\}\) of treatment {CB, OB, BB, BL} by the capital gains yield:
where p0,τ denotes the IPO price and the closing price of the last pre-period in BL, respectively. For the aftermarket reference price p1,τ we consider the average period price throughout the paper; other reference prices in the aftermarket–the median price, the closing price, and the bid-ask midpoint in line with DeGeorge et al. (2010)—do not change the results (see online appendix section 2).Footnote 14IPO underpricing in each cohort is then defined by the difference between IPO return and average baseline return:
where the super index IPO represents each considered treatment but BL. This definition, which is in line with the IPO literature (e.g., DeGeorge 2010), takes into account that the capital gains yield in the first period could be influenced by information processing of subjects about ex-ante uncertainties in the market including other subjects’ beliefs and risk preferences. Hence, we adjust for the return in a non-IPO setting in which the benchmark p0,τ is formed already by the market in previous periods.Footnote 15 In contrast to other experimental studies, our experimental design contains an aftermarket and a control treatment that enable us to measure underpricing in accordance with (2).
In contrast to real-world markets, our experimental setting enables us to measure expected excess returns by the price deviations from the fundamental value. The a priori asset value per share in terms of (discounted) sum of expected dividend payments is 360 money units in each treatment prior to the first dividend payment because the risk-free interest rate is zero in our experiment. Hence, we define the expected excess return of the IPO, xτ by the deviation of IPO price from the risk neutral fundamental value.
3.5 Testable hypotheses
In our experiment, investors have common information about the entire procedure of the IPO and the aftermarket. They are symmetrically and transparently informed about the dividend distribution and the expected cash flows to equity. The market imperfections emphasized in the above surveyed demand side and supply side explanations of underpricing are absent. It is a justifiable theoretical benchmark if we propose that the price should equal the discounted sum of expected dividends.
Hypothesis 0
Initial public issues yield no underpricing (\(X_{\tau }^{IPO} \, = 0\;\forall \;\tau\)) and IPO price equals fundamental value (\(x_{\tau } = 0\;\forall \;\tau\)).
However, at least two alternative explanations could justify underpricing even in our setting where symmetric and transparent information on the fundamental asset value is given: (i) uncertainty of aftermarket behavior and (ii) a market-wide impact of IPO investors’ reluctance to sell at a loss.
-
(i)
Traders face strategic uncertainty about the behavior of the others, about asset pricing and their opportunities to buy and sell in the aftermarket. Therefore, it is reasonable for investors to request an uncertainty premium on IPO investment. This uncertainty premium is similar to the adverse selection problem resulting in the winner’s curse referred to above, despite the fact that information in our setting is symmetric. When subjects are inexperienced, the strategic uncertainty about the aftermarket behavior looms larger than when once experienced.
-
(ii)
Underpricing may be influenced by a psychological bias akin to the disposition effect (Shefrin and Statman 1985) according to which investors are reluctant to sell below their purchase price. Because in the IPO, every investor pays the same asset price, the IPO price thus could be a psychological anchor of the market. Allowing for a market-wide impact of the reluctance to sell below the purchase price, there is more upside than downside to share appreciation. Hence, we formulate the first alternative hypothesis.
Hypothesis 1
There is underpricing in each IPO mechanism and each round, \(X_{\tau }^{IPO} > 0\;\forall \;IPO,\tau\).
In view of (i), one may expect that learning by experience has a decreasing effect on underpricing in a repeated IPO. As subjects’ uncertainty about aftermarket behavior is reduced in the second IPO once subjects are experienced, the level of underpricing should be affected if the driver of underpricing is uncertainty. Earlier experimental evidence suggests that subjects learn between market repetitions (as most illustratively presented by Haruvy et al. 2007) so that pricing is closer to fundamentals once subjects are experienced. We expect also for our IPO treatments that market valuation is closer to fundamentals once subjects are experienced; therefore, we anticipate a repetition effect on expected excess returns of the IPO with respect to fundamentals (2a). This effect may be reinforced by the decreased uncertainty about aftermarket trading behavior, which again may result in a decreased uncertainty premium required by the market and thus reduced underpricing (2b).
Hypothesis 2
(a) IPO-investors’ expected excess returns decrease with repetition, \(x_{2} < x_{1}\), and (b) the level of underpricing decreases with repetition \(X_{2}^{IPO} < X_{1}^{IPO}\).
The alternative explanation (ii) does not preclude but does not require a reduction of underpricing. A market-wide impact of the reluctance to sell below the purchase price implies some degree of persistence of underpricing. To examine whether IPO investors are reluctant to sell below their purchase price and take a loss we check the asking prices of sellers in the aftermarket. Individual investors’ reluctance to sell at a loss relative to their willingness to sell at a gain has been known as the disposition effect (Shefrin and Statman 1985). In view of (ii) we state the following hypothesis.
Hypothesis 3
Aftermarket asking prices equal or exceed the IPO price.
DeGeorge et al. (2010) report a smaller extent of underpricing in the IPO auction mechanism than in the book building mechanism with a fixed-price offering (see also Benveniste and Busaba 1997; Zhang 2009; Trauten and Langer 2012; Bonini and Voloshyna 2013). A lack of incentive compatibility (Ljunqvist 2007) could be the reason for this difference, as low price indications are not necessarily punished. In related literature, Levin and Kagel (2001) report evidence that bidding in dynamic multi-unit auctions with feedback is closer to the risk neutral equilibrium than bidding without feedback.Footnote 16 So, demand reduction may play a bigger role in the closed book format than in the open book format. Generally, the mechanism used can play a role for the pricing of offerings. Based on the referenced evidence we state the next hypothesis.
Hypothesis 4
Owing to price feedback, underpricing may be smaller in OB than in CB, and owing to incentive compatibility in CB smaller than in BB treatments, \(X_{\tau }^{OB} < X_{\tau }^{CB} < X_{\tau }^{BB}\).
3.6 General experimental procedures
At the beginning of each treatment, subjects are randomly placed at their computer terminals. Instructions, including a detailed explanation of the dividend stream, are read aloud and questions that arise are answered. Thereafter, participants practice trading and learn the interface of the aftermarket trading-platform in a trial period without payoff consequences. Next, one dividend stream involving 15 random draws is auctioned off in a pen-and-paper second-price sealed-bid auction to remind subjects of the fundamental asset value process.Footnote 17 The results of this second-price auction and the realization of the auctioned dividend stream are revealed and privately paid out to the winner only at the end of the experimental session. In the instruction session, we prepare subjects for trading and the pricing of dividend streams.
The first round starts after the remaining instructions were read aloud. In the IPO, the subject’s endowment, including share and cash allocation for the aftermarket, is determined; the asset-shares are allocated according to the described mechanisms and the IPO price of these assets is subtracted from the subject’s initial cash endowment. After the end of the first round, subjects are asked to repeat the experiment. The second round does not include a repetition of the instructions, and no cash or shares are carried over from the first to the second round.
We used an experimental currency unit equivalent to 0.01 Euro. At the end of the session, the payoff to subjects is the sum of their final cash balances in both rounds adding the show-up fee of four Euros.
4 Data and results
4.1 Experimental Setup
Subjects were undergraduate students of the universities at Magdeburg and Bonn. Each subject participated in exactly one market involving nine investors. The data consist of seven independent observations in each treatment.Footnote 18 In total 252 participants (= 7 independent markets × 9 participants × 4 treatments) were recruited via ORSEE (Greiner 2015) from the pool of economics students who had no prior experience with asset market experiments. The experimental software was programmed using z-Tree (Fischbacher 2007). The experimental sessions were completed within three hours and the participants’ average earnings including the show-up fee were 32.30 Euros,Footnote 19 the maximum being 105.60 Euros and the minimum 10.74 Euros.
4.2 IPO excess returns
4.2.1 Observation 1: EACH IPO treatment shows significant underpricing in both rounds
Support In Table 1, the first column records the short-term returns in the BL treatment. We calculate excess returns using the average price of the first period. Returns are reported for the first and second repetitions of the experiment, when subjects are inexperienced and once-experienced, respectively. We use the one-sample Wilcoxon signed ranks test on the sample of seven independent BL observations to check whether the returns are significantly different from zero. Returns are positive and significantly different from zero for inexperienced subjects. For experienced subjects, average returns in BL are not significantly different from zero. Note the return differences between first and second repetition of BL point to differences between underpricing and expected excess return (see observation 2). Underpricing is significantly different from zero whether subjects are inexperienced or experienced as seen in columns (II)–(IV) of the table, jointly with the z-scores of the two-sample test and asterisks indicating significant differences. The results of the Mann–Whitney two-sample test as reported in columns (II)–(IV) involve seven independent observations, the test results in column (V) involve 21 independent markets. It is remarkable that underpricing is positive in each IPO, in each repetition and with respect to each reference price.Footnote 20
4.2.2 Observation (2a): Underpricing is not significantly reduced once experienced
Support The one-tailed Wilcoxon signed ranks test of the null hypothesis \(X_{1}^{IPO} \le X_{2}^{IPO}\) cannot be rejected in favor of the alternative (Hypothesis 2b) of lower underpricing once experienced at any commonly used significance level when no distinction is made between treatments, i.e., based on 21 markets. Overall, as suggested by the measures recorded in Table 1 (column V), underpricing increases rather than decreases from the first to the second IPO. At the treatment level, we find underpricing to be significantly reduced in CB (\(z = - 1.690\)). This reduction, we must caution, could be a market reaction to the abnormally high level of underpricing in the first round IPO of the CB treatment. In OB and BB, in contrast, there are more independent observations for which the level of underpricing increases rather than decreases between rounds. Therefore, our data suggest persistence of underpricing between repetitions in OB and BB, and reversion in CB.
We provide further support for this observation with OLS regression results, which also show the treatment effect. In the regression, we make use of treatment dummies for the BB and CB treatments (where BB = 1 or CB = 1 in those treatments and zero otherwise), a regression dummy for experience (where experienced = 1 in the second round of the experiment and zero otherwise), and the interaction effect between experience and treatments. We report the results in Table A1 of the online appendix. Generally, we find no experience effect. Even for the CB treatment, the median and average price data suggest no significant repetition effect despite the extreme first round underpricing. That being said, the regression results indicate the treatment effect as we find reduced underpricing in CB on the basis of the bid-ask midpoint and the price at closing.
4.2.3 Observation (2b): IPO-investors’ expected excess returns are significantly positive in both repetitions but decrease once experienced
Support Table 2 records the average expected excess returns as defined in Eq. (3). As shown in column (VI), the excess return on the pre-market price in BL is significant with inexperienced subjects, but close to zero once experienced. In other words, closing prices in period zero of round 2 are almost at fundamental value. The expected excess returns on the IPO price are significantly positive in each IPO treatment and repetition [see columns (VII)–(X)]. Thus, IPO prices are significantly below fundamental value. The overall average expected excess return on the IPO price, however, declines significantly from 93 to 47% between rounds (column X). The decline in expected excess returns on IPO prices is significant based on the reported results of the Wilcoxon signed ranks test with 21 observations. The results support the testable Hypothesis 2a. At the treatment level, however, the decline in expected excess return on the IPO prices between rounds is significant only for the CB treatment, but not for the OB and BB treatments. In sum, the general support for Hypothesis 2 is weak, and Hypothesis 0 must clearly be rejected, although the second-round return in BL is close to zero.
4.3 Asks and bids in the aftermarket
Having observed that the underpricing in our markets does not vanish (Observation 2a) we must pose the question why? The empirical literature reports that a psychological bias such as the disposition effect plays a crucial role in the decisions of investors (e.g., Odean 1998). In particular, investors are reluctant to realize their losses. This behavioral trait is a good candidate theory in support of the underpricing anomaly. If investors collectively refrain from selling their shares below the IPO price, prices can only have an upward direction. Towards this quest, we investigate the asking pattern of investors in the aftermarket.
4.3.1 Observation 3: Investors exhibit a reluctance to sell shares in the aftermarket below the IPO price (disposition effect)
Support In Table 3 we report the total number of asking and bidding prices that we observe in the aftermarket of our IPO treatments including market orders; 15% and 12% of total orders were market orders (leading to transactions confirming outstanding limit orders) in the first and second round, respectively. We observe only a small minority of asks below the IPO price; the majority of asks are above this benchmark. As reference point we note the significantly larger fraction of bids submitted below the IPO price. Thus our data indicate a systematic imbalance vis-à-vis the IPO price on the supply side of the market. The table shows that the frequency of bids and asks is similar above the IPO price (bids slightly outnumbering asks), but apparently different below the IPO price.Footnote 21 We observe a total of 27 (2.21%) and 2 (0.22%) asking prices below the IPO price in 21 sessions in the first and second rounds respectively.
We provide evidence for the significance of the investors’ reluctance to sell at a loss in two ways. First, we show that sellers’ asking behavior with respect to the IPO price is significantly different from sellers’ asking behavior with respect to the benchmark from the BL, i.e., the previous closing price in the control treatment. To do so, we compare the conditional relative frequency of asks below IPO price in the IPO treatments (3.00% on average in the two rounds) with the conditional relative frequency of asks below the latest pre-period price in the baseline treatment (16.10% on average). The difference is significant; the p value of the two-tailed Mann–Whitney test is 0.047.Footnote 22 There are significantly more asks submitted below the prior closing price in the baseline treatment than asks below the IPO price in the IPO treatments. Since the expected excess return is significantly positive in both IPO rounds, we must show it is no level effect. Therefore, we report in Table A2 of the online appendix the outcomes of an OLS regression of the number/share of asks below IPO price on the IPO price-level. Hence, we observe no effect of the IPO price-level.
Second, we show by simulation between IPO markets that subjects’ after-market asks are correlated with the IPO prices. To show that sellers anchor on the IPO price, we take the 21 IPO prices and the ask data for the 21 after markets and count the number of times the asks in the aftermarket are below any of the IPO prices. If aftermarket asks were independent from IPO-prices then there should be a similar number of asks below any randomly assigned IPO price. If, instead as we find, there are fewer asks below the actual IPO price than below a randomly assigned IPO price, it shows that shareholders anchor on the IPO price. We proceed with the following simulation steps. In the first step, the 21 observed IPO prices are exchanged between sessions, that is, they are randomly assigned to the sessions (by random draw without replacement, see the illustration in Figure A1 in the online appendix), while the observed aftermarket asking prices are kept with their sessions. In the second step, for each such assignation of random-sample IPO prices with actual aftermarket asking prices we count and total over our 21 sessions the number of asks that are below the randomly assigned IPO prices. Repeating 100,000 times the steps 1 and 2 we create a random distribution of number of asks below random IPO prices. (In Figure A1, we illustrate in an example the second simulation step, and we give more details on how the simulations lead to the random distributions displayed in Fig. 1).

Simulated distribution of asks below IPO price (round 1 left; round 2 right)
Figure 1 exhibits this distribution of the number of asks below the shuffled IPO prices for the first round of IPO price and aftermarket asks. Only 2 of 100,000 (0.002%) such simulations produce outcomes as extreme as, or more extreme than, the 2.21% reported for the first repetition. For the second round, 4.91% (8.30%) of the outcomes are (as extreme as, or) more extreme than the reported outcome of 0.22%.Footnote 23 As a similarly extreme outcome as the one observed thus is unlikely to have occurred by chance, we conclude that sellers anchor on the IPO prices when they submit their asking prices or when they accept an outstanding bid.
4.4 Comparing first-period and multiperiod performance of asset prices across IPO treatments
In the following, we compare market performance between treatments. First, we consider the first-period effect, i.e., the difference across treatments during the aftermarket (period 1). Then we consider the multiperiod effect (for period 1–15), i.e., we compare standard return and bubble measures across treatments.
For the aftermarket, we analyze whether the predicted ordering of excess returns across treatments is in accordance with Hypothesis 4 (\(X_{\tau }^{OB} < X_{\tau }^{CB} < X_{\tau }^{BB}\)). The treatment averages in Table 1 suggest a support of Hypothesis 4 for both rounds. However, making use of the Jonckheere–Terpstra test of ordered alternatives for these treatments, we cannot confirm this hypothesis at all conventional significance levels.Footnote 24 Given the number of independent observations under consideration we nevertheless take the test results as suggestive evidence in favor of Hypothesis 4.
The empirical literature on initial public offerings has identified two market anomalies; short-term underpricing and long-term underperformance (e.g., Loughran and Ritter 1995).Footnote 25 Above we have reported underpricing in the aftermarket. In this subsection, we briefly turn our attention to the performance of the assets in the multiple periods following the aftermarket. To examine if the two anomalies are related, we proceed in two ways. First, we analyze the multiperiod asset returns in line with the standard finance literature. Second, we discuss overpricing and mispricing measures as proposed in the experimental asset markets literature (e.g. Palan 2013; Powell and Shestakova 2017).
-
1.
To check for multiperiod underperformance, we take the closing price of the first period P1 as the point of reference to compute the investment period return (IPR) of the asset for each possible investment period following the first-period market closing.
$$IPR_{t} = \frac{{\bar{P}_{t} - P_{1} + \sum\nolimits_{\theta = 1}^{t - 1} {D_{\theta } } }}{{P_{1} }}$$(6)\(\sum {D_{\theta } }\) denotes the sum of received dividends prior to period t = {2,…T}, T = 25, and \(\bar{P}_{t}\) is the average price of the period. Comparing IPRt for each period t between BL and the IPO treatments, we find that all p values of the Mann–Whitney test exceed the 20% level for each investment period t in the first and the second repetition. Indeed, with our experimental data we are able to compare also the expected investment period returns between BL and the IPO treatments considering the expected rather than the realized dividend yield. The result is very similar. We find no significant difference in expected returns for any investment period in either round.Footnote 26
-
2.
A common way of examining the multiperiod performance in asset market experiments is by measuring the average distance of realized prices from the fundamental dividend value. We report the two measures introduced by Powell (2016); the Geometric Deviation (GD) and the Geometric Absolute Deviation (GAD),
$$GD = \left( {\prod\limits_{t = 1}^{T} {\frac{{\overline{{P_{t} }} }}{{FV_{t} }}} } \right)^{1/T} - 1$$(7)$$GAD = \exp \,\left( {\frac{1}{15}\sum\limits_{t = 1}^{T} {\left| {\ln \left( {\frac{{\overline{{P_{t} }} }}{{FV_{t} }}} \right)} \right|} } \right) - 1$$(8)where \(\bar{P}_{t}\) denotes the average price and \(FV_{t} = \sum\nolimits_{s = 1}^{T - t + 1} E D_{s}\) denotes the (fundamental) expected dividend value in t.Footnote 27GD measures average overpricing, e.g., a value of \(+ \,0.2\) or \(- \,0.2\) indicates that the asset is on average overvalued or undervalued by 20%, respectively. GAD measures average mispricing, for instance, a value of 0.2 indicates that the average price differs on average by 20% from the fundamental value. In Table 4, we report the measures for each cohort and averages for each treatment. Conducting two-sample Mann–Whitney tests, we find no significant difference across treatments.Footnote 28 For illustration, Fig. 2 depicts the price trajectories of each session and the treatment aggregations. As shown, we observe pricing above fundamental dividend value in most sessions in the first round but in fewer ones in the second round. However, there is no systematic difference comparing the treatments. In line with the literature in this experimental asset market design (Palan 2013), we find a significant experience effect as the level of overpricing decreases with repetition.Footnote 29 To conclude, we find no differences in multiperiod performance across treatments. Hence, we observe IPO underpricing but no multiperiod underperformance in our experiment.
Table 4 Bubble measures Fig. 2 
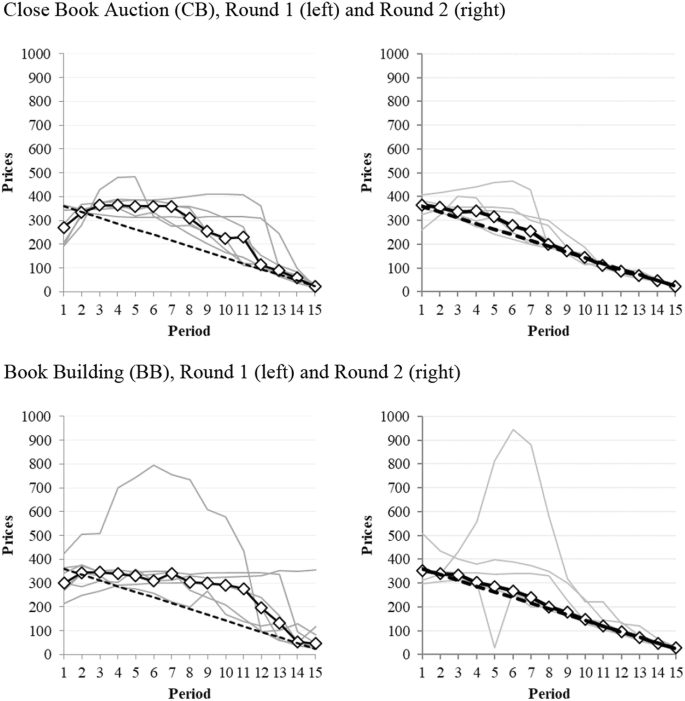
Time series of average transaction prices (continued). Note: The figure depicts average period prices of individual markets (grey lines), fundamental value (dashed line), and the median treatment price (black line with diamonds) for each period by treatment and round. In periods without transactions we geometrically interpolated the prices according to \(\overline{P}_{t} = FV_{t} \sqrt {\frac{{P_{t - 1} }}{{FV_{t - 1} }} \times \frac{{P_{t` + 1} }}{{FV_{t` + 1} }}}\)


5 Summary
In our laboratory study, we have investigated the behavior of prices in initial public offerings and the aftermarket. In contrast to other empirical studies we measure both underpricing relative to the market in absence of an IPO and expected excess returns relative to fundamental asset value. Our design eliminates most, if not all, of the commonly specified reasons for underpricing (Ritter and Welch 2002; Ritter 2003; Ljungqvist 2007: Derrien 2010). Despite our controlled, transparent and symmetric laboratory conditions, we observe underpricing in each IPO session and each repetition. Underpricing persists even as we resolve subjects’ uncertainty in the repeated setting, where we expected a decline in underpricing. Comparing aftermarket asking prices to IPO prices, we find that the average IPO excess return required by investors does not decline significantly between repetitions. The decrease in expected excess returns that we observe at the same time, however, implies that subjects’ uncertainty about aftermarket behavior does impact absolute IPO pricing. Therefore, we conclude that uncertainty impacts expected excess returns, but the impact of uncertainty on IPO underpricing is much less important than we thought before we turned to the data.
Our data suggest that IPO investors are reluctant to realize losses in the aftermarket. We suggest that a market-wide impact of the disposition effect can explain the IPO underpricing anomaly in our setting. As all IPO investors have the same purchase price, the reluctance to sell at a loss implies that the IPO price serves as a psychological support level of the aftermarket price. A similar impact was conjectured in the work of Kaustia (2004) who examined, starting from day 21, stock turnover in US markets over 2 years following the IPO. Kaustia’s observation that turnover is significantly lower for negative initial return IPOs when the stock trades below the offer price, and increases significantly on the day the price surpasses the offer price for the first time, seems to be related to our observation for positive initial return IPOs that asking prices in the aftermarket usually exceed the IPO price.
IPO underpricing is a very robust result in our data, which we observe across our three IPO mechanisms. The aftermarket performance is similar across our three IPO mechanisms. Further to the reported analyses in this paper, there is an online appendix to this paper. There, we report on IPO dynamics (Sect. 4) showing that aftermarket participants increase their IPO participation (see also Kaustia and Knüpfer 2008), probably because they regret the opportunity costs they incur by purchasing the higher priced shares in the aftermarket of the IPO. This effect is in line with learning direction theory (Selten and Buchta 1999; Neugebauer and Selten 2006; Selten and Neugebauer 2019). It contributes to a lower average expected excess return. Because the required return by IPO investors does not decrease, however, underpricing persists. We also observe that subjects in the open book auction tend to submit their bids strategically late, eventually reinforcing underpricing and demand reduction. Hence, we report late bidding in the multi-unit auction as has been done before for single-unit auctions (Ariely et al. 2005).
In contrast to our finding on persistent underpricing, Weber et al. (2018) report initial prices in bond IPOs closer to fundamental values in the fourth repetition. Despite the fact that their setting is very different from ours (i.e., uniform-price call auction, known dividends), it could be an interesting robustness check in our setting to see if underpricing still persists when the number of IPO repetitions increases.
From our analysis, we conclude that investor behavior explains the underpricing anomaly, as we observe underpricing under almost perfect market conditions. Further demand-side and supply-side effects as advanced in the literature are absent in our design. Those effects might indeed reinforce the empirically observed underpricing (see Sect. 2) and deserve further investigation in the laboratory.Footnote 30 Our design can be adapted to many different questions.
Notes
Kaustia (2004) also suggests that investors' reluctance to sell may be a likely source of underpricing.
More recent experiments of the Smith et al. design has illuminated the relevance of gender in asset markets (Eckel and Fullbrunn 2015, 2017), the relevance of cognitive abilities (Corgnet et al. 2014), the relevance of emotions (Breaban and Noussair 2017), and the irrelevance of capital structure (Charness and Neugebauer 2019), among other effects (Powell and Shestakova 2017).
The design of Smith et al. is however more interesting for our purpose than many other experimental asset market settings that may be less prone to mispricing because it involves the trading of a long-lived asset claims with and a clearly defined expected dividend stream and thus a clearly defined aftermarket value. Our experimental implementation should in fact be less prone to mispricing due to its transparency (Kirchler et al. 2012) since we continuously inform subjects onscreen of the expected sum of dividend payments than the standard setting, where dividend values are offered only in the instructions. Contributing to the literature on bubbles in the Smith design, furthermore we investigate whether mispricing over the life-time of the asset is different when subjects are endowed with shares, i.e., when they receive them as a gift, rather than when they purchase their shares in the IPO. Finally, the Smith et al. asset market design still serves as the main work horse most prominently shown recently in top field journals like e.g. Charness and Neugebauer (2019), Carle et al. (2019), or Kocher et al (2018) but also in experimental economics, e.g. Janssen et al. (2019).
According to evidence presented by Ellis et al. (2000), underwriters always trade actively in the aftermarket. Contrary to the assumption that average stabilization costs are substantial, however, the authors find that underwriters’ trading activities are profitable.
Michaely and Shaw (1994) find no support for the signaling theory as the data show rather a negative than positive correlation between the level of underpricing and the reissue decision. Habib and Ljungqvist (2001) note, however, that the smaller the fraction of the firm sold, the lower is the opportunity cost of a big first day run up. They report that many of the 1999–2000 internet IPOs with large first-day price jumps disposed of less than 20% of their equity.
As a great exception to this rule, Google used the auction mechanism in its recent public offering (see Trauten and Langer 2012).
The double auction market institution induces liquid trading at a good turnover and is quite efficient in dissemination and aggregation of information (see for instance Friedman and Rust 1993).
Subjects could unanimously vote for early termination, however.
See Füllbrunn and Neugebauer (2013) for a detailed description (SSW treatment).
There were sufficient bids submitted in each IPO, so all IPOs succeeded in our experimental sessions.
As pointed out in Noussair (1995), there are incentives to understate demand for multiple units in auctions with “first rejected bid” pricing (see also Kagel and Levin 2001). These incentives decrease with increased competition, however. Due to high demand elasticity that results in our setting from the large number of bids/shares-ratio and the relatively large number of bidders, expected deviations from the preference revealing amount should be negligible (Ausubel and Crampton 2004; Engelbrecht-Wiggans et al. 2006). Note that the results of our statistical analysis do not change if the price is fixed at the lowest winning bid. Hence, with unchanged conclusions any point in this interval could be used to determine the price.
It is interesting, because Google’s IPO was initially planned to be carried out on the eBay online auction platform. Furthermore, some bidding information is probably leaked between investors in closed book IPOs through internet forums or private communication (as suggested in the theory of Welch 1992). Therefore, it is interesting to investigate this potential IPO setting.
In the empirical literature, underpricing refers usually to first day return measures. How this corresponds to a lab setting is unclear. We have chosen the first period with different reference prices as the corresponding time frame, as traders face the same information environment while reacting to bids and asks in the market either early in the period or later in the period. If we instead of the entire first period examine only a fraction of the time, e.g., the first 30 or 60 s of the first period, the underpricing effect is the same.
We choose the closing price of period 0 in BL as relevant benchmark, since at this point of trading subjects’ beliefs and preferences should be already integrated in the price. Alternative benchmarks in period 0 of BL would shift \(R_{\tau }^{BL}\), but would not alter any of our results.
With the laboratory approach to pricing of initial public issues, we also contribute to the experimental common value auctions literature (Kagel and Levin 2002). Our approach is different in the way the common value is generated, i.e., by a stream of cash flows and the potential capital gains from trade in the aftermarket.
We provided a sheet with 48 dividend streams showing that the average of the sum of dividend streams is indeed about 24 per period and 360 in total. Then we auctioned off one dividend stream. Instructions can be found in the online appendix.
Sessions were conducted at the Magdeburg Experimental Laboratory (MaXLab) and the Laboratory for Experimental Economics at University of Bonn (BonnEconLab). For each treatment, we ran one session at the MaXLab with three independent markets and we ran two sessions at the BonnEconLab with two independent markets in each of the two sessions, yielding in total seven observations in each treatment.
Being approximately US$ 43.07 at the time we conducted the experiment.
Counting bids and asks, we find they are both equally frequent above the IPO price (p = 0.6764 and p = 0.2169). At (p = 0.0032 and p = 0.0048) and below (p = 0.0001 and p = 0.0001) the IPO price, however, bids are significantly more frequent than asks (p value of two-tailed Wilcoxon signed ranks test of first and second IPO on the sample of 21 markets).
As with most tests, we only use the independent observations here (21 for the IPO treatments and 7 for the BL).
The observed data involves only two asking prices below the IPO price (0.22% see Table 4), including one submitted ask and one accepted bid below the realized IPO price. Both the accepted bid (market order) and the submitted ask (limit order) were submitted within seconds by the same seller in the same session.
The one-tailed Jonckheere–Terpstra test yields the following p values for round 1 and 2, respectively, validating the order of treatments vis-à-vis underpricing with respect to the following reference prices: closing price (0.083; 0.074), median (0.057; 0.129), average (0.057; 0.129), bid-ask-midpoint (0.038; 0.065). The alternative hypothesis of the Jonckheere–Terpstra test suggests the order of excess returns in line with Hypothesis 4, while the null hypothesis assumes the opposite, that is, \(X_{\tau }^{OB} \ge X_{\tau }^{CB} \ge X_{\tau }^{BB}\).
In fact, the literature talks about a third anomaly called “hot issue market“, that describes the real world cycles in both IPO volume and underpricing. With regards to underperformance, Loughran and Ritter (1995) report a 20% underperformance over 3 years (or until delisting) of US IPOs relative to the regular market in the period 1970–1990. Underperformance is measured over the time horizon following the IPO on the basis of the closing price on the first day of trading in the secondary market.
The two-tailed Mann–Whitney test returns p values 0.9365 and 0.7947 for the first and the second round.
We consider the two-tailed Mann–Whitney test with seven observations for the BL treatment and 21 observations for the IPO treatment. P values of GD and GAD tests are 0.853, 0.614 and 0.730, 0.811 in first and second round. A Kruskal–Wallis test on treatment level also shows no significant difference of bubble measures across treatments (p > 0.6 for all four comparisons).
The Wilcoxon signed rank test suggests that the second round GD and GAD are significantly smaller than the first round GD and GAD (p = 0.018 in BL and p < 0.001 in the IPO treatments, similar for both measures).
For instance, asymmetric information may significantly affect IPO underpricing. In the asset market design of Smith et al (1988), for instance, Sutter et al. (2012) show that varying the information setting can impact the price. Furthermore, IPO investors are not necessarily identical to the traders in the aftermarket, where frequently underwriters are dominant market makers (see e.g., Ellis et al. 2000). Such differences between first and secondary market are not captured in our design yet.
References
Aggarwal, R., Prabhala, N. R., & Puri, M. (2002). Institutional allocation in initial public offerings: empirical evidence. Journal of Finance, 57, 1421–1442.
Amihud, Y., Hauser, S., & Kirsh, A. (2003). Allocations, adverse selection and cascades in IPOs: Evidence from the Tel Aviv stock exchange. Journal of Financial Economics, 68, 137–158.
Ariely, D., Ockenfels, A., & Roth, A. R. (2005). An experimental analysis of ending rules in internet auctions. The Rand Journal of Economics, 36, 890–907.
Ausubel, L. M., & Cramton, P. (2004). Auctioning many divisible goods. Journal of the European Economic Association, 2, 480–493.
Beatty, R. P., & Ritter, J. R. (1986). Investment banking, reputation, and the underpricing of initial public offerings. Journal of Financial Economics, 15, 213–232.
Benveniste, L. M., & Busaba, W. Y. (1997). Bookbuilding vs. fixed price: An analysis of competing strategies for marketing IPOs. Journal of Finance and Quantitative Analysis, 32, 383–403.
Benveniste, L. M., & Spindt, P. A. (1989). How investment bankers determine the offer price and allocation of new issues. Journal of Financial Economics, 24, 343–361.
Biais, B., Bossaerts, P., & Rochet, J.-C. (2002). An optimal IPO mechanism. Review of Economic Studies, 69, 117–146.
Bonini, S., & Voloshyna, O. (2013). A, b, or c? Experimental test of IPO mechanisms. European Financial Management, 19, 304–344.
Breaban, A., & Noussair, C. N. (2017). Emotional state and market behavior. Review of Finance, 22, 279–309.
Carle, T. A., Lahav, Y., Neugebauer, T., & Noussair, C. N. (2019). Heterogeneity of beliefs and trade in experimental asset markets. Journal of Financial and Quantitative Analysis, 54, 215–245.
Charness, G., & Neugebauer, T. (2019). A test of the modigliani-miller invariance theorem and arbitrage in experimental asset markets. The Journal of Finance, 74(1), 493–529.
Chiang, K. C. H., & Kung, A. W. P. (2005). Bidding dynamics in multi-unit auctions: empirical evidence from online auctions of certificates of deposit. Journal of Financial Intermediation, 14, 239–252.
Corgnet, B., Hernán-González, R., Kujal, P., & Porter, D. (2014). The effect of earned versus house money on price bubble formation in experimental asset markets. Review of Finance, 19, 1455–1488.
Cornelli, F., & Goldreich, D. (2001). Bookbuilding and strategic allocation. Journal of Finance, 56, 2337–2369.
DeGeorge, F., Derrien, F., & Womack, K. L. (2007). Analyst hype in IPOs: explaining the popularity of book-building. Review of Financial Studies, 20, 1021–1058.
DeGeorge, F., Derrien, F., & Womack, K. L. (2010). Auctioned IPOs: the U.S. evidence. Journal of Financial Economics, 98, 177–194.
Demers, E., & Lewellen, K. (2003). The marketing role of IPOs: Evidence from internet stocks. Journal of Financial Economics, 68, 413–437.
Derrien, F. (2010). Initial public offerings. In H. K. Baker & J. R. Nofsinger (Eds.), Behavioral finance, investors, corporations, and markets (pp. 475–490). Hoboken, NJ: Wiley.
Derrien, F., & Womack, K. L. (2003). Auctions vs. bookbuilding and the control of underpricing in hot IPO markets. Review of Financial Studies, 16, 31–61.
Eckel, C., & Füllbrunn, S. (2015). Thar “She” blows? Gender, competition, and bubbles in experimental asset markets. American Economic Review, 105(2), 906–926.
Eckel, C. C., & Füllbrunn, S. C. (2017). Hidden vs. known gender effects in experimental asset markets. Economics Letters, 156, 7–9.
Ellis, K., Michaely, R., & O’Hara, M. (2000). When the underwriter is the market maker: An examination of trading in the IPO aftermarket. Journal of Finance, 55, 1039–1074.
Engelbrecht-Wiggans, R., List, J. A., & Reiley, D. H. (2006). Demand reduction in multi-unit auctions with varying numbers of bidders: Theory and evidence from a field experiment. International Economic Review, 47, 203–231.
Fischbacher, U. (2007). z-Tree: Zurich toolbox for ready-made economic experiments. Experimental Economics, 10(2), 171–178.
Friedman, D. & Rust, J. (1993). The double auction market. Institutions, theories and evidence. In Proceedings of the workshop on double auction markets, held June, 1991 in Santa Fe, New Mexico. New York: Addison-Wesley.
Füllbrunn, S., & Neugebauer, T. (2013). Deflating bubbles in experimental asset markets: Comparative statics of margin regulations. In LSF research working paper series No. 13-14.
Füllbrunn, S., & Sadrieh, A. (2012). Sudden termination auction: An experimental study. Journal of Economics and Management Strategy, 21, 519–540.
Greiner, B. (2015). Subject pool recruitment procedures: Organizing experiments with ORSEE. Journal of the Economic Science Association, 1(1), 114–125.
Grinblatt, M., & Hwang, C.-Y. (1989). Signalling and the pricing of new issues. Journal of Finance, 44, 393–420.
Habib, M. A., & Ljungqvist, A. P. (2001). Underpricing and entrepreneurial wealth losses in IPOs: Theory and evidence. The Review of Financial Studies, 14(2), 433–458.
Hao, Q. (2007). Laddering in initial public offerings. Journal of Financial Economics, 85, 102–122.
Haruvy, E., Lahav, Y., & Noussair, C. N. (2007). Traders’ expectations in asset markets: Experimental evidence. American Economic Review, 97, 1901–1920.
Jagannathan, R., & Sherman, A. E. (2006). Why do IPO auctions fail? In NBER working paper 12151, (unpublished).
Janssen, D. J., Füllbrunn, S., & Weitzel, U. (2019). Individual speculative behavior and overpricing in experimental asset markets. Experimental Economics, 22, 653–675.
Kagel, J. H., & Levin, D. (2001). Behavior in multi-unit demand auctions: Experiments with uniform-price and dynamic Vickrey auctions. Econometrica, 69, 413–454.
Kagel, J. H., & Levin, D. (2002). Common value auctions and the winner’s curse. Princeton: Princeton University Press.
Kaustia, M. (2004). Market-wide impact of the disposition effect: Evidence from IPO trading volume. Journal of Financial Markets, 7, 207–235.
Kaustia, M., & Knüpfer, S. (2008). Do investors overweight personal experience? Evidence from IPO subscriptions. Journal of Finance, 63, 2679–2702.
Kirchler, Michael, Huber, Jurgen, & Stockl, Thomas. (2012). Thar she bursts—Reducing confusion reduces bubbles. American Economic Review, 102, 865–883.
Kocher, M. G., Lucks, K. E., & Schindler, D. (2018). Unleashing animal spirits: Self-control and overpricing in experimental asset markets. Review of Financial Studies, 32, 2149–2178.
Kutsuna, K., & Smith, R. (2004). Why does book-building drive out auction methods of IPO issuance? Evidence from Japan. Review of Financial Studies, 17, 1129–1166.
Liu, X., & Ritter, J. R. (2010). The economic consequences of IPO spinning. Review of Financial Studies, 23, 2024–2059.
Ljungqvist, A. (2007). IPO underpricing. In: B. E. Eckbo (ed.), Handbook in corporate finance 1: Empirical corporate finance (pp. 375–306). North-Holland.
Loughran, T., & Ritter, J. R. (1995). The new issues puzzle. Journal of Finance, 50, 23–51.
Loughran, T., & Ritter, J. R. (2002). Why don’t issuers get upset about leaving money on the table in IPOs? Review of Financial Studies, 15, 413–443.
Michaely, R., & Shaw, W. H. (1994). The pricing of initial public offerings: Tests of adverse-selection and signaling theories. Review of Financial Studies, 7, 279–319.
Neugebauer, T., & Selten, R. (2006). Individual behaviour of first-price auctions: The importance of feedback information in experimental markets. Games and Economic Behavior, 54, 183–204.
Noussair, C. (1995). Equilibria in a multi-object uniform price sealed bid auction with multi-unit demands. Economic Theory, 5(2), 337–351.
Odean, T. (1998). Are investors reluctant to realize their losses? Journal of Finance, 53, 1775–1798.
Palan, S. (2013). A review of bubbles and crashes in experimental asset markets. Journal of Economic Surveys, 27, 570–588.
Powell, O. (2016). Numeraire independence and the measurement of mispricing in experimental asset markets. Journal of Behavioral and Experimental Finance, 9, 56–62.
Powell, O., & Shestakova, N. (2017). Experimental asset markets: behavior and bubbles. In: M. Altman (ed.), Handbook of behavioural economics and smart decision-making: Rational decision-making within the bounds of reason (pp. 375–391). Edward Elgar.
Ritter, J. R. (2003). Investment banking and securities issuance. In: G. M. Constantinides, M. Harris, & R. Stulz (eds.), Handbook of the economics of finance 1A: Corporate finance (pp. 255–306). North-Holland.
Ritter, J. R., & Welch, I. (2002). A review of IPO activity, pricing, and allocations. Journal of Finance, 57, 1795–1828.
Rock, K. (1986). Why new issues are underpriced. Journal of Financial Economics, 15, 187–212.
Roth, A. E., & Ockenfels, A. (2002). Last-minute bidding and the rules for ending second-price auctions: Evidence from eBay and Amazon auctions on the internet. American Economic Review, 92, 1093–1103.
Ruud, J. S. (1993). Underwriter price support and the IPO underpricing puzzle. Journal of Financial Economics, 34, 135–151.
Selten, R., & Buchta, J. (1999). Experimental sealed bid first price auctions with directly observed bid functions. In: A. Rapoport, D. V. Budescu, I. Erev, & R. Zwick (eds.), Games and human behavior: Essays in honor of Amnon Rapoport (pp. 101–116).
Selten, R., & Neugebauer, T. (2019). Experimental stock market dynamics: Excess bids, directional learning, and adaptive style-investing in a call-auction with multiple multi-period lived assets. Journal of Economic Behavior and Organization, 157, 209–224.
Shefrin, H., & Statman, M. (1985). The disposition to sell winners too early and ride losers too long: Theory and evidence. Journal of Finance, 40, 777–790.
Shiller, R. (1988). Initial public offerings: investor behavior and underpricing. In NBER working paper 2806, (unpublished).
Smith, V., Suchanek, G., & Williams, A. (1988). Bubbles, crashes, and endogenous expectations in experimental spot asset markets. Econometrica, 56, 1119–1151.
Stöckl, T., Huber, J., & Kirchler, M. (2010). Bubble measures in experimental asset markets. Experimental Economics, 13, 284–298.
Sutter, M., Huber, J., & Kirchler, M. (2012). Bubbles and information: An experiment. Management Science, 58, 384–393.
Thaler, R. (1988). Anomalies: the winner’s curse. The Journal of Economic Perspectives, 2, 191–202.
Tinic, S. H. (1988). Anatomy of initial public offerings of common stock. Journal of Finance, 43, 789–822.
Trauten, A., & Langer, T. (2012). Information production and bidding in IPOs: An experimental analysis of auctions and fixed-price offerings. Zeitschrift für Betriebswirtschaft, 82, 361–388.
Vickrey, W. (1961). Counterspeculation, auctions, and competitive sealed tenders. Journal of Finance, 16, 8–37.
Weber, M., Duffy, J., & Schram, A. (2018). An experimental study of bond market pricing. The Journal of Finance, 73, 1857–1892.
Welch, I. (1992). Sequential sales, learning and cascades. Journal of Finance, 47, 695–732.
Zhang, P. (2009). Uniform price auctions and fixed price offerings in IPOs: An experimental comparison. Experimental Economics, 12, 202–219.
Acknowledgements
The scientific research presented in this publication has been given financial support by the National Research Fund of Luxembourg (PDR 09 044), (INTER/MOBILITY/12/5685107). Part of this paper was written at UJI Castellon and UC, Santa Barbara. We also acknowledge project funding through the University of Luxembourg (F2R-LSF-PUL-09BFAM). We gratefully thank Francois Degeorge, Ernan Haruvy, Charles Noussair, Abdoulkarim Sadrieh, Jason Shachat, Roberto Weber (editor) and two anonymous referees for helpful comments, as well as the participants of the ESA meetings in Copenhagen, Tucson, and Xiamen, and the seminar participants at University of Hamburg, and WHU Valendar. Finally, we also thank the MaXLab and the BonnEconLab for research assistance.
Author information
Authors and Affiliations
Corresponding author
Additional information
Publisher's Note
Springer Nature remains neutral with regard to jurisdictional claims in published maps and institutional affiliations.
Electronic supplementary material
Below is the link to the electronic supplementary material.
Rights and permissions
Open Access This article is licensed under a Creative Commons Attribution 4.0 International License, which permits use, sharing, adaptation, distribution and reproduction in any medium or format, as long as you give appropriate credit to the original author(s) and the source, provide a link to the Creative Commons licence, and indicate if changes were made. The images or other third party material in this article are included in the article's Creative Commons licence, unless indicated otherwise in a credit line to the material. If material is not included in the article's Creative Commons licence and your intended use is not permitted by statutory regulation or exceeds the permitted use, you will need to obtain permission directly from the copyright holder. To view a copy of this licence, visit http://creativecommons.org/licenses/by/4.0/.
About this article

Cite this article
Füllbrunn, S., Neugebauer, T. & Nicklisch, A. Underpricing of initial public offerings in experimental asset markets. Exp Econ 23, 1002–1029 (2020). https://doi.org/10.1007/s10683-019-09638-7
Received:
Revised:
Accepted:
Published:
Issue Date:
DOI: https://doi.org/10.1007/s10683-019-09638-7
Keywords
- Initial public offerings
- Underpricing
- Common value auctions
- Experimental finance
- Disposition effect
- Learning