
Abstract
Code reviewing is a widespread practice used by software engineers to maintain high code quality. To date, the knowledge on the effect of code review on source code is still limited. Some studies have addressed this problem by classifying the types of changes that take place during the review process (a.k.a. review changes), as this strategy can, for example, pinpoint the immediate effect of reviews on code. Nevertheless, this classification (1) is not scalable, as it was conducted manually, and (2) was not assessed in terms of how meaningful the provided information is for practitioners. This paper aims at addressing these limitations: First, we investigate to what extent a machine learning-based technique can automatically classify review changes. Then, we evaluate the relevance of information on review change types and its potential usefulness, by conducting (1) semi-structured interviews with 12 developers and (2) a qualitative study with 17 developers, who are asked to assess reports on the review changes of their project. Key results of the study show that not only it is possible to automatically classify code review changes, but this information is also perceived by practitioners as valuable to improve the code review process. Data and materials: https://doi.org/10.5281/zenodo.5592254
1 Introduction
Contemporary peer code review is a lightweight and informal process in which developers (a.k.a., the reviewers) judge the quality of a newly proposed set of code changes, using a dedicated software tool (Baum et al. 2016).
Despite the substantial practical adoption of code review (Rigby and Bird 2013), the knowledge on its effects—and how to measure them—is still limited. For instance, how can benefits such as knowledge transfer among developers be quantitatively assessed? Past research (e.g., Bacchelli and Bird 2013; Czerwonka et al. 2015) found a strong mismatch between what developers and managers think to obtain from code review (i.e., catching important defects early) vs. what they actually obtain (i.e., catching very few, localized, low-level defects).
This mismatch is not surprising: Assessing the effect of the code review process is a complex task and existing evaluation tools provide basic information, at most. Nevertheless, a number of empirical software engineering studies (e.g., Kemerer and Paulk 2009; Mäntylä and Lassenius 2009; Bacchelli and Bird 2013; Beller et al.2014; Thongtanunam et al. 2015a; Morales et al. 2015; Thongtanunam et al. 2016; McIntosh et al. 2016) did manage to devise approaches able to assess certain aspects of the effect of code review and have provided valuable information to researchers on the topic.
In particular, three studies (Mäntylä and Lassenius 2009; Bacchelli and Bird 2013; Beller et al. 2014) looked at the code review process from a new perspective that investigates review changes: the changes to the code that are implemented at review time (Fig. 1 shows an example of these review-induced changes).

Example of changes induced by a code review in JGit. For instance, at line 193 the reviewer asks to substitute the magic number “200” with a variable with a meaningful name. (https://git.eclipse.org/r/c/jgit/jgit/+/111364/20..21/org.eclipse.jgit.lfs/src/org/eclipse/jgit/lfs/LfsPrePushHook.java)
Under this perspective, these studies could (1) determine that most code reviews do not affect the functionalities of source code (Mäntylä and Lassenius 2009; Bacchelli and Bird 2013; Beller et al. 2014), (2) find the aforementioned mismatch between expectations and outcome in code review (Bacchelli and Bird 2013), and (3) lay out a number of other, previously undocumented, effects of code review (Bacchelli and Bird 2013). The key idea behind this perspective is an approach that evaluates the code review process by classifying the types of review changes. This approach answers questions such as: “Are most review changes fixing functional defects or improving other aspects of the code?” “What kind of defects are found most frequently during review?”
Two critical advantages of studying review changes are: (1) It pinpoints exactly the immediate effect of code review on code and (2) it is not influenced by the external confounding factors (e.g., change-proneness of artifacts or adjustments in the development process) affecting other long-term metrics, such as defect proneness (McIntosh et al. 2016).
In recent years, researchers focused on devising tools that leverage data from software development practices (Ball et al. 1997; Wolf et al. 2009; Bettenburg et al. 2008). In particular, researchers at Microsoft developed a tool, CodeFlow Analytics (CFA), to collect and display to developers information about the code review process (Bird et al. 2015). CFA was created to answer development teams’ requests to easily analyze and monitor their code review data. Bird et al. reported how CFA (1) successfully enabled development teams at Microsoft to monitor themselves and improve their processes and (2) having code review data at disposal stimulated further research to improve the code review process.
Based on the good welcome received by CFA, we believe that integrating information on review changes in a similar tool might be the next natural step to allow development teams to gain further insights in their code review process. This information could drive the team to reflect on the code review practices they have in place. For instance, if the majority of changes are documentation changes could not these be catched earlier in the development phase (e.g., using static analysis tools or improving the style guidelines of the project). This could allow developers to allocate more time in looking for functional defects, critical for the success of the project.
Nevertheless, the application of this approach to help developers to assess their review process is currently limited by two factors. First, the review-induced changes have to be manually classified: This aspect clearly impacts the scalability of the approach, as it can not easily be applied at large. Second, the target of such effort in classifying review changes has mostly been the research community and it is still unclear whether and how its output is meaningful to practitioners.
In this paper, we present a two-step empirical investigation we conducted to address these limitations. First, we investigate whether review changes can be automatically classified using a supervised machine learning approach; this with the goal of solving the scalability issue. To this end, (1) we manually classify 1,504 review changes using Beller et al.’s taxonomy (Beller et al. 2014); (2) we select 30 features based on the analysis of prior work (Buse and Weimer 2010; Fluri et al. 2007) as well as the insight acquired constructing the dataset; (3) we evaluate three machine learning algorithms to automatically classify review changes at two different levels of granularity. Our results show that the evaluated solution classifies code changes with an AUC-ROC beyond 0.91. This finding provides evidence that machine learning can be effectively employed to classify review-induced changes.
In the second part of our investigation, we focus on collecting feedback from developers. Our goal is two-fold: Analyzing developers’ perception concerning the classification of review changes as mean to support review practices as well as evaluating our approach in a real-world scenario. To this aim, (1) we interviewed 12 developers with experience in code review, and (2) we sent reports generated with our approach to 20 open-source projects, receiving feedback from 17 developers. Practitioners positively assessed the novelty of the information on review changes and gave an initial indication of the potential usefulness of this information, particularly for project managers interested in improving the code review process.
2 Background and related work
The topic of code inspection (Fagan 2002) has been largely explored in the past (Baum et al. 2017; Wiegers 2002; Porter et al. 1996) and, in the last decade, both research community and practitioners switched to the more practical concept of modern code review (Bacchelli and Bird 2013). In this respect, researchers have been investigating methodologies and techniques to provide support for developers during the code review process. For instance, researchers have devised automated solutions to identify proper reviewers for a new code change (Ouni et al. 2016; Kovalenko et al. 2020; Thongtanunam et al. 2015b; Zanjani et al. 2015), as well as investigated both the factors making the process more/less effective (Baum et al. 2019; Baysal et al. 2016; Bosu and Carver 2014; Kononenko et al. 2015; McIntosh et al. 2014; Ram et al. 2018; Thongtanunam et al. 2016; Spadini et al. 2018) and the actual influence of code review on the resulting software quality (Abelein and Paech 2015; Porter et al. 1998; Rigby and Bird 2013; Rigby et al. 2014; Sauer et al. 2000; McIntosh et al. 2016; Morales et al. 2015; Kemerer and Paulk 2009; Spadini et al. 2019; Vassallo et al. 2019a).
In the context of our work, we are mainly interested in review-induced changes (or simply review changes). These are the changes to which the code undergoes as result of the review process: e.g., as consequence of a reviewer’s comment (as shown in Fig. 1). However, changes to the code can also be triggered by other factors: e.g., a spontaneous action from the code author or informal discussions among developers. In this paper, our main goal is to overcome the current limitations to classify review changes and evaluating how this data can be used to support developers during code review. For this reason, in this section we focus on the discussion of previous papers that previously faced the problem of classifying review changes. Surveying the literature, we found three main works.
In the first place, Bacchelli and Bird (2013) analyzed the code review process in place at Microsoft, revealing a number of underestimated goals and benefits: among them, they pointed out that knowledge transfer and awareness of design solutions among team members are key aspects of modern code review. Bacchelli and Bird (2013) also highlighted that the main challenge for practitioners while performing code review is the comprehension of the newly committed code changes. This finding motivates our work, as it suggests the need for solutions able to help in classifying and showing to reviewers which changes have been performed.
Other papers aimed at characterizing which defects can be identified during code review. In this direction, Mäntylä and Lassenius (2009) were the first to empirically explore the types of defects discovered in code review sessions as well as their distribution in both industrial and academy contexts. To this aim, the authors assessed the outcome of over 100 code review sessions and defined a taxonomy of code changes. Their main finding reports that 75% of the inspected reviews identify defects that do not affect the external behavior of source code.
A further step toward this research direction has been made by Beller et al. (2014), who further explored what changes are performed in code reviews of open-source systems, with the aim of investigating what the real benefits provided by modern code review are. They considered over 1,400 code changes, manually labeling them using the taxonomy of Mäntylä and Lassenius (2009), whenever possible. As a result, they came up with an updated taxonomy of code changes done in code review, which is shown in Fig. 2.

Taxonomy (Beller et al. 2014) for review-induced changes with their categories/types
Taxonomy of review changes.
The taxonomy of Beller et al. presents two main categories, namely (1) Evolvability changes, which are related to all the modifications that do not have an effect of the functionalities implemented in the source code (e.g., those targeting documentation and refactoring) and (2) Functional changes, which are those that change the structure of the code, thus impacting on the inner-work of a program. These two main categories were then refined to report the specific types of evolvability and functional changes. A description of each type of change, together with an example from a real-world scenario, is available in Sections 2.1 and 2.2. Moreover, each type can be further divided into subtypes. Two tables offering a complete description of changes types and subtypes, respectively, can be found in our replication package.Footnote 1
Our work is clearly inspired by the paper by Beller et al. (2014) and aims at studying deeper the value of their findings: We investigate a technique to overcome the scalability limitations of their classification approach and assess with developers the value such information on review changes.
2.1 Evolvability changes
Evolvability changes can be defined as maintainability changes, which, therefore, do not have an impact on the functionalities of a system. Based on the taxonomy by Beller et al. (2014), they can be divided in five types:
- Textual: :
-
Textual changes concern the use of textual information in the code. In particular, they impact logging messages, adding or updating comments, or renaming variables to be more consistent with the environment (Figs. 3 and 4).
- Supported by language: :
-
Supported by language changes impact programming language-specific features used to convey information: e.g., the use of the final or static keywords in Java.
- Visual representation: :
-
Visual representation changes are related to the style of the code: e.g., they concern the wrong use of indentation in the code or the presence of unnecessary new lines and whitespaces.
- Organization: :
-
Organization changes involve a re-arrangement of the code. For instance, an organizational change can remove unused portions of code or move a method into a different class to improve the structure of the project.
- Solution approach: :
-
Solution approach changes modify the way in which a system’s functionality is implemented, without modifying the functionality itself: e.g., the removal of magic numbers in favor of predefined constants (Figs. 5, 6, 7, 8, 9, 10, 11, 12 and 13).

Example of Textual change, where a comment was rephrased for consistency with similar comments. The real-world code review in which this change took place is available http://review.couchbase.org/c/couchbase-java-client/+/57530/3..4/src/main/java/com/couchbase/client/java/bucket/AsyncBucketManager.java#b258

Example of Supported by language change, where the class that extends FtsServerOverloadExcpetion has been changed from CouchbaseException to TemporaryFailureException. The real-world code review in which this change took place is available http://review.couchbase.org/c/couchbase-java-client/+/99952/1..2/src/main/java/com/couchbase/client/java/error/FtsServerOverloadException.java

Example of Visual representation change where a reviewer requested to change the code indentation. The real-world code review in which this change took place is available http://review.couchbase.org/c/couchbase-java-client/+/100606/2..3/src/main/java/com/couchbase/client/java/transcoder/crypto/JsonCryptoTranscoder.java#b138online

Example of Organization change where a portion of dead code has been removed. The real-world code review in which this change took place is available http://review.couchbase.org/c/couchbase-java-client/+/19606/2/src/main/java/com/couchbase/client/ViewConnection.java#b246online

Example of Solution approach change. In this example the assert instructions has been changed for a more clear alternative without altering its functionality. The real-world code review in which this change took place is available http://review.couchbase.org/c/couchbase-java-client/+/18094/4..5/src/test/java/com/couchbase/client/ViewTest.java#b286online

Example of Resource change where the data buffer is closed in order to avoid unexpected results in the computation. The real-world code review in which this change took place is available http://review.couchbase.org/c/couchbase-java-client/+/62350/1..2/src/integration/java/com/couchbase/client/java/util/CouchbaseTestContext.java#b344

Example of Check change: A check is introduced to enforce that the object side is not null. The real-world code review in which this change took place is available http://review.couchbase.org/c/couchbase-java-client/+/102501/1..2/src/main/java/com/couchbase/client/java/query/dsl/path/HashJoinHintElement.java#b35

Example of Interface change that solve an issue with the incorrect order of parameters. The real-world code review in which this change took place is available https://git.eclipse.org/r/c/jgit/jgit/+/44126/2..3/org.eclipse.jgit/src/org/eclipse/jgit/util/TemporaryBuffer.java#543

Example of Logic change. In the given example, a check on the response status needs to be moved to allow a correct release of the content buffer. The real-world code review in which this change took place is available http://review.couchbase.org/c/couchbase-java-client/+/71319/1..2/src/main/java/com/couchbase/client/java/bucket/DefaultAsyncBucketManager.java#b189

Example of Support change, where new modules are added to the configuration settings to improve the security and stability of the system. The real-world code review in which this change took place is available https://android-review.googlesource.com/c/platform/art/+/839418/2..3/libartbase/base/common_art_test.cc#b336

Example of Larger defect change where an entire missing piece of code was added to the method. The real-world code review in which this change took place is available http://review.couchbase.org/c/couchbase-java-client/+/89902/3..4/src/main/java/com/couchbase/client/java/document/json/JsonObject.java#b262
2.2 Functional changes
Functional changes are modifications that impact the functionality of a system to ensure the correct flow of the program. Based on the taxonomy proposed by Beller et al. (2014), functional changes can be divided in six types:
- Resource::
-
Resource changes impact how the data are handled. They typically happen to solve issues in how the code manages data.
- Check::
-
Check changes are introduced to verify conditions of variables and functions left previously unchecked (possibly leading to run-time errors).
- Interface::
-
Interface changes impact the way the code interacts with other parts of the system: e.g., the use of incorrect parameters in a function call.
- Logic::
-
Logic changes solve issues in the logic of the system: for instance, when an algorithm produces incorrect results.
- Support::
-
Support changes solve issues related to support libraries (or systems) and their configuration: e.g., defects caused by the use of a wrong version of an external library.
- Larger defect::
-
Larger defects changes are modifications that address major issues in the code, often spanning across several classes: for instance, when a class is left partly implemented.
3 Research questions
The goal of this study is to understand (1) whether it is possible to devise an approach to automatically classify code review changes and (2) to what extent developers perceive information about review changes as useful (e.g., because these changes raise awareness about the outcome of the code review process in their projects). The perspective is of both researchers and practitioners. The first are interested in exploiting this new source of information to build analytics tools and devise new strategies to further support developers, while the latter aim to use this information to improve their processes and the overall quality of their software systems.
We start our investigation by focusing on whether a machine learning-based solution can automatically classify code review changes into the taxonomy proposed in prior work (Beller et al. 2014; Mäntylä and Lassenius 2009). A positive outcome would give us confidence that it is possible to overcome the scalability issues of this approach (Bacchelli and Bird 2013; Beller et al. 2014; Mäntylä and Lassenius 2009). Hence, we ask:

To the best of our knowledge, no previous attempts have been made to devise approaches to automatically classify review changes. For this reason, in RQ1 we could not compare our results with other existing approaches. In our investigation, we evaluated our approach in terms of AUC-ROC, using as baseline a random classifier. Having achieved promising results with the automated approach, we proceed to evaluate how information on review changes can be relevant for practitioners. To gather in-depth knowledge of the developers’ perception of the meaningfulness of our approach as well as the usefulness of classifying review changes for review practices, we devise a two-step investigation. First, we conduct semi-structured interviews with developers to gather their opinions on data on types of review changes as a mean to support code review practices (e.g., as a way to measure the effects of code review) and on the relevance of the taxonomy used for the classification. We ask:

Informed by the feedback gathered during the interviews, we devise reports based on review change data and investigate how experienced developers from open-source software projects perceive these reports. Therefore, our last research question is:

Our study features a mixed-method research approach (Johnson and Onwuegbuzie 2004) that includes (1) quantitative analysis on the performance of the investigated automated approach (Domingos 2012), (2) semi-structured interviews (Longhurst 2003), and (3) customized surveys with developers from open-source software systems (Fink 2003). The next sections describe methodology and results for each research question.
4 R Q 1: Classifying types of review changes
The first necessary step to use information about the types of review changes as a mean to support practitioners is to overcome the existing scalability issues (i.e., review changes have to be manually classified (Mäntylä and Lassenius 2009; Bacchelli and Bird 2013; Beller et al. 2014)). Here, we investigate an approach to automatically classify review changes and we evaluate its accuracy. In this study, we limit ourselves to the case of code changes in Java source code.
4.1 The evaluated approach
We design the proposed review changes classifier as a machine learning-based solution available in our replication package.Footnote 2 This choice is motivated by three main factors: (1) the amount of code review data available (e.g., in projects using GerritFootnote 3) that make supervised approaches practically suitable, (2) the restrictions of heuristics-based techniques, which may lead to approaches limited to certain programming languages, and (3) the ability of machine learning classifiers to identify the most suitable features to use and learn from previous changes applied by developers. To investigate the accuracy of a machine-learning based approach, we make the following steps:
- Dataset Selection. :
-
To select the projects to build our review changes dataset, we start from Crop (Paixao et al. 2018), a publicly available and curated code review dataset. Crop contains projects that use Gerrit as code review platform and those review data are publicly available. From the two communities (Eclipse and Couchbase) represented in Crop, we select JGit and JavaClient. These projects are (1) Java-based and (2) large open-source systems (ranging from 85k to 145k lines of code). Furthermore, the selected projects possess an active community of developers and reviewers, which makes them ideal targets of our investigation. We limited our selection to two projects from the CROP dataset to ensure that our classification covers a number of cases sufficient to report even the occurrences of uncommon types of changes. On the contrary, covering less cases from a more vast selection of projects might introduce bias in the types of changes contained in our dataset, under-reporting changes that occur less frequently. Moreover, we also consider Android, one of the most widely used projects in code review research. Android has a long development history with many active developers and reviewers and has been shown to be highly representative the code review practices of open-source projects (Bavota and Russo 2015; McIntosh et al. 2014, 2016; Pascarella et al. 2018).
- Dataset Labeling. :
-
To build and evaluate a supervised machine learning approach, we need reliable information on the actual labels to assign to the considered modifications (i.e., an oracle of code change types). With the labeled data, the approach learns from a subset of the labeled changes and can be tested on the remaining ones. To this aim, the first author of this paper manually classified the changes according to the taxonomy proposed by Beller et al. (2014), relying on (1) the source code of each modification and (2) the code comments left by developers on Gerrit. To each change was assigned both a category (Evolvability or functional) and a type. A description of each type is provided in Section 2. These changes were selected randomly choosing review IDs (i.e., a unique identifier assigned to a review in Gerrit) among all merged reviews in the considered project. Then, we performed a second step randomly choosing a patch set among the ones contained in the review. We excluded from this selection the first patch since we were not interested in changes done before the beginning of the review process. The labeling process took place between March 2019 and August 2019.
- Labeling Granularity. :
-
While analyzing the labeled dataset, we noticed that types of changes, such as Larger defect or Support are very uncommon. This observation was confirmed by previous studies: In their analysis Mäntylä and Lassenius found only eleven changes belonging to the larger defect type and no changes belonging to the support type (Mäntylä and Lassenius 2009). Similar results have been obtained also by Beller et al. (2014). Moreover, the overall amount of functional changes is significantly lower compared to the number of evolvability changes: Only 6.89% of all changes in our dataset belong to the functional category. This might significantly impact the performance of the devised classification approach as it would not have enough instances of each type of change to be able to make accurate prediction at type-level. For this reason, we argue that considering all eleven type labels might negatively impact the performance of our machine-learning approach.
Restricting our classification approach to work only at category-level might also not be an effective solution: We argue that the information offered by the categories might be too coarse-grained to offer valuable insight in the code review process. For these reasons, we devise the concept of group as an intermediate level of granularity for labels between categories and types. We define changes groups as follows. Referring to the taxonomy presented in Fig. 2, we aggregate types into their corresponding higher classes: ‘textual’ and ‘supported by language’ changes were considered as ‘documentation’ changes, while ‘organization’ and ‘solution approach’ changes as ‘structure’ ones. Therefore, a change group can be one of the following: ‘documentation’, ‘visual representation’, ‘structure’, or ‘functional’. Based on this consideration, we assigned to each change in our dataset an additional label reflecting the group to which it belongs. Then, we tested the performance of our model at both category and group level.
- Instance Unit. :
-
When labeling the review changes, we assigned the same ID to multiple changes when they were logically linked together: e.g., multiple changes involving the renaming of the same variable (as shown in Fig. 14). However, the granularity of our approach is the individual code change, which we call modification (an example of modification is shown in part
 in Fig. 14). More precisely, a modification is composed of a pair of code chunks (i.e., a group of continuous modified code lines): an old code chunk reporting the code removed in a change, and a new one representing the added code. However, a modification might not include (1) an old code chunk in case the code was only removed (Fig. 15) or (2) a new code chunk if the code was added without removing anything (Fig. 16).
Fig. 14 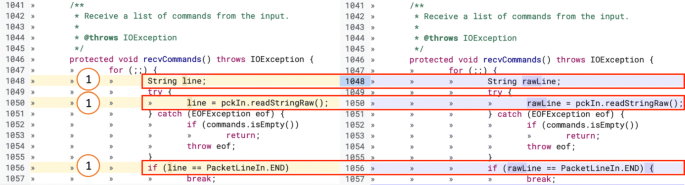
Example of logically linked review changes, therefore, labeled with the same ID. These changes gave origin to three modifications. The real-world code review in which this change took place is available https://git.eclipse.org/r/c/jgit/jgit/+/49966/3..4/org.eclipse.jgit/src/org/eclipse/jgit/transport/BaseReceivePack.java
Fig. 15 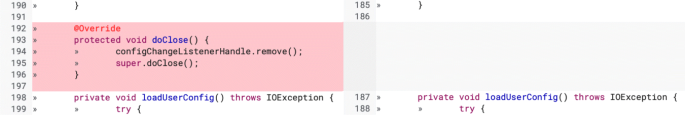
Example of a modification containing only an old code chunk. The real-world code review in which this change took place is available https://git.eclipse.org/r/c/jgit/jgit/+/1281/5..6/org.eclipse.jgit/src/org/eclipse/jgit/storage/file/FileRepository.java
Fig. 16 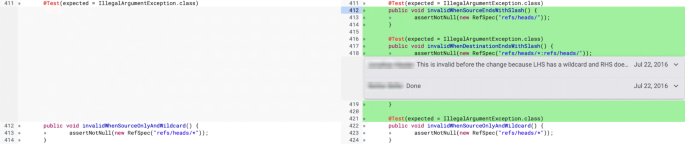
Example of a modification containing only a new code chunk. The real-world code review in which this change took place is available https://git.eclipse.org/r/c/jgit/jgit/+/77733/2..3/org.eclipse.jgit.test/tst/org/eclipse/jgit/transport/RefSpecTest.java
We mined Gerrit to extract the related code chunks for each of the review changes in the labeled dataset. However, the Gerrit API does not allow to extract information on the link between the old and new code chunks. Furthermore, although Gerrit UI displays related old and new code chunks together, this link is made based on the changes line number and not their content. Old and new code chunks impacting the same lines of code are reliably linked together. However, this is not the case when the old and new code chunk impact different code lines: e.g., when a function declaration is moved in a class. For these reasons, we need to link related old and new code chunks by ourselves. Keeping the old and the new code chunks separated, the designed approach computes the Levenshtein distance (Yujian and Bo 2007) among each old chunk and all the new ones. This process leads to the construction of a weighted bipartite graph, where each code chunk is a node and the computed distance represents the weight of the link. Then, it selects the pair that has the lowest distance, links them into a modification, and removes them from the graph. Finally, our linking approach proceeds iteratively among the remaining nodes in the graph. If multiple links have the same weight, it relies on the assumption that related code chunks are likely to have similar positions in the file. We tested our linking approach against all modifications contained in our dataset, after removing changes containing only import statements. The proposed approach reached a precision of 86.07% and an accuracy of 89%. Furthermore, we removed modifications containing only import statements as they might introduce potential bias in the classification approach. Chunks containing only import statements are logically linked to the chunks where the imported entities are used, sharing a common classification (category and type). Once grouped into modifications, these import chunks might have similar characteristics but different types, potentially reducing the classifier performance. Overall, this leads to 2,641 modifications. Each modification has two corresponding labels reporting its category (evolvability or functional) and its group (documentation, visual representation, structure or functional), respectively.
From Table 1, we see that functional changes represent less than the 7% of all modifications considered, while ‘documentation’ changes constitute 48.33% of the whole dataset, ‘visual representation’ the 15.23%, and ‘structure’ the remaining 29.55%. Such a distribution of changes confirms the findings previously reported in literature (Mäntylä and Lassenius 2009; Bacchelli and Bird 2013; Beller et al. 2014).
Table 1 Modification groups in our dataset - Labeling validation. :
-
To evaluate the reliability of the manually assigned labels, a second author performed an independent labeling of a statistically significant subset of the labeled dataset (306 changes, leading to a confidence level of 95% and a margin of error of 5%). Comparing the labels given by the two authors, 90% of the categories labels matched perfectly as well as 75% of the type labels. In the other cases, the two inspectors opened a discussion to reach a consensus and the dataset was adapted accordingly. To measure the inter rater agreement between the two authors we computed Krippendorff’s alpha coefficient (Krippendorff 2011) achieving a measure of 0.447 for the categories labels and 0.673 for the type labels. Although the alpha value for categories labels reports only a moderate agreement, we argue that this reflects the intrinsic unbalance in our dataset: Evolvability changes happen significantly more often during code review compared to functional changes (Beller et al. 2014; Mäntylä and Lassenius 2009).
- Machine-learning Features. :
-
As features of the machine learning algorithm, we selected metrics with three different scopes: the code in the old chunk, the code in the new chunk, and the difference between them. Tables 2, 3, and 4 show a summary of the metrics, grouped by their scope (the single code chunk or the whole modification) and the rationale behind them. The rationale behind each of the metrics selected for our investigation based on the literature and our observations during the creation of the dataset. We combined common code analysis metrics (e.g., LOC, LOCExec, or Cyclomatic Complexity) with a selection of code readability metrics: number of commas or number of cycles (Buse and Weimer 2010). The selection of these metrics is based on an analysis of the literature on what can characterize the type of a modification performed by developers (Fluri et al. 2007) and what can capture the nature of source code under different perspectives. The metrics that work at code chunk level are computed for both the old and the new code chunk in a modification.
Table 2 Code Metrics employed in the evaluated approach at code chunk level Table 3 Code Metrics employed in the evaluated approach at modification level Table 4 Code Metrics employed in the evaluated approach at modification level To compute the selected metrics, we extracted from Gerrit the code snippet of each review change contained in our datasetusing the java implementation of the Gerrit REST API.Footnote 4 Based on the retrived code snippets, we then computed the selected code metrics. The code developed to extract and compute the metrics is available in our replication packageFootnote 5 as part of the devised machine-leaning approach.
We also consider the comments associated with a modification (if any). The first of these metrics is words in comment, a metric that counts the number of words included in a comment. In computing this metric, we considered the main comment and all its replies as a unique entity. Our hypothesis is that modifications belonging to different categories or types involve a different amount of discussion (e.g., the request to change an algorithm might require more explanations than adding a missing comment). We collected the comments related to each code change using the Java implementation of the Gerrit REST API, in a similar fashion to what done for the code of each change. Subsequently, we analyzed the content of comments. To this aim, we first follow a typical Information Retrieval normalization process (Baeza-Yates et al. 1999) involving tokenization, lower-casing, stop-word removal, and stemming (Porter 1997). After these pre-processing steps, we computed the 50 most frequent words taking into account the whole corpus of comments of our dataset. Based on this analysis, we cluster them into seven groups grouping together words indicating a similar operation on the code (e.g., remove and delete): We define groups of words that could help the classifier to distinguish between different change types. The defined group of words are reported in Table 5.
Table 5 Metrics derived from the analysis of review change comments - Machine-learning Algorithm. :
-
We experiment with three different classifiers: Random Forest, J48, and Naive Bayes. We selected these classifiers as they have been successfully applied to solve similar problems in the software engineering domain: e.g., defect prediction (Giger et al. 2012; Lessmann et al. 2008; Strüder et al. 2020) or refactoring recommendation (Pantiuchina et al. 2018; Kumar et al. 2019). These classifiers make different assumptions on the underlying data, as well as having different advantages and drawbacks in terms of execution speed and overfitting (Bishop 2006). In building our approach, we deal with two different classification scenarios: (1) a binary classification to classify a modification in one of the two categories (evolvability or functional); (2) a multi-class classification to assign each modification to one of the four groups (documentation, visual representation, structure, and functional). In the multi-class classification scenario, we estimate multi-class probabilities directly. We do not use techniques such as one-vs-one or one-vs-rest.
Our analysis revealed how the number of if statements (#Added if and #if diff ) is one of the most prominent variable in our model (at both category and group-level). The vast majority of check and logic changes among the functional changes in our dataset (respectively, 34.95% and 24.73% of the functional changes) might explain the high importance of these variables in our model. Both check and logic changes involve fixing issues with variable checks and comparisons: e.g., adding a missing check on the variable returned by a method.)
Variables related to the number of lines of comments are also evaluated as particularly important (especially the number of the LOC in the new code chunk of a modification). We argue that high number of comments LOC might be a strong indication of a documentation change. Overall, documentation changes constitute 48.33% of all the modifications in our dataset.
We test our approach using either gain ratio or correlation-based feature selection. We notice that using correlation-based feature selection leads to better performance. For this reason, we select this technique and we remove the reported non-relevant features. We test different correlation thresholds to remove non-relevant features to predict modification categories and groups. When evaluating our model at category-level, we notice that its performance slowly increase until a threshold of 0.005 of correlation is selected to exclude non-relevant features. Afterwards, the performance of the model remains stable until decreasing again for even smaller threshold. Based on these observations, we select 0.005 as our feature selection threshold at category level. This leads us to exclude the following features from our model: method word (corr. value 0.0044); #Round brackets diff (corr. value 0.0031); change word (corr. value 0.0030); #Assignment diff (corr. value 0.0009); #Methods changed (corr. value 0.0001); Brackets (corr. value 0). Concerning groups, we apply a correlation threshold of 0.01. This leads to include almost all the computed features in our model, with the exception of Brackets since our analysis shows that is uncorrelated to the class variable (corr. value 0).
- Data Preprocessing and Training Strategy. :
-
We consider three typical aspects for the use of machine learning models: (1) data normalization (Kotsiantis et al. 2006), (i.e., the reduction of the feature space to the same interval) (2) removal of non-relevant features (Chandrashekar and Sahin 2014), and (3) balancing of minority classes (Krawczyk 2016). We use the normalize function available in the Weka toolkit to scale data (Hall et al. 2009), while we employed and Synthetic Minority Oversampling (SMOTE) (Chawla et al. 2002) for balancing the data, respectively. To implement SMOTE in our machine-learning approach, we relied on the SMOTE class offered by the WEKA Java API.Footnote 6 Afterward, we run the selected machine learning classifiers using all combinations of settings (e.g., without data normalization but including feature selection), so that we can identify the most performing solution. Moreover, we test the performance of the models considering both within- and cross-project strategies. In the first case, we train models only using the data of single projects and validate their performance using the 10-fold cross validation method (Arlot et al. 2010); to mitigate the possible negative effect of random fold splittings (Tantithamthavorn et al. 2016) and have a more reliable interpretation of the results, we repeat the validation ten times. In the second case, the data of two projects are used to train the models, while the remaining project is used as test set; we run the models multiple times to allow each project to be the test set once.
- Evaluation Metrics. :
-
We assess the goodness of the experimented models by computing Precision, Recall, F-Measure, AUC-ROC, and Matthew’s Correlation Coefficient (MCC) (Reich and Barai 1999). These metrics provide different perspectives on the performance of the investigated approach.
- Feature selection: :
-
To identify relevant features for our classification problem, we apply two different techniques: (1) Gain Ratio attribute selection (Karegowda et al. 2010) and (2) Correlation-based feature selection (Hall 1999). Gain ratio attributes selection evaluates the importance of an attribute computing the gain ratio with respect to the class. Table 6 reports the ten most relevant features in terms of Gain Ratio to predict categories or groups, respectively. The complete list of metrics is available in our replication package (Fregnan et al. 2020). Correlation-based feature selection measures instead the value of Pearson’s correlation between it and the class to evaluate the importance of a feature. Table 7 shows the ten most relevant features based on their correlation value (the complete list of values is available in our replication package (Fregnan et al. 2020)).
Table 6 Gain Ratio of the ten most relevant features to predict change categories or groups, respectively. When a metric is computed at code chunk-level, we specify between brackets if it is related to the new or the old code chunk in a modification Table 7 Pearson’s correlation value of the ten most relevant features to predict change categories or groups, respectively. When a metric is computed at code chunk-level, we specify between brackets if it is related to the new or the old code chunk in a modification
 in Fig.


4.2 Analysis of the results
The final manually labeled dataset contains 1,504 changes with an assigned label. We classified 227 additional review changes, but these are borderline cases that could not be properly assigned to a label with the available data, thus we excluded them from the dataset to not reduce potential errors.
Table 8 shows the results achieved by the best of the experimented models in terms of F-Measure. A report on the performance of the other experimented models and configurations is available in our replication package (Fregnan et al. 2020). This configuration uses Random Forest to predict both the category and group labels, normalizing the data and oversampling the minority class using SMOTE. We kept the standard parameter settings offered by the WEKA implementation of SMOTE. In particular, the default percentage parameter of SMOTE was left to 100: This parameter specifies the percentage of SMOTE instances the algorithm creates. To avoid introducing bias in the classifier performance, we apply class-rebalancing with SMOTE only to the training data and never to the test data, following the guidelines of Santos et al. (2018). The results have been computed combining the three projects in our dataset and applying 10-fold cross validation ten times. At category level, our model reached promising results, showing an AUC-ROC of 0.91 and MCC of 0.61. Furthermore, the model could classify evolvability changes with a precision and recall of 0.97 and 0.98, respectively, resulting in an F-Measure of 0.97. As for the functional class, we achieved an F-measure of 0.63, with precision and recall of 0.70 and 0.57, respectively. At group level, the AUC-ROC computed for each of the four classes was above 0.91, giving a first indication of the feasibility of the task using the proposed model.
Considering these results, the selected features seem to be good predictors for the types of review changes, thus suggesting that it is possible to overcome the scalability issues of previous approaches to classify review changes.

At category level, we selected a feature selection threshold of 0.005 (as reported in Section 4.1). This value was identified as a key point in the classifier performance: The classifier performance slowly increase until reaching this threshold, after which they begin to decrease. Despite this, the selected value might be considered too small and, thus, lead to overfitting. To mitigate this risk, we explored how the performance of our classifier changed for higher thresholds, 0.005 and 0.01, respectively. Table 9 reports the results achieved by our classifier when these feature selection threshold are selected. We used the best performing classifier (Random Forest with SMOTE) based on the results reported in Table 8. Even for higher thresholds, the performance of our approach remain stable and in-line with the previously reported results. This, combined with the other measures taken to reduce possible overfitting, contributes to strengthen our confidence in the reported findings. Nonetheless, further work might be conducted to further reduce this possible bias: e.g., by using Recursive Feature Elimination with Cross Validation (RFECV).
Despite the good overall results, we make some further observations on the performance of the model when it classifies the functional class. Table 8 shows that this category is the most problematic. To better understand the reasons behind this result, we conducted a further qualitative analysis. First, the limited amount of functional changes naturally limits the capabilities of the machine learner, as it lacks enough examples to fully learn how to classify them Pecorelli et al. (2019). Our dataset contains 6.89% of functional review changes. This is in line with previous findings that reported how functional changes constitute only a very low percentage of all the code changes that happen during code review (Beller et al. 2014; Mäntylä and Lassenius 2009).
Furthermore, the ‘functional’ class includes changes with very different characteristics: indeed, a functional change might range from a missing if statement to the modification of a whole algorithm. This large variety of changes for one category is a further challenge for machine learning solutions. Nevertheless, the performance achieved indicates that the features selected can discriminate most of the functional changes in our dataset, thus representing a promising baseline that other researchers can improve through further investigations. Finally, we performed an additional analysis aimed at improving the classification of functional changes. In particular, we assessed the suitability of cost sensitive learning (Elkan 2001): we assigned different cost weights to false positive and negatives of functional instances, thus testing the model with different cost matrix configurations. However, we did not achieve any significant improvement, confirming that further research is required to improve the classification of functional changes.

Our results showed that Random Forest achieved the best performance among the considered models. This is in line with findings of previous studies that reported how Random Forest outperforms Naive Bayes and other decision tree-based machine learning algorithms (Mahboob et al. 2016; Gata et al. 2019): For instance, in the field of software engineering, Random Forest was shown to perform better than other algorithms when used to build bug-prediction approaches (Kamei et al. 2010). Random forest is a machine learning algorithm that builds multiple decision trees and trains them with the “bagging” method. Compared to a decision tree, random forest randomly selects observations and features to create multiple trees. Then, the final performance is computed by averaging the results of each tree. We argue these characteristics of random forests might be what allowed it to outperform the other models we considered in our investigation: J-48 (an implementation of C4.5) and Naive Bayes.
To gain further insight into the differences between different groups of review modifications, we investigated which features are the most relevant to distinguish between a functional or a structure modification. To this aim, we built a binary classifier with these two groups (functional and structure) of modifications and excluding documentation or visual representation modifications. Then, we analyzed the importance of each feature in the model using correlation-based feature analysis. We report the ten most relevant features in Table 10.
The most important feature is the number of if added in a modification: Most of the functional defects involve changes in the logic of the algorithm or add checks on the variables. On the contrary, modifications that instantiate new objects or remove/replace method calls are likely to belong to the structure group: e.g., modifications belonging to the “solution approach” type (a subgroup of structure modifications) often involve removing unused methods to increase the maintainability of the code.
Finally, informed by the results of our feature importance analysis (reported in Tables 6 and 7) and by the comparison between functional and structure modifications (whose results are illustrated in Table 10), we select a subset of features that might be particularly relevant to highlight the difference among the four different groups of modifications. At the same time, we aim to verify previous hypotheses formulated based on the results of the feature importance analysis. To this aim, we selected the following three features: #if added, #new added, and #methods added. We report in Table 11 the mean and standard deviation of these features for each group of review modifications.
The mean of the number of added if statements (#Added if ) is significantly higher for the functional modifications compared to the other three groups (documentation, visual represenation, and structure). This confirms our previous hypothesis: A functional change often requires the addition of a check on a variable and, therefore, the number of added if statements can significantly help to distinguish between functional and evolvability changes. Considering the amount of added new objects declarations and method calls added, we noticed that the mean values of both these features are significantly different when comparing documentation and visual representation changes to structure and functional changes. Looking at only structure and functional changes, our results still confirm our hypothesis: Structure modifications have a higher number of added objects and methods, but the the difference with functional modifications is not so large as originally expected.
5 R Q 2.1: Evaluation of developers’ perceptions
To carry out an evaluation on using information on the types of review changes as a mean to inform practitioners about their code review process and evaluate it, we conduct semi-structured interviews involving twelve developers with code review experience (whose characteristics are summarized in Table 12).
After verifying that is possible to automatically classifying review changes (therefore overcoming the scalability issue of previous works (Bacchelli and Bird 2013; Mäntylä and Lassenius 2009; Beller et al. 2014)), our aim is to understand how this information is perceived by practitioners. For this reason, the goals of this investigation are the following: (1) collecting developers’ feedback on review changes classification and the potential use of this information to support and improve code review practices, (2) conducting a qualitative evaluation on the used taxonomy, and (3) gathering feedback on how to display the generated review changes data. In this investigation, we did not validate our machine learning approach. We focused instead on how information on review changes can be effectively used and shown to reviewers.
5.1 Design and methodology
Each interview has three parts: (1) A general discussion on code review, focusing on the interviewee’s experience; (2) a discussion on the concept of automatically classify review changes as well as the information it offers; (3) the evaluation of the taxonomy (Beller et al. 2014). All interviews have been conducted as semi-structured interviews (Newcomer et al. 2015; Longhurst 2003). Starting from the three above-mentioned general topics, the use of semi-structured interviews allowed us to dynamically adjust the structure of the interview to ask follow up questions when needed or address unforeseen points of discussion raised by the participants. We employed a set of slides to guide participants through the structure of the interview as well as to illustrate key concepts: e.g., the review changes taxonomy. The complete set of slides is available in our replication package.Footnote 7
In the first part, we open a discussion about interviewees overall experience with code reviews. This discussion allows us to gather participants background experience on code reviews and set the context for the concept testing. Afterwards, we present to participants the concept of classifying review changes. First, we explain orally the general idea of classifying review changes, then we show this information in four PowerPoint slides. Using code review data from the QT projectFootnote 8, the slides show two possible UIs as Gerrit extensions: (1) a general overview of the changes of the entire project, and (2) a detail view on a specific commit.
For the general overview, two alternative representations are shown in two different slides (Figs. 17 and 18). The UIs differ only from the charts used to represent the types of changes (pie-chart, histograms, etc.). We show more than one option to display alternative representations of the same data. Both slides show a list of the latest changes, and three charts representing the type of the changes over time totally, and for each developer. One additional slide of the general overview shows the evolution of review changes by developer, accessible by clicking on the developers’ name in the list of changes. Finally, one slide shows the categorization of changes for a specific commit as a pie-chart.

First view of a UI that leverages information on review changes. For readability reasons, this view contains only two charts (as opposed to the three in the original slides) and has a different layout compared to the one shown to the interview participants. The original slides are available in our replication package (https://doi.org/10.5281/zenodo.5592254)

Second view of a UI that leverages information on review changes, as shown to the participants during the interviews. For readability reasons, this view contains only two charts (as opposed to the three in the original slides) and has a different layout compared to the one shown to the interview participants. The original slides are available in our replication package (https://doi.org/10.5281/zenodo.5592254)
After presenting the concept of classifying review changes, we ask interviewees to express their feedback on this information and how it is displayed; they are also allowed to provide additional ideas and suggestions on what data/information might be useful to developers (e.g., to build a tool based on review changes data).
In the third step, we discuss with the participants the review changes taxonomy (Beller et al. 2014). To mitigate possible biases, we introduce the details of the taxonomy only in this last phase. We aim to validate if this taxonomy matches developers’ expectations. In particular, we focus on assessing if all the types in the taxonomy are understandable and match the interviewee’s experience. Before starting this discussion, we show the taxonomy to the participants and provide them with a brief explanation of each category and type. Because of the complexity of the taxonomy, we do not introduce the changes subtypes. To assess the taxonomy, we ask participants to place in the taxonomy each of the changes mentioned in the first interview phase. We finally discuss how difficult they perceive this task and whether they face any issues.
Interviews are conducted through video conference or in person and lasted approximately from 45 minutes to one hour. However, we do not define a strict maximum duration limit: We consider an interview concluded once all pre-determined topics are covered and the discussion naturally comes to an end. The study is held by one or two researchers and all interviews are recorded and transcribed. The second researchers participated in the first interview to ensure the goodness of the procedure. Before conducting the interviews, the authors obtained the approval of the ethics committee of their home institution. Moreover, interviewees were asked to sign a consent form to consent to take part to the interview. The form described the scope of the study.
To analyze the results of the interviews, we employ thematic analysis (Lyons and Coyle 2007). As a first step, we create codes: Brief descriptions of the content of the interview to summarize an idea presented by the interviewee. Subsequently, we identify common themes across different codes. To generate themes, we group together codes referring to the same topic. Finally, we review the identified themes to ensure their goodness: e.g., to avoid overlaps between different themes. The results are first analyzed by one of the authors, then checked by a second one.
Participants.
Twelve people participated in our semi-structured interviews on review changes. They are selected through snowballing of the professional network of the authors. Table 12 summarizes the background of the participants involved. Their age range from 18 to 44 years, with the majority (9) ranging from 25 to 35. The participants come from eight different countries with three from the US, and the remaining from the Czech Republic, France, Germany, Italy, and other European countries. Eleven participants identified themselves as males, while one identified herself as female. Currently, nine participants work in companies, among whom one also works as a Ph.D. student, two also contribute to open-source projects and one studies at the university. Two users work exclusively for open source projects, and one is a student. Overall, our participants have an average of 11 years of coding experience and 5.3 years in code reviews (std. 4.7 and std. 2.5, respectively). On average, 7.7 years of coding experience were acquired during academic studies (std. 3) and 9 in industry (std. 8.6). Participants reported to spend, on average, 17.2 hours a week doing code reviews (std. 10.2). Nine participants use code reviews tools such as GitHubFootnote 9 and CrucibleFootnote 10.
5.2 Analysis of the results
This section overviews the main findings achieved in RQ2.1.
- Information on review changes to support review. :
-
All participants found valuable and interesting the concept of using the information obtained by classifying review changes as mean to increase the understanding of code review. For instance, P1 stated that our proposed approach might help software teams to improve their code review processes and understand where and which problems are happening in the project. Similarly, P12 said that with such features developers may be able to avoid the same errors in the future. P3 also suggested that a tool that displays analytics on review changes might allow companies to understand where resources have been spent. Most developers (ten) mentioned managers as the perfect suit for the information generated by our approach; they commented that managers and CTOs could use these data for a better understanding of the project evolution. They reported how the information on the kind of review changes could be useful to project manager or tech-leads to assess the goodness of their review practices. For instance, P3 explained that this information could reveal if the team is paying attention to the right kind of defects. This is in line with the findings of Bird et al. (2015): their code review analytics tool became a valuable instrument for Microsoft developers to monitor themselves and improve their code review process. To increase the actionability of this information, interview participants suggested to compare the distribution of review changes in their project with benchmarks, created, for instance, by looking at similar projects or the history of the project under analysis. Eight participants acknowledged the potential benefits of this kind of functionality.
Moreover, our participants found that showing the type of changes for each developer may be problematic, for example creating competition [P12]. To avoid this issue, P11 suggested limiting access to this information. Seven participants stated that the most interesting information is the evolution of changes over time. P4 also stated that an additional feature might allow developers to change the level of granularity (year, month, and week). P11 and P7 suggested adding a chart, visible to the single team member, that compares the developer and to an ideal standard reviewer, obtained averaging the type of changes found by all reviewers in the project.

- Evaluation of the taxonomy. :
-
After the participants were briefed on Beller et al.’s taxonomy (Beller et al. 2014) and knew the definition of each category, we asked them to place some of the examples of review changes they mentioned during their interview within the taxonomy. All developers were able to fully or partially associate their changes into the various classes. During the task, all users could see a graphical representation of the taxonomy on the screen (Fig. 2). Four participants had no issues performing this task, while five had some initial doubts on where to put a change in the taxonomy. However, they were then able to decide before proceeding.
When asked to comment on the taxonomy, five developers stated that it could have some overlapping issues. Three participants suggested renaming some of the types (i.e., ‘Interface’, ‘Larger defects’) to lower confusion. Despite these comments, participants were able to associate most changes in the taxonomy. Although participant P9 recognized some overlapping issues, he stated that, overall, everything was fairly clear. Similarly, P7 found that classes may not be mutually exclusive, but stated that the taxonomy had enough descriptive power.

Overall, this evaluation phase brought positive feedback to motivate further research on classifying review changes to support practitioners (e.g., as an analytics tool) and improve Beller et al.’s taxonomy.
5.3 Follow-up interviews
We perform follow-up interviews with 7 developers from the original interviews. Our goal is two-fold: (1) Assessing the concept of group, introduced in Section 4.1, as intermediate layer in the review changes taxonomy; (2) Conducting an initial evaluation of the goodness of our approach with developers. Each interview was conducted by the first author in the form of semi-structured interviews and lasted approximately 30 minutes. All interview were conducted remotely. Moreover, to clarify the concepts discussed in the interviews and show examples to the participants, we use a set of slide (an example is available in our replication package (Fregnan et al. 2020)). Note that in the following section, we refer to the follow-up interviews participants with the code assigned to them in the original interviews and reported in Table 12.
- Evaluation of review changes groups: :
-
To evaluate the goodness of review changes groups, we discuss them with developers. First of all, we introduce again the concept of review changes as well as all the change types reported in Beller et al.’s taxonomy (Beller et al. 2014) (reported in Fig. 2). To support our explanation, we show to the interviewees a slide with the taxonomy.
All of the interviewees positively assessed the reduction of the original taxonomy into the defined four groups. P10 reported how the reduction into groups was based on the original taxonomy and did not arbitrarily introduced new categories. Five participants mentioned that the level of granularity of the classification depends on the goal of our approach. Participants agreed that the level of information offered by our approach is enough, for instance, to inform project managers about the kind of changes that happen in their code review process. For instance, P1 reported how groups are appropriate to offer an overview of the review process of a project, but a finer level of granularity is required to make this information fully actionable.
- Assessing our approach with developers: :
-
In the second part of the interviews, we conduct an initial evaluation of the performance of our classification approach with developers. To this aim, we show in random order to each participant 20 review changes and ask them to classify each change in one of the four group (documentation, visual representation, structure, and functional). To select the changes, we applied our classification approach to randomly selected reviews in the code review history of JGit. Among the resulting classified changes, we randomly choose five changes per group. Each participant is asked to evaluate a different set of review changes: We do not show the same change to multiple participants. Before asking participants to complete this task, we discuss with them the review changes taxonomy and introduce the concept of review change groups.
We compare the classification performed by the interview participants with the one of our approach. Overall, developers agreed with the approach classification in 79.41% of the cases. Despite this investigation constitutes only an initial assessment of the performance of our approach, the obtained results are encouraging. We notice that the majority of the disagreements between developers and our approach was caused by structure and functional changes. This might be caused by the relatively similar appearance of these two groups of changes: without having an in-depth knowledge of the project, it is not always possibile to immediately understand if a change is impacting the functionality of the code (therefore, being a functional change) or not.
6 R Q 2.2: Evaluation with open-source projects
In RQ2.2, we verify the meaningfulness of the information on review changes on 20 open source projects. The main goal is to analyze the developers’ perception of such data when related to their own codebase and, therefore, evaluate the impact of automatically classifying review changes for active software projects.
6.1 Design and structure
Design.
To analyze how information obtained by automatically classifying review changes is perceived by open-source developers, we consider 20 different projects and send the results of the classification to developers in the form of an online report, with some attached questions to gather feedback. We devised our reports following a methodology similar to the one used in previous studies (Vassallo et al. 2019a).
The target population of our investigation is represented by the main developers of each project (e.g., core developers or product owners): to give valuable feedback on the data generated by our approach is indeed necessary to have a high-level view and understanding of the whole code review process of the project. The respondents are contacted by sending the link to the report to the developers’ mailing lists or project forums, as these channels mostly attract the interaction of core contributors (Shibuya and Tamai 2009). Among the 20 projects (reported in Table 13), three are the initial systems used for the training of our tool (i.e., Android, JGit, and Java-client). The remaining projects are randomly selected among the ones belonging to the same communities as JGit (Eclipse) and Java-client (Couchbase). We focus on these communities because of the high review activity of their developers. Furthermore, all the selected projects respect the following criteria: they are mainly written in Java and use Gerrit as code review tool.
To create the reports, we extract information on the code review history of each project using the Java implementation of the Gerrit REST API.Footnote 11 We use these data as input for our review changes classification approach (presented in Section 4). The information returned by the devised classification approach is used to create the graphs shown in the online reports.
Structure of the reports.
In the online report, after a brief explanation on the meaning of review changes and their selected types (i.e., evolvability, functional, documentation, visual representation, and structure), we show developers an overview of the information collected by the designed approach, together with one real example of each type of change extracted from their project (see Fig. 19). Below the latest commits on the Gerrit platform, we show the general overview of the results. The overview shows the results in three forms. One chart (Fig. 19a) represents the total number of reviews that happened over the last year. This data is intended to give an idea of the amount of merged code reviews in the project. The second chart shows the total types of changes, computed over the last year, in a pie-chart (Fig. 19b). Finally, the histograms (Fig. 19c) represent the types of review changes that happened over the latest twelve months. Given the differences between the number of functional and evolvability changes, the two classes are shown in the same chart but with two different scales. Although this factor should be evident from the data shown on the single histogram of each change, we also inform the developers about the two different scales in the description of the figure and with a label below the chart. Following, we show to the participants both charts in detail (Fig. 19b and c) and ask developers to rate the information gained for the overview and for each detailed chart. More in detail, we ask if the figures are clear and if the information is useful for project managers and for developers. Furthermore, participants can also indicate how useful the entire report is, whether they perceive they learned something new from it and if this information might have a positive influence on their code review process.

General overview shown to participants. The images and charts were cropped for readability purposes. a Number of reviews over times. b Total review changes per group. c Review changes group over time. The original report is available in the replication package (https://doi.org/10.5281/zenodo.5592254)
At the end, participants can fill out background information to complete the collection of their data. We give them the possibility of contact us in case they were interested in knowing more details about our tool and the results obtained for their project. The answers to all the questions, excluding the ones requiring an extensive answer, are expressed using a Likert scale (Likert 1932) ranging from 1 (Strongly disagree) to 5 (Strongly agree). All reports are available in our replication package.Footnote 12
6.2 Analysis of the results
Out of the 20 reports sent, 18 developers from 10 different projects reached back to us with feedback. 17 of them replied to our questionnaire: we received 15 complete answers and 2 partial ones. Moreover, five developers additionally contacted us directly to give more extensive feedback. All respondents except one are core developers, integrators (i.e., developers having committing/merging rights), or product owners. For this reason, we consider them a valuable source of feedback as they are fully aware of what happens in the code review process. The last participant declared not to be involved in the development of the project, so we excluded their answer from our analysis.
The majority of the respondents acknowledged the novelty of the information provided by the designed approach assigning, on average, a score of 4.2 (std. ≈ 0.5) to this question on a Likert scale. One developer further commented on the value of this kind of data remarking that: “this provides a concrete way to measure one of the effects of code review”. To further confirm this aspect, some developers stated that they learned something new about their projects. For instance, one participant reported that: “The distribution of changes per group [is] different than expected”, while another was not aware of the distribution of the changes over time.
Moreover, we confirmed our initial hypothesis about the potential users of review changes data. Our participants agreed that the information provided by the overview (avg. 4.2, std. 0.5), graph B (avg. 3.9, std. 0.4), and graph C (avg. 4.3, std. 0.4) might be particularly valuable for a project manager. One of the developers reported that a closer look to the review process might help management to better understand the development process. However, they also mentioned the possibility of misuse of these data by the management. Such a possibility was also considered by some of the participants in our concept testing.
In contrast, and as found in RQ2.1, we obtained mild reactions when asking if the report could have been useful for developers (e.g., avg. 3.5, std. 0.62 for the overview). A developer further commented on this matter: “these kind of statistics are nice for a manager, but no clue how this would influence daily practice of an engineer?”.
Overall, developers positively assessed the value of the information shown in the reports. This gave an initial indication of the potential usefulness of information on review changes for practitioners. However, further studies need to be conducted to fully evaluate the usefulness of this information: e.g., integrating our classification approach into the code review pipeline of existing projects.

As a further step of the investigation, we evaluated potential actions on the review process that could be triggered by the information of our report. We asked participants to report how the data shown could influence code review policies, use of support tools, and reviewers assignment. However, we could not reach any strong conclusion on this matter since we got neutral responses (e.g., avg. 3.0, std. 1.03 for the tools use). We argue that a potential cause of these results might be the lack of further documentation and interaction with our visualization. For instance, one of our participants stated that they would need more details about each category to fully grasp the potential of the information. Similarly, another developer said that they might want to have more background on the specific changes that were classified in each category. In other words, developers recognized the value of the reported information but, at the same time, require additional understanding and possibly other data to fully benefit from it.

7 Discussion and implications
Our results highlighted aspects to be further discussed.
- Detecting functional defects in code review. :
-
As noticed in the context of RQ1, most of the changes applied in code review refer to evolvability modifications rather than functional ones. This finding confirms the results reported by Beller et al. (2014) and further supports the research aimed at improving static analysis tools to pinpoint potential issues in source code (Vassallo et al. 2018; Vassallo et al. 2019a; Di Penta et al. 2009; Johnson et al. 2013). Moreover, this result suggests that developers might benefit from the outcome of dynamic analysis methods during code review: for instance, providing developers with the output of test cases may help them in finding defects in source code.
- On the value of classifying review changes. :
-
First and foremost, the results achieved from both RQ2.1 and RQ2.2 suggest that the information coming from the analysis of the review changes is perceived as useful for project managers, and possibly software developers, to better understand the types of modifications done and achieve better insights on the code review process of the project. As such, despite our automatic approach has still some limitations when classifying functional changes, it represents the first step to put this kind of knowledge at the service of developers. On the one hand, our work has implications for practitioners: They can adopt our automated approach to improve their code review process rather than relying on time-consuming manual classification of code changes. On the other hand, our work contributes to the state of the art in code review research and opens new directions for researchers, who are called to further investigate code review practices and how to provide meaningful information to practitioners.
- Integrate automatic review changes classification into code review. :
-
To support the retrospective analysis of the code review process, we envision our approach to be integrated in a tool linked to the Gerrit repository of the project, which analyses it at constant intervals. The tool will display this information to developers and project managers. The results of RQ2.1 and RQ2.2 allowed us to collect some preliminary requirements that such a tool would need to fulfill. In particular, developers reported that (1) the tool should display the evolution of this information over time (i.e., number of changes per type in a specific time-frame), (2) the information displayed needs to be interactive, and (3) the tool needs to provide background information on each type of change.
Our machine-learning approach could also be employed at review-time, possibly integrated as a Gerrit plug-in, to display information on review changes directly in the Gerrit UI. We envision to extract the changes in the code to be reviewed, classify them, and visualize this information as warnings to the user. Each warning will be associated to each modification (or code chunk) to inform the user beforehand about the type of changes they will review. For both scenarios, it is fundamental that the devised tools are well-integrated into developers’ existing work-flow, as reported by previous findings (Sadowski et al. 2015; Sadowski et al. 2018).
- Further research on review changes is needed. :
-
One of the key results of our study relates to the use of information on review changes as an instrument to support review practices: as stated by developers involved in RQ2.1 and RQ2.2, the provided information represents a novelty and gives a new perspective on the internal mechanisms of the code review process. Moreover, some developers commented that these data were interesting and gave them a better idea on the types of changes on which they focus in their reviews. However, given the limitations of a static report, it was harder for developers to evaluate the data shown and transform them into actionable improvements of their code quality. Given the positive results, further work can be devoted to creating a tool that interactively displays review changes data, and deploys it with software projects in a longitudinal study, in which developers have the chance to test and learn how to use such a tool and get insights.
- Investigate the impact of review comments. :
-
Only approximately 33% of the review changes in our dataset were caused by a reviewer’s comment. Moreover, the same comment might have triggered multiple changes, but using the Gerrit API we could only link a comment to the change next to which it was placed during the review. This further reduced the number of modifications in our dataset linked to a comment. Overall, this did not allow us to employ more complex techniques to analyse the comments. Nonetheless, code review comments might constitute a promising source of information to improve the performance of our classification approach. For this reason, we believe future work should focus on the analysis of comments characteristics, possibly combining them with source code characteristics using code vectorizer techniques (e.g., code2vec). To apply this technique, a future study should address the current two limitations of our approach: (1) devise an approach to link a comment to all review changes that it caused and (2) increase the amount of triggered by review changes in the dataset.
8 Threats to validity
We discuss the threats to the validity of our study and the strategies we put in place to mitigate them.Construct Validity. In RQ1, the validity of our analyses might have been threatened by the correctness of the changes dataset that we created manually. The classification of changes could have been negatively impacted by the type of experience and subjectivity of the rater. To assess the extent of this threat, we computed the joint inter-rater agreement achieving a result of 90% for the categories and 75% for the types (as explained in Section 4.1). To further corroborate these results, we computed Krippendorff’s alpha coefficient obtaining a value of 0.447 for the categories and 0.673 for the types. As reported in Section 4.1, the alpha coefficient for the categories reveals only a moderate agreement between the two raters.
Krippendorff’s alpha takes into account the possibility that an agreement is reached just by randomly assigning a label. Therefore, dataset with significant unbalances between the number of elements per label are likely to achieve a low alpha coefficient. Unfortunately, this is an intrinsic property of the phenomenon under analysis: Previous research reported that the number of evolvability changes during code review is significantly higher than the number of functional changes (Beller et al. 2014; Mäntylä and Lassenius 2009). However, the moderate agreement reached computing Krippendorff’s alpha might still constitute a threat to the goodness of our dataset.
Another potential threat is related to the selection of the independent variables used to build our automated approach. We exploited a set of well-know features presented in previous work and covering different aspects of source code quality, understandability, and textual coherence (Buse and Weimer 2010; Palomba et al. May 2016; McCabe 1976). We cannot rule out that other metrics, not considered in the study, could provide additional contributions to the performance of the machine learning model.
In this study, we devised our own linking approach to connect related code chunks. However, other approaches (e.g., the one offered by java-diff-utilsFootnote 13) might have been valid alternatives. The use of a different approach might modify the performance of our classification approach. Future work can investigate this further.
To conduct semi-structured interviews in the context of RQ2.1, we first produced a field guide following well-established guidelines (Portigal 2013) to maximize the rigor of the study. Nevertheless, during their execution, interviewees may provide insights in different manners, e.g., by answering certain predefined questions while discussing others. For this reason, we adapted the interview schema based on the discussions we had with developers; at the same time, we made sure that all the predefined questions were addressed and asked further opinions in case these were not clear enough.Conclusion Validity. In RQ1, a first threat is related to the interpretation of the performance achieved by the approach. We mitigated this problem by considering more than one evaluation metric (e.g., F-measure, AUC-ROC, and MCC). Also concerning RQ1, previous work has shown the importance of considering data pre-processing actions to properly set machine learning models (Tantithamthavorn et al. 2018; Tantithamthavorn and Hassan 2018; Jiarpakdee et al. 2019; Pecorelli et al. 2019). For this reason, in our research we considered the application of techniques to deal with data normalization, feature selection, data balancing, and hyper-parameters configuration. In addition, the validation strategy may be object of discussion: according to a recent paper (Tantithamthavorn et al. 2016), the 10-fold cross-validation may bias the interpretation of the results, as it relies on random splitting of the data used to train and test the model. To mitigate the effect of randomness, we repeated the validation ten times and reported the mean performance coming from running the model multiple times.
Our dataset of review changes presents a significant unbalance between the number of evolvability and functional changes. This reflects the ratio of these two categories of changes in real world code reviews (Beller et al. 2014; Mäntylä and Lassenius 2009). Nonetheless, this unbalance in our data increases the risk for our model to suffer from overfitting. To mitigate this bias, we applied the following techniques: (1) We performed features selection, evaluating the contribution of each feature both in terms of gain ratio and Pearson’s correlation with the class to be predicted; (2) We oversampled the minority class using SMOTE, applying it only on the training set and never on the test set (following the best practices reported by Santos et al. (2018)); (3) We evaluated the performance of our model using 10-times 10-fold cross validation; (4) We tested our model using random forest, whose bagging feature reduces the chance of overfitting.
Code review is a process conducted in chronological order. The chronological nature of code review might have an effect on the performance of our classifier. We believe this is not a concern in our investigation since we do not rely on metrics that might be impacted by the chronological nature of code review and we treat each review modification independently. Nonetheless, we test the possible effect of the chronological order by comparing the performance achieved by our approach when evaluated using leave-one-out and using “chronological-ordered leave-one-out”. In the first approach, we iteratively use each modification in our dataset as a test set and train the model using all other modifications. We randomize the modifications in our dataset to control for any chronological effect on the performance. In the “chronological-ordered leave-one-out” approach, we ordered each modification using the timestamp associated to the revision from which it was extracted. We begin our evaluation by using half of the ordered modifications as training set and the next ordered modification as test set. Then, we add this modification to the training set and we select the next one as test set. We proceed iteratively until no modifications are left. Comparing the performance of the two approaches, we do not notice any significant difference. This result seems to confirm that the performance of our classifier is not influenced by the temporal nature of code review.
In RQ2.1 to reduce the subjectivity of the evaluation of the interview data, first one of the authors did the analysis, then a second double-checked the results. In RQ2.2, we assessed the developers’ opinions on the generated report by also relying on open questions. To reduce subjectivity, two authors conducted the analysis of the answers.External Validity. Concerning the generalizability of the results, our study considers three open-source projects. Although we considered projects that (1) come from different domains, (2) have different size as well as number of contributors, and (3) have a different organization structure, we cannot confirm that the results we achieved with our automated approach will hold in other systems, for example using other programming languages and in a closed-source setting. In the context of RQ2.1, only one female developer participated in the semi-structured interviews. Previous works found that gender might influence how people approach the solution of problems (Beckwith et al. 2006; Burnett et al. 2011). Therefore, we can not completely exclude that this factor might have influenced the collected answers.
Participants’ answers in RQ2.1 might have been influenced by moderator acceptance bias. To mitigate this issue, we emphasized to participants the preliminary nature of our investigation: Our aim was not to collect information on a tool we created but simply to understand the potential use and importance of information on review changes. Participants were not made aware of the approach developed in the context of our RQ1. Moreover, we clarified to the interviewees how the tool UI views shown in the interview slides were only meant as examples of applications of this kind of information in practice and did not represent the UI of an existing tool.
We received 17 answers when inquiring developers in RQ2.2. In this respect, we targeted original developers with the aim of gathering insights from people who are expert in the code review processes analyzed. As such, the audience of our study was limited by nature.
9 Conclusion
We presented a study that evaluates the classification of review changes as a mean to support developers. The study first addresses the scalability issues of previously proposed approaches, caused by their manual nature, investigating and evaluating a machine learning-based technique capable of automatically classifying review changes. To achieve this goal, the designed approach works using changes types and categories, based on the taxonomy proposed by previous studies (Beller et al. 2014; Mäntylä and Lassenius 2009; Kaner et al. 2000). Our best configuration achieved an AUC-ROC of 0.91 in classifying the changes categories (evolvability and functional) and an AUC-ROC between 0.91 and 0.95 for the detection of the four changes groups, obtained further refining the two main categories.
Then, we explored the use of information on review changes with twelve developers using semi-structured interviews. Participants provided positive feedback and ideas for refinement, confirming the goodness of our investigation and opening interesting directions for future work.
Finally, the relevance of review changes data for practitioners was evaluated by generating reports for 20 different open source projects, which were assessed by 17 core developers. The answers to our report confirmed the novelty of the displayed information on review changes: the respondents declared of not being aware of any tool providing the same information. Furthermore, they confirmed managers as the main potential target.
Overall, the results of our investigation give clear indication that using information on review changes to assess and improve current review practices is feasible and well perceived by developers.
Notes
online replication package: https://doi.org/10.5281/zenodo.5592254
online replication package: https://doi.org/10.5281/zenodo.5592254
Gerrit Code Review: https://www.gerritcodereview.com
Java Gerrit REST API: https://github.com/uwolfer/gerrit-rest-java-client
online replication package: https://doi.org/10.5281/zenodo.5592254
SMOTE class in the WEKA JAVA API: https://weka.sourceforge.io/doc.packages/SMOTE/weka/fiters/supervised/instance/SMOTE.html
online replication package: https://doi.org/10.5281/zenodo.5592254
GitHub: https://github.com
Java implementation of Gerrit API: https://github.com/uwolfer/gerrit-rest-java-client
online replication package: https://doi.org/10.5281/zenodo.5592254
References
Crucible official website (2019) https://www.atlassian.com/software/crucible
Gerrit Code Review (2019) https://www.gerritcodereview.com
GitHub official website (2019) https://github.com
About qt (2019) https://wiki.qt.io/About_Qt
Abelein U, Paech B (2015) Understanding the influence of user participation and involvement on system success–a systematic mapping study. Empir Softw Eng 20(1):28–81
Android (2020) Android gerrit online repository https://git.eclipse.org/r/q/status:open+-is:wip
Arlot S, Celisse A, et al. (2010) A survey of cross-validation procedures for model selection. Statistics Surveys 4:40–79
Bacchelli A, Bird C (2013) Expectations, outcomes, and challenges of modern code review. In: Proceedings of the 2013 international conference on software engineering, ICSE ’13. ISBN 978-1-4673-3076-3, https://doi.org/10.1109/ICSE.2013.6606617. IEEE Press, Piscataway, pp 712–721
Baeza-Yates R, Ribeiro-Neto B, et al. (1999) Modern Information Retrieval, vol 463. ACM Press, New York
Ball T, Kim J-M, Porter AA, Siy HP (1997) If your version control system could talk. In: ICSE Workshop on process modelling and empirical studies of software engineering, vol 11
Baum T, Liskin O, Niklas K, Schneider K (2016) A faceted classification scheme for change-based industrial code review processes. In: 2016 IEEE International conference on software quality, reliability and security (QRS), pp 74–85
Baum T, Leßmann H, Schneider K (2017) The choice of code review process: A survey on the state of the practice. In: Product-focused software process improvement. ISBN 978-3-319-69926-4. Springer International Publishing, Cham, pp 111–127
Baum T, Schneider K, Bacchelli A (2019) Associating working memory capacity and code change ordering with code review performance. Empirical Software Engineering, pp 1–37
Bavota G, Russo B (2015) Four eyes are better than two: on the impact of code reviews on software quality. In: 2015 IEEE International conference on software maintenance and evolution (ICSME), IEEE, pp 81–90
Baysal O, Kononenko O, Holmes R, Godfrey MW (2016) Investigating technical and non-technical factors influencing modern code review. Empir Softw Eng 21(3):932–959
Beckwith L, Kissinger C, Burnett M, Wiedenbeck S, Lawrance J, Blackwell A, Cook C (2006) Tinkering and gender in end-user programmers’ debugging. In: Proceedings of the SIGCHI conference on Human Factors in computing systems, pp 231–240
Beller M, Bacchelli A, Zaidman A, Juergens E (2014) Modern code reviews in open-source projects: Which problems do they fix?. In: Proceedings of the 11th working conference on mining software repositories, MSR 2014. ISBN 978-1-4503-2863-0. https://doi.org/10.1145/2597073.2597082. ACM, New York, pp 202–211
Bettenburg N, Just S, Schröter A., Weiss C, Premraj R, Zimmermann T (2008) What makes a good bug report?. In: Proceedings of the 16th ACM SIGSOFT international symposium on foundations of software engineering, pp 308–318
Bird C, Carnahan T, Greiler M (2015) Lessons learned from building and deploying a code review analytics platform. In: 2015 IEEE/ACM 12Th working conference on mining software repositories, IEEE, pp 191–201
Bishop CM (2006) Pattern recognition and machine learning. Springer
Bosu A, Carver JC (2014) Impact of developer reputation on code review outcomes in oss projects: an empirical investigation. In: Proceedings of the 8th ACM/IEEE international symposium on empirical software engineering and measurement, ACM, pp 33
Burnett MM, Beckwith L, Wiedenbeck S, Fleming SD, Cao J, Park TH, Grigoreanu V, Rector K (2011) Gender pluralism in problem-solving software. Interacting with Computers 23(5):450–460
Buse RPL, Weimer WR (2010) Learning a metric for code readability. IEEE Trans Softw Eng 36(4):546–558. ISSN 0098-5589. https://doi.org/10.1109/TSE.2009.70
Chandrashekar G, Sahin F (2014) A survey on feature selection methods. Computers & Electrical Engineering 40(1):16–28
Chawla NV, Bowyer KW, Hall LO, Kegelmeyer WP (2002) Smote: synthetic minority over-sampling technique. Journal of Artificial Intelligence Research 16:321–357
Couchbase (2020) Couchbase gerrit online repository http://review.couchbase.org/q/status:open
Czerwonka J, Greiler M, Tilford J (2015) Code reviews do not find bugs: how the current code review best practice slows us down. In: Proceedings of the 37th international conference on software engineering, Vol 2, IEEE Press, pp 27–28
Di Penta M, Cerulo L, Aversano L (2009) The life and death of statically detected vulnerabilities: an empirical study. Inf Softw Technol 51(10):1469–1484
Domingos PM (2012) A few useful things to know about machine learning. Commun Acm 55(10):78–87
Eclipse (2020) Eclipse gerrit online repository https://git.eclipse.org/r/q/status:open+-is:wip
Elkan C (2001) The foundations of cost-sensitive learning. In: International joint conference on artificial intelligence, vol 17, Lawrence Erlbaum Associates ltd, pp 973–978
Fagan M (2002) Design and code inspections to reduce errors in program development. In: Software pioneers, Springer, pp 575–607
Fink A (2003) How to design survey studies. Sage
Fluri B, Wuersch M, Pinzger M, Gall H (2007) Change distilling: Tree differencing for fine-grained source code change extraction. IEEE Trans Softw Eng 33(11):725–743
Fregnan E, Petrulio F, Di Geronimo L, Bacchelli A (2020) What happens in my code reviews? replication package. https://doi.org/10.5281/zenodo.5592254
Gata W, Grand G, Fatmasari R, Baharuddin B, Patras YE, Hidayat R, Tohari S, Wardhani NK (2019) Prediction of teachers’ lateness factors coming to school using c4. 5, random tree, random forest algorithm. In: 2Nd international conference on research of educational administration and management (ICREAM 2018), Atlantis Press, pp 161–166
Giger E, D’Ambros M, Pinzger M, Gall HC (2012) Method-level bug prediction. In: Proceedings of the 2012 ACM-IEEE international symposium on empirical software engineering and measurement, IEEE, pp 171–180
Hall M, Frank E, Holmes G, Pfahringer B, Reutemann P, Witten IH (2009) The weka data mining software: an update. ACM SIGKDD Explorations Newsletter 11(1):10–18
Hall MA (1999) Correlation-based feature selection for machine learning
Jiarpakdee J, Tantithamthavorn C, Hassan AE (2019) The impact of correlated metrics on the interpretation of defect models. IEEE Transactions on Software Engineering
Johnson B, Song Y, Murphy-Hill E, Bowdidge R (2013) Why don’t software developers use static analysis tools to find bugs? In: Proceedings of the 2013 international conference on software engineering, IEEE Press, pp 672–681
Johnson RB, Onwuegbuzie AJ (2004) Mixed methods research: a research paradigm whose time has come. Educational Researcher 33(7):14–26
Kamei Y, Matsumoto S, Monden A, Matsumoto K-i, Adams B, Hassan AE (2010) Revisiting common bug prediction findings using effort-aware models. In: 2010 IEEE International conference on software maintenance, IEEE, pp 1–10
Kaner C, Falk J, Nguyen HQ (2000) Testing computer software. 2nd edn, Dreamtech press
Karegowda AG, Manjunath A, Jayaram M (2010) Comparative study of attribute selection using gain ratio and correlation based feature selection. International Journal of Information Technology and Knowledge Management 2(2):271–277
Kemerer CF, Paulk MC (2009) The impact of design and code reviews on software quality: an empirical study based on psp data. IEEE Trans Softw Eng 35 (4):534–550
Kononenko O, Baysal O, Guerrouj L, Cao Y, Godfrey MW (2015) Investigating code review quality: Do people and participation matter? In: 2015 IEEE international conference on software maintenance and evolution (ICSME)
Kotsiantis S, Kanellopoulos D, Pintelas P (2006) Data preprocessing for supervised leaning. Int J Comput Sci 1(2):111–117
Kovalenko V, Tintarev N, Pasynkov E, Bird C, Bacchelli A (2020) Does reviewer recommendation help developers?. IEEE Trans Softw Eng 46(7):710–731. https://doi.org/10.1109/TSE.2018.2868367
Krawczyk B (2016) Learning from imbalanced data: open challenges and future directions. Progress in Artif Intell 5(4):221–232
Krippendorff K (2011) Computing krippendorff’s alpha-reliability
Kumar L, Satapathy SM, Murthy LB (2019) Method level refactoring prediction on five open source java projects using machine learning techniques. In: Proceedings of the 12th innovations on software engineering conference (formerly known as India Software Engineering Conference), pp 1–10
Lessmann S, Baesens B, Mues C, Pietsch S (2008) Benchmarking classification models for software defect prediction: a proposed framework and novel findings. IEEE Trans Softw Eng 34(4):485–496
Likert R (1932) A technique for the measurement of attitudes. Archives of psychology
Longhurst R (2003) Semi-structured interviews and focus groups. Key Methods in Geography 3:143–156
Lyons EE, Coyle AE (2007) Analysing qualitative data in psychology. Sage Publications Ltd
Mahboob T, Irfan S, Karamat A (2016) A machine learning approach for student assessment in e-learning using quinlan’s c4. 5, naive bayes and random forest algorithms. In: 2016 19Th international multi-topic conference (INMIC), IEEE, pp 1–8
Mäntylä MV, Lassenius C (2009) What types of defects are really discovered in code reviews?. IEEE Transactions on Software Engineering 35(3):430–448. ISSN 0098-5589. https://doi.org/10.1109/TSE.2008.71
McCabe TJ (1976) A complexity measure. IEEE Transactions on software Engineering 4:308–320
McIntosh S, Kamei Y, Adams B, Hassan AE (2014) The impact of code review coverage and code review participation on software quality: a case study of the qt, vtk, and itk projects. In: Proceedings of the 11th working conference on mining software repositories, ACM, pp 192–201
McIntosh S, Kamei Y, Adams B, Hassan AE (2016) An empirical study of the impact of modern code review practices on software quality. Empir Softw Eng 21(5):2146–2189
Morales R, McIntosh S, Khomh F (2015) Do code review practices impact design quality? a case study of the qt, vtk, and itk projects. In: 2015 IEEE 22Nd international conference on software analysis, evolution, and reengineering (SANER), IEEE, pp 171–180
Newcomer KE, Hatry HP, Wholey JS (2015) Conducting semi-structured interviews. Handbook of practical program evaluation, 492
Ouni A, Kula RG, Inoue K (2016) Search-based peer reviewers recommendation in modern code review. In: 2016 IEEE International conference on software maintenance and evolution (ICSME), IEEE, pp 367–377
Paixao M, Krinke J, Han D, Harman M (2018) Crop: Linking code reviews to source code changes. In: 2018 IEEE/ACM 15Th international conference on mining software repositories (MSR), pp 46–49
Palomba F, Panichella A, De Lucia A, Oliveto R, Zaidman A (May 2016) A textual-based technique for smell detection. In: 2016 IEEE 24Th international conference on program comprehension (ICPC), pp 1–10
Pantiuchina J, Bavota G, Tufano M, Poshyvanyk D (2018) Towards just-in-time refactoring recommenders. In: 2018 IEEE/ACM 26Th international conference on program comprehension (ICPC), IEEE, pp 312–3123
Pascarella L, Spadini D, Palomba F, Bruntink M, Bacchelli A (2018) Information needs in contemporary code review. Proc ACM Hum-Comput Interact 2(CSCW):135:1–135:27. ISSN 2573-0142. https://doi.org/10.1145/3274404
Pecorelli F, Palomba F, Di Nucci D, De Lucia A (2019) Comparing heuristic and machine learning approaches for metric-based code smell detection. In: Proceedings of the 27th international conference on program comprehension, IEEE Press, pp 93–104
Porter A, Siy H, Votta L (1996) A review of software inspections. volume 42 of Advances in Computers, pp 39–76. Elsevier
Porter A, Siy H, Mockus A, Votta L (1998) Understanding the sources of variation in software inspections. ACM Trans Softw Eng Methodol (TOSEM) 7(1):41–79
Porter MF (1997) Readings in information retrieval. chapter An Algorithm for Suffix Stripping. Morgan Kaufmann Publishers Inc., San Francisco, pp 313–316. ISBN 1-55860-454-5. http://dl.acm.org/citation.cfm?id=275537.275705
Portigal S (2013) Interviewing users: how to uncover compelling insights. Rosenfeld Media
Ram A, Sawant AA, Castelluccio M, Bacchelli A (2018) What makes a code change easier to review: An empirical investigation on code change reviewability. In: Proceedings of the 2018 26th ACM joint meeting on european software engineering conference and symposium on the foundations of software engineering, ESEC/FSE 2018, New York, ACM, pp 201–212, ISBN 978-1-4503-5573-5. https://doi.org/10.1145/3236024.3236080
Reich Y, Barai S (1999) Evaluating machine learning models for engineering problems. Artif Intell Eng 13(3):257–272
Rigby PC, Bird C (2013) Convergent contemporary software peer review practices. In: Proceedings of the 2013 9th joint meeting on foundations of software engineering, ACM, pp 202–212
Rigby PC, German DM, Cowen L, Storey M-A (2014) Peer review on open-source software projects: Parameters, statistical models, and theory. ACM Trans Softw Eng Methodol (TOSEM) 23(4):35
Sadowski C, Van Gogh J, Jaspan C, Soderberg E, Winter C (2015) Tricorder: Building a program analysis ecosystem. In: 2015 IEEE/ACM 37Th IEEE international conference on software engineering, vol 1, IEEE, pp 598–608
Sadowski C, Aftandilian E, Eagle A, Miller-Cushon L, Jaspan C (2018) Lessons from building static analysis tools at google. Commun ACM 61 (4):58–66
Santos MS, Soares JP, Abreu PH, Araujo H, Santos J (2018) Cross-validation for imbalanced datasets: Avoiding overoptimistic and overfitting approaches [research frontier]. IEEE Comput Intell Mag 13(4):59–76
Sauer C, Jeffery DR, Land L, Yetton P (2000) The effectiveness of software development technical reviews: a behaviorally motivated program of research. IEEE Trans Softw Eng 26(1):1–14
Shibuya B, Tamai T (2009) Understanding the process of participating in open source communities. In: Proceedings of the 2009 ICSE workshop on emerging trends in Free/Libre/Open source software research and development, IEEE Computer Society, pp 1–6
Spadini D, Aniche M, Storey M-A, Bruntink M, Bacchelli A (2018) When testing meets code review: Why and how developers review tests. In: 2018 IEEE/ACM 40Th international conference on software engineering (ICSE), IEEE, pp 677–687
Spadini D, Palomba F, Baum T, Hanenberg S, Bruntink M, Bacchelli A (2019) Test-driven code review: an empirical study. In: Proceedings of the 41st international conference on software engineering, IEEE Press, pp 1061–1072
Strüder S, Mukelabai M, Strüber D, Berger T (2020) Feature-oriented defect prediction. In: Proceedings of the 24th ACM conference on systems and software product line: Volume A-Volume A, pp 1–12
Tantithamthavorn C, Hassan AE (2018) An experience report on defect modelling in practice: Pitfalls and challenges. In: Proceedings of the 40th international conference on software engineering: software engineering in practice, ACM, pp 286–295
Tantithamthavorn C, McIntosh S, Hassan AE, Matsumoto K (2016) An empirical comparison of model validation techniques for defect prediction models. IEEE Trans Softw Eng 43(1):1–18
Tantithamthavorn C, McIntosh S, Hassan AE, Matsumoto K (2018) The impact of automated parameter optimization on defect prediction models. IEEE Transactions on Software Engineering
Thongtanunam P, McIntosh S, Hassan AE, Iida H (2015a) Investigating code review practices in defective files: an empirical study of the qt system. In: Proceedings of the 12th working conference on mining software repositories, IEEE Press, pp 168–179
Thongtanunam P, Tantithamthavorn C, Kula RG, Yoshida N, Iida H, Matsumoto K. -i. (2015b) Who should review my code? a file location-based code-reviewer recommendation approach for modern code review. In: 2015 IEEE 22Nd international conference on software analysis, evolution, and reengineering (SANER), IEEE, pp 141–150
Thongtanunam P, McIntosh S, Hassan AE, Iida H (2016) Revisiting code ownership and its relationship with software quality in the scope of modern code review. In: Proceedings of the 38th international conference on software engineering, ACM, pp 1039–1050
Vassallo C, Panichella S, Palomba F, Proksch S, Zaidman A, Gall HC (2018) Context is king: the developer perspective on the usage of static analysis tools. In: 2018 IEEE 25Th international conference on software analysis, evolution and reengineering (SANER), IEEE, pp 38–49
Vassallo C, Panichella S, Palomba F, Proksch S, Gall HC, Zaidman A (2019a) How developers engage with static analysis tools in different contexts. Empirical Software Engineering
Vassallo C, Proksch S, Gall HC, Di Penta M (2019a) Automated reporting of anti-patterns and decay in continuous integration. In: 2019 IEEE/ACM 41st International Conference on Software Engineering (ICSE), IEEE, pp 105–115
Wiegers K (2002) Peer Reviews in Software: A Practical Guide. Addison-Wesley Longman Publishing Co., Inc., Boston. ISBN 0-201-73485-0
Wolf T, Schroter A, Damian D, Nguyen T (2009) Predicting build failures using social network analysis on developer communication. In: 2009 IEEE 31St international conference on software engineering, IEEE, pp 1–11
Yujian L, Bo L (2007) A normalized levenshtein distance metric. IEEE Trans Pattern Anal Mach Intell 29(6):1091–1095. ISSN 0162-8828. https://doi.org/10.1109/TPAMI.2007.1078
Zanjani MB, Kagdi H, Bird C (2015) Automatically recommending peer reviewers in modern code review. IEEE Trans Softw Eng 42(6):530–543
Acknowledgment
The authors would like to thank the anonymous reviewers for their thoughtful and important comments and gratefully acknowledge the support of the Swiss National Science Foundation through the SNF Projects No. PP00P2_170529.
Funding
Open access funding provided by University of Zurich.
Author information
Authors and Affiliations
Corresponding author
Additional information
Communicated by: Emerson Murphy-Hill
Publisher’s note
Springer Nature remains neutral with regard to jurisdictional claims in published maps and institutional affiliations.
Rights and permissions
Open Access This article is licensed under a Creative Commons Attribution 4.0 International License, which permits use, sharing, adaptation, distribution and reproduction in any medium or format, as long as you give appropriate credit to the original author(s) and the source, provide a link to the Creative Commons licence, and indicate if changes were made. The images or other third party material in this article are included in the article's Creative Commons licence, unless indicated otherwise in a credit line to the material. If material is not included in the article's Creative Commons licence and your intended use is not permitted by statutory regulation or exceeds the permitted use, you will need to obtain permission directly from the copyright holder. To view a copy of this licence, visit http://creativecommons.org/licenses/by/4.0/.
About this article

Cite this article
Fregnan, E., Petrulio, F., Di Geronimo, L. et al. What happens in my code reviews? An investigation on automatically classifying review changes. Empir Software Eng 27, 89 (2022). https://doi.org/10.1007/s10664-021-10075-5
Accepted:
Published:
DOI: https://doi.org/10.1007/s10664-021-10075-5