
Abstract
The nine Bradford Hill (BH) viewpoints (sometimes referred to as criteria) are commonly used to assess causality within epidemiology. However, causal thinking has since developed, with three of the most prominent approaches implicitly or explicitly building on the potential outcomes framework: directed acyclic graphs (DAGs), sufficient-component cause models (SCC models, also referred to as ‘causal pies’) and the grading of recommendations, assessment, development and evaluation (GRADE) methodology. This paper explores how these approaches relate to BH’s viewpoints and considers implications for improving causal assessment. We mapped the three approaches above against each BH viewpoint. We found overlap across the approaches and BH viewpoints, underscoring BH viewpoints’ enduring importance. Mapping the approaches helped elucidate the theoretical underpinning of each viewpoint and articulate the conditions when the viewpoint would be relevant. Our comparisons identified commonality on four viewpoints: strength of association (including analysis of plausible confounding); temporality; plausibility (encoded by DAGs or SCC models to articulate mediation and interaction, respectively); and experiments (including implications of study design on exchangeability). Consistency may be more usefully operationalised by considering an effect size’s transportability to a different population or unexplained inconsistency in effect sizes (statistical heterogeneity). Because specificity rarely occurs, falsification exposures or outcomes (i.e., negative controls) may be more useful. The presence of a dose-response relationship may be less than widely perceived as it can easily arise from confounding. We found limited utility for coherence and analogy. This study highlights a need for greater clarity on BH viewpoints to improve causal assessment.
Introduction
Causal assessment is fundamental to epidemiology as it may inform policy and practice to improve population health. A leading figure in epidemiology, Sir Austin Bradford Hill, suggested the goal of causal assessment is to understand if there is “any other way of explaining the set of facts before us … any other answer equally, or more, likely than cause and effect” [1]. Causal assessment may be applied to a body of evidence or a single study to interrogate the “set of facts” underlying a relationship. Bradford Hill notably laid out a set of such facts. Although commonly described as Bradford Hill criteria, he described them as ‘viewpoints’ and emphasised they should not be used as a checklist, but as considerations for assessing causality. As a result, we refer to them as ‘BH viewpoints’ [2].
Since Bradford Hill first introduced his viewpoints, causal thinking in epidemiology has increasingly incorporated the potential outcomes framework [3,4,5,6,7,8]. Informally, the potential outcomes framework posits that a true causal effect is the difference between the observed outcome when the individual was exposed and the unobserved potential outcome had the individual not been exposed, all other things being equal [6]. Because the unobserved potential outcome of an individual cannot be known, investigators often compare the outcomes of exposed and unexposed groups [6]. Application of the potential outcomes framework asks investigators to consider exchangeability between these groups i.e., if the unexposed group would have the same risk of the outcome as the exposed group had they also been exposed [6]. In practice, this means considering if groups are comparable. Investigators may be more confident that the observed effect equals the true causal effect if the groups are exchangeable [9].
We focus on three approaches that implicitly or explicitly incorporate the potential outcomes framework but operationalise it differently [4, 10,11,12]. Firstly, directed acyclic graphs (DAGs) help articulate assumptions about the interrelationships between variables of interest and therefore threats to valid causal inference. Sufficient-component cause (SCC) models highlight the multi-factorial nature of causality, drawing attention to how different exposures interact to produce the outcome. Finally, the Grading of Recommendations, Assessment, Development and Evaluation (GRADE) methodology provides a systematic approach to assessing the certainty of a causal relationship based on a body of evidence (i.e., the existing studies available used to assess whether a causal relationship between an exposure and outcome exists). Epidemiologists have proposed that causal assessment may be improved by combining approaches such as these [7, 13,14,15].
To draw on the strengths of each of these potential outcomes framework approaches, we compared the extent to which they overlap or complement each other. There is limited literature comparing the potential outcomes framework in SCC models and DAGs [4, 5, 11] and one study comparing BH viewpoints to GRADE [10]. While BH viewpoints have been revisited to critically reflect on the theory and application of each viewpoint [2, 16,17,18,19,20], we have not identified any attempts to compare it to DAGs and SCC models, with the former particularly important given the growing influence of DAGs in epidemiology [21].
Our main aims are to examine: 1) if and how each BH viewpoint is considered by each of the three potential outcomes framework approaches (referred to simply as ‘approaches’ hereafter); and 2) the extent they elucidate the underpinning theory of BH viewpoints. BH viewpoints serve as the foundation for this comparison because of its influential status within epidemiology [19, 20, 22]. Additionally, there is agreement in the literature that the BH viewpoints account for the most relevant considerations in causal assessment [17]. To facilitate comparisons, we drew DAGs and SCC models for each BH viewpoint and mapped each BH viewpoint against each GRADE domain. We use the example of alcohol consumption and active-tuberculosis where relevant to illustrate the elements of each approach. Mycobacterium tuberculosis (MTB) is the bacterium responsible for tuberculosis (TB). MTB causes latent-TB, which can turn into active-TB in individuals with low immunity [23]. Alcohol consumption is hypothesised to cause a weaker immune system, resulting in active-TB [24]. The example is purposefully simplified and may not reflect real-world scenarios.
In the next section, we summarise the BH viewpoints and key characteristics of the three approaches they are being compared against. Our aim is to introduce the commonalities and distinctions within these approaches as approaches to causal inference, rather than to provide a detailed explanation or critical assessment of each approach. Following this, we compare each of the nine BH viewpoints against the three approaches and critically reflect on the theoretical implications for assessing causal relationships. We finish by summarising our key findings, make tentative suggestions about how causal assessment could be conducted in the future and note some areas for future research.
Causal assessment approaches
Bradford Hill viewpoints
Bradford Hill’s explanation of the nine viewpoints is summarised in Table 1. These were not intended to be “hard and fast rules of evidence that must be obeyed before we accept cause and effect,” but characteristics to keep in mind while considering if an observed association is due to something other than causality [1]. In current practice, BH viewpoints are applied together or separately to a body of evidence or a single empirical study.
Directed acyclic graphs
DAGs are diagrams that illustrate the putative causal relationship between an exposure and outcome [6]. DAGs include the variables that might bias the relationship in question and their development is based on background knowledge of the topic [25]. Detailed explanations of DAGs can be found elsewhere [5, 6, 25,26,27]. DAGs are commonly applied to a single study, but it has been proposed that they can be applied to a body of evidence [62].
The simplified DAG below (Fig. 1) shows the pathway between the exposure and outcome, alcohol consumption and active-TB, respectively. Alcohol consumption may result in active-TB, for example, by lowering an individual’s immune system (mediator not shown) [23]. Overcrowding is a confounding variable, causing both alcohol consumption and active-TB. If there was no causal effect of alcohol consumption on active-TB (i.e. no edge between those two variables in the DAG), an association would still be observed between them in the data due to the common cause overcrowding [4, 25, 28, 29]. Thus, overcrowding must be conditioned upon, indicated by a square around the variable, to obtain an unbiased estimate of alcohol consumption on active-TB. If investigators condition on the appropriate variables using a DAG that accurately represents a causal relationship, they may be more confident of exchangeability and thus estimating the true causal effect [9, 30].

Directed acyclic graph representing relationship between alcohol consumption and active-TB. The confounding variable, overcrowding, effects both the exposure and outcome and should be conditioned on, as indicated by the bold square around overcrowding
Sufficient-component cause (SCC) models
SCC models (also known as causal pies) illustrate the multi-factorial nature of causality through pie charts [31]. SCC models view each of the variables that contribute to the outcome occurring as causal components [32], with many different combinations of components potentially bringing about the outcome of interest. Taken together, the components for each ‘complete pie’ are sufficient to produce the outcome. Necessary components are those without which the outcome could not occur [33]. For example, MTB is a necessary (but insufficient) component of tuberculosis and will therefore be a component for all of the causal pies for tuberculosis (but never features as a sole component of a causal pie). The origins of SCC models can be traced to Mackie’s definition of causality. This introduced the idea of INUS causation, that is a cause can be “an insufficient but necessary part of a condition which is itself unnecessary but sufficient for the result” [34] p. 45.
Causal pies are useful for understanding causal mechanisms and interactions of causal components [33]. Table 2 illustrates four pies (S1, S2, S3, S4) for two different populations (population 1 and population 2) which represent the possible combination of selected causal components (alcohol, overcrowding and unknown factors) for the development of active TB.
GRADE methodology
GRADE is the most widely adopted approach for assessing certainty of evidence in systematic reviews, guideline development and evidence-informed recommendations [35]. Certainty has been defined by the GRADE Working Group as the “extent of our confidence that the estimates of the effect are correct” [10, 36,37,38]. Certainty is based both on assessing the risk of bias of individual studies and an evaluation across studies [35]. GRADE typically considers evidence from randomised controlled trials (RCTs) as providing a higher level of certainty than evidence from nonrandomised studies (NRSs), although the appropriateness of this has been critiqued [39]. Certainty may be modified according to different GRADE domains (summarised in Table 3). Large associations, dose-response relationships and adjusting for plausible confounding upgrade certainty.
Comparisons against Bradford Hill’s viewpoints
Table 4 summarises the overlapping elements between BH viewpoints and the potential outcomes framework approaches, with subsequent text providing additional detail.
Strength of association
Bradford Hill argued that a large association suggests the observed effect is less likely to be due to bias [1, 40], but he acknowledged that weak (or small) associations may still reflect causal relationships. As noted by Greenland and Robins, large associations can still arise from confounding and a weak association does not mean there is an absence of causality[33]. In practice, investigators may rely on existing tools and guidelines, or their own interpretation, to determine what constitutes a strong association.
Although DAGs cannot represent the size of an association, they facilitate “bias analysis” (see Fig. 1) [14]. Investigators may use DAGs to highlight important variables that they were unable to condition on and consider their implications for the effect estimate, including residual confounding (from inaccurately or poorly measured variables, including confounders) [41].
SCC models draw attention to the impact of disease prevalence and the prevalence of competing causes on the strenth of association or effect estimate. For example, the RR of S3 is attenuated as the prevalence of a competing sufficient cause (S4) or the prevalence of the outcome in the reference group (S1) increases (see Table 2).
According to the GRADE Working Group, a strong association is indicated by a risk ratio (RR) of 2–5 or 0.2–0.5 [17, 17, 17]. Evidence from NRSs that estimate a large effect will be upgraded on the basis that confounding is less likely to entirely remove the observed association [43].
Consistency
Bradford Hill argued that consistent estimates observed in different circumstances reduce the likelihood that the effect is due to chance or bias [1]. Comparison with the three approaches demonstrate that differences in effect size across studies which may be due to variations in causal structures, variable interactions, or biases of the relevant studies.
Transportability refers to the extent to which a causal effect in one context can be used to infer a causal effect in different circumstances, such as different populations or study designs [44]. Investigators can use DAGs to understand how differences in causal structures may explain different observed effect sizes. For example, investigators may want to understand if the causal effect of alcohol consumption on active-TB can be extrapolated to a target population with a high baseline risk of HIV (represented in Fig. 2). In other words, to understand if the different effect size in the target population is due to HIV modifying the effect of alcohol consumption on active-TB by reducing immunity [45, 46]. To represent the target population’s exposure to a stratum of HIV (i.e., a higher risk of HIV), there is a square around HIV [44, 46]. If the likelihood of active-TB for a given level of alcohol consumption is equivalent between the populations, the estimated effect of alcohol on active-TB is transportable and any statistical heterogeneity observed is likely due to HIV risk modifying the effect of alcohol on active-TB[46].
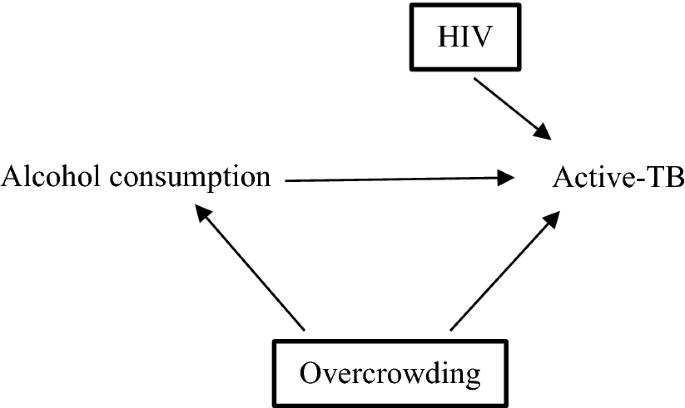
modified by the higher risk of HIV. This needs to be considered when comparing the effect estimates between this target population and the one described in Fig. 1 with low risk of HIV
Directed acyclic graph (DAG) of target population with high baseline risk of HIV. The high baseline risk of HIV means that HIV has been conditioned upon, indicated by square around HIV. The estimated effect of alcohol consumption on active-TB in this population will be
Investigators can use SCC models to understand differences in variable interactions and if that can explain different observed effect sizes observed between populations [44, 47,48,49]. For example, investigators may want to understand if the RR of individuals in population 1 in Table 2 can be transported to population 2. According to Table 2, the RR of active-TB when individuals are exposed only to overcrowding (S3) is lower in population 2 than population 1. i.e., the effect of overcrowding on active-TB differs between populations when alcohol is not consumed. It may be that the unknown factors of S3 differ between populations. However, because the RRs are the same for other causal pies, investigators may assume that the reason for different prevalence and RRs for S3 is that unknown factors and overcrowding are interacting differently between the populations, in which case the effect sizes cannot be transported from population 1 to population 2.
In GRADE, unexplained inconsistency (typically, statistical heterogeneity) suggests lower confidence about the likely effect of the exposure under different circumstances. GRADE considers unexplained inconsistency rather than consistent effect estimates, as Bradford Hill suggested, to highlight that consistent estimates in different circumstances may be subject to the same bias and do not necessarily increase confidence in causality [50].
Specificity
According to Bradford Hill, a relationship is specific if the exposure is associated with the outcome in question and no others, and if the outcome is associated with the exposure in question and no others. He emphasised that a non-specific relationship does not undermine causality. Specificity originated in Robert Koch’s postulates to evaluate causality in infectious diseases, but is rare in epidemiology and usually arises when the outcome is defined based on the exposure status (e.g., tuberculosis being defined by the presence of the tubercle bacillus) [17, 51, 52]. Comparisons highlighted how multiple causation (where one exposure may affect many outcomes and one outcome may be effected by many exposures) limits the utility of directly applying specificity in epidemiological practice, but extending the concept to the related idea of ‘falsification’ may improve its usefulness.
The DAG in Fig. 1 illustrates a non-specific relationship as active-TB is caused by at least two exposures: alcohol-consumption and overcrowding [53]. The relationship is also non-specific because alcohol consumption may cause many other outcomes such as cancer, cardiovascular disease and injuries [54]. This is not shown in the DAG in Fig. 1 because DAGs typically include the main variables related to the relationship of interest (i.e., an exposure, outcome and any potential confounders) [55]. This is also the reason why DAGs are not used to demonstrate specific relationships; a variable may be left out of a DAG because it is not of interest, not because the relationship illustrated in the DAG is specific.
One important reason for specificity is multiple causation suggests a higher likelihood that the observed association is due to confounding. Rather than seeking evidence of specificity, DAGs can be used to help identify and assess falsification (or negative control) outcomes and exposures. A falsification outcome is expected to be both independent of the outcome and associated with the exposure only through the confounding variable [56]. If investigators accurately condition on the confounding variable, they would not observe an effect of the exposure on the falsification outcome.
A hypothetical falsification outcome is head lice (Fig. 3). Alcohol consumption does not have a causal effect on head lice. If investigators observe an effect of alcohol consumption on head lice despite conditioning upon overcrowding, this is likely due to residual confounding due to overcrowding being inaccurately measured. Therefore, it is possible that the relationship between alcohol and active-TB is also subject to residual confounding of overcrowding and investigators should adjust their conclusions accordingly. An absence of association between alcohol consumption and head lice does not suggest specificity, but investigators may be more confident that in this study, the association between alcohol consumption and active-TB is not confounded by overcrowding.

The directed acyclic graphs (DAG) shows the relationship between the exposure (alcohol consumption), the outcome (active-TB), the confounding variable (overcrowding) and the falsification outcome (head lice). The bold square around overcrowding indicates that it has been conditioned on. If there is no effect of alcohol consumption on head lice, there is a greater likelihood that overcrowding has been accurately conditioned upon

Temporality using directed acyclic graphs (DAGs). Investigators may be more confident that the effect of alcohol consumption on active-TB is not due to reverse causality if (1) they condition upon active-TB before diagnosis and continue to observe an effect of alcohol consumption on active-TB after diagnosis or (2) if they do not observe an effect of active-TB before diagnosis on alcohol consumption
Finding falsification variables can be challenging. Take the example of identifying a falsification exposure (which is independent of the exposure and associated with the outcome only through the confounding variable). Many possible exposures associated with the confounder (overcrowding), such as smoking, air pollution, experiences of homelessness and malnutrition are also associated with the outcome (active-TB) and therefore would fail as a falsification exposure [57, 58]. Put another way, the lack of specificity in most causal relationships in epidemiology limits our ability to carry out falsification tests. However, where they do exist they can offer a powerful tool for assessing bias.
Causal pies illustrate the multi-factorial nature of causal relationship that limits the likelihood of specificity because a range of causal pies (and causal components) may produce the same outcome (see Table 2). One causal pie may also be used to represent a possible sufficient-cause for various exposures[59]. The causal pie would represent a specific relationship only if a component is both necessary and sufficient to produce the outcome and the outcome could only be produced by this necessary and sufficient cause [31, 33]. These limitations are among the reasons why some, including the originators of GRADE methodology, argue that specificity should be excluded from causal assessment [7, 10, 31, 60].
Temporality
Temporality is considered fundamental to causality; an exposure must precede an outcome. Bradford Hill alluded to how reverse causality skews temporality: “does a particular occupation or occupational environment promote infection by the tubercle bacillus … or, indeed, have they already contracted it?” [1]. Two of the three approaches explicitly incorporate temporality, with the order of cause and effect being fundamental to DAGs.
DAGs can highlight reverse causality [20, 61]. For example, in a cross-sectional study, the observed effect of alcohol consumption is based on measurements after individuals were diagnosed with active-TB. However, active-TB may have actually occurred prior to diagnosis of active-TB and been a cause of alcohol consumption, via social marginalisation [62]. Given a longitudinal study that has information on previous diagnoses, investigators could test for reverse causation by considering if active-TB was present before the diagnosis that was observed after alcohol consumption (see Fig. 4). If investigators conditioned upon active-TB before diagnosis and continued to observe an effect of consuming alcohol on active-TB after diagnosis, or if they found no effect of active-TB before diagnosis on alcohol consumption, then the estimated effect of alcohol consumption on active-TB after diagnosis is less likely due to reverse causation.
Time may be one component of a causal pie but temporality is not considered in the synergy, antagonism and interaction of the components [2]. Temporality is not directly considered by GRADE. RCTs, which guarantee that the exposure precedes the outcome through study design, are upgraded. However, the favouring of RCTs is not only about temporality but also about the achievement of exchangeability through randomisation. Additionally temporality is not explicitly considered for NRSs (which include longitudinal studies and so may also be able to ensure that the exposure precedes the outcome).([10].
Dose-response
A dose-response gradient exists when incremental increases (or decreases) of the exposure produce incremental increases (or decreases) of the outcome. Dose-response is fundamental to causal assessment in pharmacology and toxicology [63]. Bradford Hill argued that a dose-response gradient provides a “simpler explanation” of the causal relationship than if it were not observed (see Table 1) [1]. However, there are many reasons investigators may not observe a dose-response gradient including exposure threshold effects, as in the case of allergens [17]. Furthermore, a dose-response relationship may be induced by a confounding variable [64, 65]. For example, an incremental increase in alcohol consumption that corresponds to an incremental increase in active-TB may be due to incremental increases in overcrowding (see Fig. 1) [66]. While DAGs non-parametric (and so cannot show the structure of the relationship between any two variables), they can be used to consider the plausibility of one or more confounding variables undermining a dose-response relationship.
Unknown components limit the utility of SCC models to assess dose-response gradients. Evidence from NRSs is upgraded in GRADE if a dose-response relationship has been observed on the basis that confounding is less likely [35]. However, as noted above, a dose-response relationship may easily arise from confounding.
Plausibility
Investigators develop assumptions about a causal relationship based on background knowledge. Thus, the plausibility of the causal relationship is both dependent on and limited by knowledge available at the time [1]. It may be further limited by assumptions based on investigators’ beliefs rather than empirical evidence [67].
The process of developing DAGs and SCC models forces investigators to explicitly articulate assumptions about the causal relationships relevant to the research question of interest, making it transparent to other investigators [44, 68] [69]. DAGs may include mediators, which lie on the causal path between the exposure and outcome; a weakened immunity is the mediator by which alcohol consumption causes active-TB. Mediation analysis considers the direct and indirect effect of mediators [70]. Interrogating background knowledge to develop a DAG encourages a more systematic exploration of the plausibility of the causal chain.
For SCC models, investigators make explicit the nature of variable interaction [71]. GRADE upgrades for appropriate adjustment for all plausible confounding variables, but does not consider the broader variables relevant to the plausibility of a causal relationship across a body of evidence [35].
Coherence
Coherence is an assessment of how the putative relationship fits into existing theory and empirical evidence [1, 60]. Our comparisons suggest that coherence is not considered by the other approaches and may have limited utility, partly because it is poorly delineated from plausibility [72]. Investigators evaluating the coherence of a DAG or SCC model may consider how the assumptions illustrated by either approach fit existing theory, however, neither consider or illustrate coherence. Schünemann and colleagues argue that GRADE considers coherence by assessing indirectness [10]. However, in considering indirectness, investigators determine how applicable the population and interventions of identified studies are to the putative causal relationship under study. Coherence, on the other hand, asks investigators to consider how applicable the putative causal relationship is to broader evidence, including studies that do not investigate that specific relationship.
Experiment
Bradford Hill argued that “strong support for the causation hypothesis might be revealed” from “experimental, or semi-experimental data” [1]. He alluded to natural experiment studies, where the exposure is determined by nature or other factors outside of the control of investigators and where exchangeability between comparison groups is more likely [29].
Investigators have used DAGs to elucidate why randomisation results in exchangeability. Randomisation is an example of an instrumental variable; it causes (and is not caused by) the exposure and only impacts the outcome through the exposure [73]. If consuming alcohol was completely random and randomisation was independent of active-TB (see Fig. 5), the risk of overcrowding would be the same for individuals allocated to consume alcohol and those allocated to not [74]. Thus, the effect estimated would be based on exchangeable groups, but bounded by the proportion of individuals exposed due to randomisation, potentially limiting the transportability of the effect estimate [44, 75].

Directed acyclic graph (DAG) with randomisation as the instrumental variable. According to this DAG, randomisation causes alcohol consumption. If this were true, there is a greater likelihood that the effect estimated would be similar or equivalent to the true causal effect
Due to limitations on randomisation, epidemiologists rely largely on observational data. Investigators can use DAGs to interrogate the plausibility of “naturally occurring” instrumental variables, and how likely it is that individuals were truly randomly exposed [29, 73]. Clarity about study design, particularly procedures for assigning exposure, has been assisted by DAGs through the development of the ‘target trial’ (or ‘emulated trial’) where observational data analysis emulates randomised trial data analysis [76]. While it has several advantages, this does not seem to be directly comparable with the original BH viewpoint.
The causal pies that result in a given disease include both known and unknown components, as shown in Table 2. As investigators are unable to measure unknown variables for each causal pie, they cannot be certain that the groups exposed to each causal pie are exchangeable because they may differ in other characteristics that affect the outcome [4, 11]. GRADE privileges effect estimates from randomised (experimental) studies which are more likely to be “causally attributable to the intervention” by initially grading RCTs higher than NRSs [43]. At present, no distinction is made between natural experiment studies and other NRSs on the basis of study design.
Analogy
Bradford Hill argued that the likelihood of a causal relationship may be strengthened if a comparable association is observed between the same outcome and an analogous exposure or the same exposure and an analogous outcome. DAGs and SCC models do not account for analogous relationships in their assessment, but analogous relationships may be part of developing the assumptions and theories encoded in the diagrams. In GRADE, downgrading would be prevented if there was certainty in a causal relationship between the same exposure and similar outcomes in the same body of evidence [10]. While this has been conflated with analogy, this is more to do with the directness of the evidence to the research question rather than the transportability of the assumptions of an analogous, confirmed causal relationship to the one under study [77].
Discussion and conclusions
Epidemiologists evaluate evidence to understand how likely it is the observed effect is equal to the causal effect. We mapped DAGs, SCC models and GRADE against each BH viewpoint by comparing each tool to identify the overlap between different perspectives on causal assessment. The summary of these comparisons and the potential implications for causal assessment can be found in Table 5.
The comparisons highlight the overlap between BH viewpoints and other approaches. This underscores the ongoing influence of BH viewpoints in causal assessment alongside developments in causal thinking. It also highlights the importance of other approaches in understanding BH viewpoints. DAGs help explain the theoretical underpinning of strength of association, consistency, temporality, specificity, dose-response, plausibility, and experiment. GRADE provides guidance on how causal assessment can be applied in practice, particularly for considering strength of association, consistency, temporality, dose-response and experiment. While the inclusion of SCC models can be debated as they can be considered a framework to describe causal reality and are least used of the approaches we studied, their inclusion has been useful for understanding strength of association and plausibility in our analysis. Despite their seemingly limited utility for understanding BH viewpoints, SCC models, along with GRADE, also help explain why specificity may have limited usefulness in causal inference.
Our analysis is the first to compare insights from advancements in causal assessment with BH viewpoints [7]. This is an area that requires further research and we hope our study will encourage debate and discussion on overlapping approaches to causal inference. Further research and discussion is necessary to develop a new and comprehensive set of causal criteria that incorporates both traditional and recently developed approaches in causal inference. Such work would likely benefit from applying these different approaches to specific research questions, with a view to identifying their relative capacity to facilitate causal assessment. However, we did not critique the individual approaches as this has been done in previous works [4, 5, 10, 11]. We did not investigate all potential approaches to assessing causality (e.g. International Agency for Research on Cancer and criteria for teratogenicity) due to limited time and resources. Instead, we focused on GRADE, DAGs and SCC models which are perhaps the best-known causal assessment approaches outside of BH viewpoints.
This study underscores the need for greater clarity on causal assessment in epidemiology. This is an initial attempt to demonstrate how recent approaches can be used to elucidate BH viewpoints, which remain fundamental to causal assessment and to tentatively suggest how their application could be improved. Our findings are preliminary and we welcome debate about our comparisons and the suggested implications for causal assessment.
References
Hill AB. The environment and disease: Association or causation? Proc Royal Soc Med. 1965;58(5):295–300.
Phillips CV, Goodman KJ. Causal criteria and counterfactuals; nothing more (or less) than scientific common sense. Emerg Themes Epidemiol. 2006;3:5.
Dawid AP. Causal Inference without Counterfactuals. Journal of the American Statistical Association. 2000;95(450):407–24.
Flanders WD. On the relationship of sufficient component cause models with potential outcome (counterfactual) models. Eur J Epidemiol. 2006;21(12):847–53.
Greenland S, Brumback B. An overview of relations among causal modelling methods. Int J Epidemiol. 2002;31(5):1030–7.
Hernán MA, Robins JM. Causal Inference. forthcoming ed. Boca Raton: Chapman & Hall/CRC, forthcoming. (2019).
Krieger N, Smith GD. The tale wagged by the DAG: broadening the scope of causal inference and explanation for epidemiology. Int J Epidemiol. 2016;45(6):1787–808.
Rubin DB. Causal inference using potential outcomes: design, modeling, decisions. J Am Stat Assoc. 2005;100(469):322–31.
Rubin DB. Estimating causal effects of treatments in randomized and nonrandomized studies. J Educ Psychol. 1974;66(5):688–701.
Schünemann H, Hill S, Guyatt G, Akl EA, Ahmed F. The GRADE approach and Bradford Hill’s criteria for causation. J Epidemiol Community Health. 2011;65(5):392.
VanderWeele TJ, Hernán MA. From counterfactuals to sufficient component causes and vice versa. Eur J Epidemiol. 2006;21(12):855–8.
Viswanathan MB, ND; Dryden, DM; Hartling, L. Introduction. 2013. In: Assessing Risk of Bias and Confounding in Observational Studies of Interventions or Exposures: Further Development of the RTI Item Bank [Internet]. Rockville (MD): Agency for Healthcare Research and Quality. https://www.ncbi.nlm.nih.gov/books/NBK154456/.
Alrawahi AHH. Classical causation research practices and sufficient-component cause model – Appraisal and pitfalls. Epidemiol Biostat Public Health. 2017;14:3.
Olsen J, Jensen UJ. Causal criteria: time has come for a revision. Eur J Epidemiol. 2019;34(6):537–41.
Vandenbroucke JP, Broadbent A, Pearce N. Causality and causal inference in epidemiology: the need for a pluralistic approach. Int J Epidemiol. 2016;45(6):1776–86.
Cox LA. Modernizing the Bradford Hill criteria for assessing causal relationships in observational data. Crit Rev Toxicol. 2018;48(8):682–712.
Fedak KM, Bernal A, Capshaw ZA, Gross S. Applying the Bradford Hill criteria in the 21st century: how data integration has changed causal inference in molecular epidemiology. Emerg Themes Epidemiol. 2015;12(1):14.
Glass TA, Goodman SN, Hernan MA, Samet JM. Causal Inference in Public Health. 34. PALO ALTO: ANNUAL REVIEWS; 2013. pp. 61–75.
Howick J, Glasziou P, Aronson JK. The evolution of evidence hierarchies: what can Bradford Hill’s “guidelines for causation” contribute? J R Soc Med. 2009;102(5):186–94.
Ioannidis JPA. Exposure-wide epidemiology: revisiting Bradford Hill. Stat Med. 2016;35(11):1749–62.
Arnold KF, Harrison WJ, Heppenstall AJ, Gilthorpe MS. DAG-informed regression modelling, agent-based modelling and microsimulation modelling: a critical comparison of methods for causal inference. Int J Epidemiol. 2019;48(1):243–53.
Bhopal RS. Concepts of epidemiology: integrating the ideas, theories, principles and methods of epidemiology. 2nd ed. Oxford: Oxford University Press; 2008.
Jilani TN, Siddiqui AH. Active Tuberculosis. StatPearls Publishing. (2019).
Imtiaz S, Shield KD, Roerecke M, Samokhvalov AV, Lönnroth K, Rehm J. Alcohol consumption as a risk factor for tuberculosis: meta-analyses and burden of disease. Eur Resp J. 2017;50(1):1700216.
Greenland S, Pearl J, Robins JM. Causal diagrams for epidemiologic research. Epidemiology. 1999;10(1):37–48.
Hernán MA. Beyond exchangeability: The other conditions for causal inference in medical research. Stat Methods Med Res. 2012;21(1):3–5.
Pearl J, Mackenzie D. The book of why: the new science of cause and effect. London: Allen Lane; 2018.
Hernán MA, Hernández-Díaz S, Robins JM. A Structural Approach to Selection Bias. Epidemiology. 2004;15(5):615–25.
Craig P, Katikireddi SV, Leyland A, Popham F. Natural experiments: an overview of methods, approaches, and contributions to public health intervention research. Annu Rev Public Health. 2017;38(1):39–56.
VanderWeele TJ, Shpitser I. A new criterion for confounder selection. Biometrics. 2011;67(4):1406–13.
Rothman KJ. Epidemiology: an introduction. 2nd ed. Oxford;New York, N.Y;: Oxford University Press, (2012).
Rothman KJ, Greenland S. The emergence of modern epidemiology. In: Rothman KJ, Greenland S, editors. Modern epidemiology. 2nd ed. London, Lippincott: Philadelphia, Williams & Wilkins; 1998.
Rothman KJ, Greenland S. Causation and causal inference in epidemiology. Am J Public Health. 2005;95(S1):S144–50.
Mackie JL. Causes and conditions. Am Philosoph Quarterly (Oxford). 1965;2(4):245–64.
Schünemann HH, JPT; Vist GE; Glasziou P; Akl, EA; Skoetz, N. Guyatt, Gordon Completing ‘Summary of findings’ tables and grading the certainty of the evidence. 2019. In: Cochrane Handbook for Systematic Reviews of Interventions [Internet]. Cochrane. 6. https://training.cochrane.org/handbook/current/chapter-14.
Kneale D, Thomas J, Bangpan M, Waddington H, Gough D. Conceptualising causal pathways in systematic reviews of international development interventions through adopting a causal chain analysis approach. Journal of Development Effectiveness. 2018:1–16.
Norris SL, Bero L. GRADE methods for guideline development: time to evolve? GRADE methods for guideline development. Ann Intern Med. 2016;165(11):810–1.
Balshem H, Helfand M, Schünemann HJ, Oxman AD, Kunz R, Brozek J, et al. GRADE guidelines: 3. Rating the quality of evidence. J Clin Epidemiol. 2011;64(4):401–6.
Deaton A, Cartwright N. Understanding and misunderstanding randomized controlled trials. Soc Sci Med. 2018;210:2–21.
Boffetta P. Causation in the presence of weak associations. Crit Rev Food Sci Nutr. 2010;50(s1):13–6.
Fewell Z, Davey Smith G, Sterne JAC. The impact of residual and unmeasured confounding in epidemiologic studies: a simulation study. Am J Epidemiol. 2007;166(6):646–55.
Hackshaw AK. Effect sizes. A Concise Guide to Observational Studies in Healthcare. Chichester, West Sussex, UK;Hoboken, NJ; Wiley Blackwell; 2015. pp. 47–65.
Guyatt GH, Oxman AD, Sultan S, Glasziou P, Akl EA, Alonso-Coello P, et al. GRADE guidelines: 9. Rating up the quality of evidence. J Clin Epidemiol. 2011;64(12):1311–6.
Pearl J, Bareinboim E. External validity: from do-calculus to transportability across populations. Statist Sci. 2014;29(4):579–95.
Zumla A, Malon P, Henderson J, Grange JM. Impact of HIV infection on tuberculosis. Postgrad Med J. 2000;76(895):259–68.
VanderWeele TJ, Robins JM. Four types of effect modification: a classification based on directed acyclic graphs. Epidemiology. 2007;18(5):561–8.
Vander Weele TJ. Confounding and effect modification: distribution and measure. Epidemiol Methods. 2012;1(1):55–82.
Flanders WD, Johnson CY, Howards PP, Greenland S. Dependence of confounding on the target population: a modification of causal graphs to account for co-action. Ann Epidemiol. 2011;21(9):698–705.
Corraini P, Olsen M, Pedersen L, Dekkers OM, Vandenbroucke JP. Effect modification, interaction and mediation: an overview of theoretical insights for clinical investigators. Clin Epidemiol. 2017;9:331–8.
Guyatt GH, Oxman AD, Kunz R, Woodcock J, Brozek J, Helfand M, et al. GRADE guidelines: 7. Rating the quality of evidence—inconsistency. J Clin Epidemiol. 2011;64(12):1294–302.
Smith I. Mycobacterium tuberculosis pathogenesis and molecular determinants of virulence. Clin Microbiol Rev. 2003;16(3):463–96.
Ross LN, Woodward JF. Koch’s postulates: an interventionist perspective. Stud Hist Philos Biol Biomed Sci. 2016;59:35.
Weiss NS. Can the “Specificity” of an association be rehabilitated as a basis for supporting a causal hypothesis? Epidemiology. 2002;13(1):6–8.
Connor JP, Haber PS, Hall WD. Alcohol use disorders. Lancet. 2016;387(10022):988–98.
Sauer B, Vander Weele TJ. Use of Directed Acyclic Graphs. 2013. In: Developing a Protocol for Observational Comparative Effectiveness Research [Internet]. Rockville (MD): Agency of Healthcare Research and Quality (US). https://www.ncbi.nlm.nih.gov/books/NBK126189/.
Flanders WD, Klein M, Darrow LA, Strickland MJ, Sarnat SE, Sarnat JA, et al. A method for detection of residual confounding in time-series and other observational studies. Epidemiology. 2011;22(1):59–67.
den Boon S, van Lill SWP, Borgdorff MW, Verver S, Bateman ED, Lombard CJ, et al. Association between smoking and tuberculosis infection: a population survey in a high tuberculosis incidence area. Thorax. 2005;60(7):555–7.
Narasimhan P, Wood J, Macintyre CR, Mathai D. Risk factors for tuberculosis. Pulmonary Med. 2013;2013:828939–9011.
Chen C, Lee WC. Attributing diseases to multiple pathways: a causal-pie modeling approach. Clin Epidemiol. 2018;10:489–97.
Höfler M. The Bradford Hill considerations on causality: a counterfactual perspective. Emerg Themes Epidemiol. 2005;2:11.
Giordano GN, Lindström M. Trust and health: testing the reverse causality hypothesis. J Epidemiol Community Health. 2016;70(1):10.
Rehm J, Samokhvalov AV, Neuman MG, Room R, Parry C, Lönnroth K, et al. The association between alcohol use, alcohol use disorders and tuberculosis (TB). A systematic review. BMC Public Health. 2009;9:450.
Tsatsakis AM, Vassilopoulou L, Kovatsi L, Tsitsimpikou C, Karamanou M, Leon G, et al. The dose response principle from philosophy to modern toxicology: The impact of ancient philosophy and medicine in modern toxicology science. Toxicol Rep. 2018;5:1107–13.
Rosenbaum PR. Does a dose-response relationship reduce sensitivity to hidden bias? Biostatistics. 2003;4(1):1–10.
Weiss NS. Inferring causal relationships: Elaboration of the criterion of "dose-response" American Journal of Epidemiology. 1981;113(5):487–90.
Yitzhaki S, Schechtman E. Identifying monotonic and non-monotonic relationships. Econ Lett. 2012;116(1):23–5.
Rothman KJ, Greenland S. Causation and causal inference. In: Rothman KJ, Greenland S, editors. Modern epidemiology. 2nd ed. London, Lippincott: Philadelphia, Williams & Wilkins; 1998.
Ferguson KD, McCann M, Katikireddi SV, Thomson H, Green MJ, Smith DJ, Lewsey JD. Evidence synthesis for constructing directed acyclic graphs (ESC-DAGs): a novel and systematic method for building directed acyclic graphs. Int J Epidemiol. 2020;49(1):322–329. https://doi.org/10.1093/ije/dyz150.
Glymour MM. Using causal diagrams to understand common problems in social epidemiology. In Oakes JM, Kaufman JS, editors. Methods in social epidemiology. Jossey-Bass/Wiley; 2006. p. 393–428.
Richiardi L, Bellocco R, Zugna D. Mediation analysis in epidemiology: methods, interpretation and bias. Int J Epidemiol. 2013;42(5):1511–9.
Greenland S, Poole C. Invariants and noninvariants in the concept of interdependent effects. Scand J Work Environ Health. 1988;2:125–9.
Freeman MD, Kohles SS. Application of the Hill criteria to the causal association between post-traumatic headache and assault. Egyptian J Forensic Sci. 2011;1(1):35–40.
Lousdal ML. An introduction to instrumental variable assumptions, validation and estimation. Emerg Themes Epidemiol. 2018;15:1.
Heckman JJ. Randomization as an instrumental variable. Rev Econ Statistics. 1996;78(2):336–41.
Greenland S. An introduction to instrumental variables for epidemiologists. Int J Epidemiol. 2000;29(4):722–9.
Hernán MA, Robins JM. Using big data to emulate a target trial when a randomized trial is not available. Am J Epidemiol. 2016;183(8):758–64.
Weed DL. Analogy in causal inference: rethinking Austin Bradford Hill’s neglected consideration. Ann Epidemiol. 2018;28(5):343–6.
Funding
Wellcome Trust (GB) (205412/Z/16/Z) Dr Anna Pearce; Chief Scientist Office, Scottish Government Health and Social Care Directorate (SPHSU13) Dr Anna Pearce Dr Srinivasa Vittal Katikireddi; Medical Research Council (MC_UU_12017/13) Dr Anna Pearce Dr Srinivasa Vittal Katikireddi; Chief Scientist Office (SPHSU15) Dr Hilary Thomson; NHS Health Scotland (SCAF/15/02) Dr Srinivasa Vittal Katikireddi; Medical Research Council MC_UU_12017/15 Dr Hilary Thomson; Medical Research Council MC_ST_U18004 Michal Shimonovich.
Author information
Authors and Affiliations
Corresponding author
Additional information
Publisher's Note
Springer Nature remains neutral with regard to jurisdictional claims in published maps and institutional affiliations.
Rights and permissions
Open Access This article is licensed under a Creative Commons Attribution 4.0 International License, which permits use, sharing, adaptation, distribution and reproduction in any medium or format, as long as you give appropriate credit to the original author(s) and the source, provide a link to the Creative Commons licence, and indicate if changes were made. The images or other third party material in this article are included in the article's Creative Commons licence, unless indicated otherwise in a credit line to the material. If material is not included in the article's Creative Commons licence and your intended use is not permitted by statutory regulation or exceeds the permitted use, you will need to obtain permission directly from the copyright holder. To view a copy of this licence, visit http://creativecommons.org/licenses/by/4.0/.
About this article

Cite this article
Shimonovich, M., Pearce, A., Thomson, H. et al. Assessing causality in epidemiology: revisiting Bradford Hill to incorporate developments in causal thinking. Eur J Epidemiol 36, 873–887 (2021). https://doi.org/10.1007/s10654-020-00703-7
Received:
Accepted:
Published:
Issue Date:
DOI: https://doi.org/10.1007/s10654-020-00703-7