
Abstract
Educational institutions abruptly implemented online higher education to cope with sanitary distance restrictions in 2020, causing an increment in student failure. This negative impact attracts the analyses of online higher education as a critical issue for educational systems. The early identification of students at risk is a strategy to cope with this issue by predicting their performance. Computational techniques are projected helpful in performing this task. However, the accurateness of predictions and the best model selection are goals in progress. This work objective is to describe two experiments using student grades of an online higher education program to build and apply three classifiers to predict student performance. In the literature, the three classifiers, a Probabilistic Neural Network, a Support Vector Machine, and a Discriminant Analysis, have proved efficient. I applied the leave-one-out cross-validation method, tested their performances by five criteria, and compared their results through statistical analysis. The analyses of the five performance criteria support the decision on which model applies given particular prediction goals. The results allow timely identification of students at risk of failure for early intervention and predict which students will succeed.
1 Introduction
For the past 20 years, online Higher Education (OHE) has been the most growing instructional modality globally (Clinefelter & Aslanian, 2016). Thanks to its flexibility, it reaches students and teachers outside the institutional and geographic contexts that give OHE adaptation and evolution capacities and help build learning communities of great diversity (Kardan et al., 2013) which complicates the replicability and reproducibility of prediction models and the modelling of student performance (Gašević et al., 2016).
Because of the COVID-19 pandemic, OHE gained popularity among institutions that needed to incorporate emergent measures to save social distance (Tzivinikou et al., 2020). The sudden and massive incorporation of higher education programs into OHE is not fully measured. However, we can form some ideas based on previous online programs' performance regarding terminal efficiency, dropout (Buenaño-Fernández et al., 2019), and students' achievements (Thakar et al., 2015).
OHE context invites more research to widen the understanding of student performance and to prevent risk cases. Educational analytics became essential for these analyses and OHE development (Banihashem et al., 2018; Guan et al., 2020).
Research documents advanced technological tools to monitor students (Lemay & Doleck, 2020) and classification algorithms to predict student performance early (Buenaño-Fernández et al., 2019). Applying prediction algorithms in terms of classification guided by an adequate pedagogical and psychological theoretical basis provides more elements for decision-making due to their ease of interpretation than algorithms with other types of outputs, such as prediction numerical (Gobert et al., 2015). Once applied, these data mining methods can be used directly to support decision-making and develop strategies for improving student retention and performance (Helal et al., 2018).
Under this context, in this study, I trained a support vector machine classifier (SVM) and compared its results against a Probabilistic Neural Network (PNN) and a Discriminant Analysis (DA). Following literature review findings, I selected these classifiers by their suitability and prediction efficiency in several fields, including education (Paliwal & Kumar, 2009; Romero & Ventura, 2010; Romero et al., 2010; Dutt et al., 2017; Guan et al., 2020; Naicker et al., 2020).
To validate the models, I used the leave-one-out cross-validation method (LOOC) to train and test the models. Random sampling is a weakness in standard validation methods, such as hold-out or k-fold, and by using LOOC, I prevent this issue (Witten et al., 2011). I calculated the imbalance ratio (IR) of the data sets and compared the classifiers based on five criteria performance analyses: Accuracy, Recall, Sensitivity, Specificity, and the f-measure, to provide more insights into the utility of the prediction and a better overview of the algorithm performances and the educative problem.
Although the literature on the early prediction of student performance enables timely actions to prevent failure (He et al., 2018), some issues data-related are pointed out: the quality, standardisation, and difficulty of gathering the data (Banihashem et al., 2018). Academic grades are the standard SP (Aydoğdu, 2020; Namoun & Alshanqiti, 2021) and are accessible to most stakeholders, including teachers who often have no access to Learning Management Systems (LMS) data. Thus, I collected students' grades in four first-semester courses of an OHE program and used them as data to build the prediction models.
I attend the prediction of these students' performance in passing or failing the course from a single predictor variable that corresponds to the first scores obtained by the student on the academic course. In this way, I guarantee the early construction of the model and enable prediction.
The predictor variable contains course first-unit grades. SP categorical dependent variable contains the same course final grades. It belongs to one of the following two classes: "pass", which corresponds to the final scores equal to or above 60 points, and "fail" corresponds to the final grades equal to or below 59 points.
This study can respond to different analytical purposes according to the OHE stakeholder's utility. Suppose interest is knowing who and how many are failing and succeeding students; results will guide their identification. If the stakeholder interest is in selecting the most suitable algorithm to predict SP, this study provides which classification algorithm is the most accurate to predict student performance given conditions.
I developed two experiments, one with the total records of students' scores and the other using a subset of the first one: without the dropout records to analyse if dropouts interfere with the prediction goal. I trained and tested the machine learning-based classifiers, and their performances were compared with that of the DA. I formulated the following null and alternative hypotheses to be tested:
H0a: | The SVM performance is equal to that of the DA |
H1a: | The SVM performance is not equal to that of the DA |
H0b: | The SVM performance is equal to that of the PNN |
H1b: | The SVM performance is not equal to that of the PNN |
H0c: | The PNN performance is equal to that of the DA |
H1c: | The PNN performance is not equal to that of the DA |
This document develops the following four sections. Section 2 presents the literature review on computational applications for predicting SP. Section 3 describes the methodology, including the full description of the data used and the theory that supports the three models proposed for comparison, the SVM, the PNN, and the DA. Section 4 details the results obtained, and Section 5 presents the conclusion, discussion, and identification of future work. I remark that this manuscript focuses on predictive modelling, but I enhanced the conclusions by explaining the possible implications of the predictions. This focus is developed using a single predictor variable that prevents the intention of analysing several other variables discussed in the literature.
2 Related work
Machine learning and Education intersected in research and interests helping each other evolve (Guan et al., 2020; Sood & Saini, 2021). The joint investigation benefits and allows the growth of both research fields.
2.1 Computational applications in student prediction
Computational applications have been helpful for education, such as improving student performance and its prediction. Several academic publications on educational issues implement computational techniques approaching solutions with different goals and using various variables related to a final grade, for instance, enrolment data and LMS data records (Helal et al., 2018; Lemay & Doleck, 2020). This research approach is the most common and has improved computational techniques and predictive algorithms. However, these types of data are challenging to track and often unavailable because of regulations that protect individuals' sensitive data (Nunn et al., 2016).
A literature review including 42 papers stated that Learning Analytics involving computational techniques benefited education by identifying students at risk (Banihashem et al., 2018). Another recent literature review on Artificial Intelligence (AI) in education included 425 papers and found that predictive modelling accounts for 5.2% of the AI implementations in education. None of these reviews reports the use of PNN and SVM to predict student performance in OHE.
Academic publications present several computational techniques approaching solutions with different goals; in a literature review of Learning Analytics, counting 44 studies, Avella et al. (2016) list data analysis techniques, social network analysis, semantic and educational data mining, including prediction, clustering, relationship mining, discovery, and separation of data.
The most-reported classification algorithms for a broad of prediction purposes are decision trees, rule induction, and k-nearest neighbours (Kotu & Deshpande, 2015); followed by C4.5, EM, Naïve Bayes (Nuun et al., 2016), and methods based on rules and decision trees (Helal et al., 2018).
Neural Networks are applied in several fields: business, logistics, banking, sales, medicine, and engineering, among others (Paliwal & Kumar, 2009; Yan & Au, 2019), and prediction as to the principal approach (Romero & Ventura, 2010) showing promising results (Guan et al., 2020). In such cases, neural networks were compared against their statistical counterparts.
Despite the increasing number of neural network applications in educational settings (Dutt et al., 2017), they are considered the less used though the outstanding precision in predicting SP (Rastrollo-Guerrero et al., 2020). It is noticeable a particular gap in their use in OHE settings.
The work of Ulloa-Cazarez (2020) applied a Discriminant Analysis (DA), the standard, statistical-based classifier, and a Probabilistic Neural Network (PNN) on just one metric and compared the Accuracy, which is the most common measure in literature (Abu Zohair, 2019). This author predicted SP in OHE, and the results favoured PNN in five out of eight data sets. The three left data sets show no statistical differences in performances between the two classifiers.
SVM are classification techniques proven to be effective for prediction problems in several fields, including education (Romero et al., 2010; Rastrollo-Guerrero et al., 2020). However, their use is primarily an optimisation technique and is referred to as a gap in predicting SP (Naicker et al., 2020; Rastrollo-Guerrero et al., 2020). In traditional educational settings, SVMs have been applied to predict student performance (Burman & Som, 2019; Naicker et al., 2020), student dropout (Rastrollo-Guerrero et al., 2020), degree completion (Cardona & Cudney, 2019), and for classification of attentiveness (Ross et al., 2013).
Two works applied SVM to predict SP, one in OHE (Kotsiantis et al., 2004) and one in traditional education (Bydžovská, 2015). Both works used traditional education data from institutional information systems such as student demographics, synchronic meetings attendance, and scores on the first four assignments.
The basis of my proposal is to apply SVM (proved in traditional education settings) and compare it against a PNN (a less used but efficient prediction technique) and a DM (the standard classification algorithm). The results will help scrutinise this work's outputs compared with similar studies. The main difference is using a single predictor variable: early student grades.
The outputs of prediction algorithms commonly fall into three types: classification, regression, and density estimation (Ulloa-Cazarez et al., 2018; Avella et al., 2016), each one provides educational analytics with a rich perspective to be explored and are helpful, if the stakeholder has access to student digital prints. However, given the specific configuration of LMS, instructional design, and population variety, most of these studies show data issues related to reproducibility because of data types and their interpretation (Sclater, 2014).
Prediction outputs and models applied varied for practical applications in the studies reviewed (Namoun & Alshanqiti, 2021), complicating building a common source of knowledge and requiring highly trained people in the data mining field to apply these models (Alyahyan & Düstegör, 2020). This encourages providing less trained people with a more accessible method to apply prediction models, which would help expand knowledge on SP and prediction models.
Regarding prediction algorithms, I identify a lack of studies with the approach to this work. Given the gap in studies with this perspective and the efficiency of these algorithms in other fields, this proposal results would provide insights on the use of SVM, PNN, and DA, to predict SP.
2.2 Predictor variables of student performance
Three recent literature reviews on the prediction of SP coincide in the most common sources of predictor variables: enrolment data (Lemay & Doleck, 2020), data collected from software and educational platforms; assessment grades, and historical grades (Namoun & Alshanqiti, 2021; Rastrollo-Guerrero et al., 2020; BuenañoFernández et al., 2019). These are gathered by LMS automatised processes such as logs files and scores reports, which is the same data gathering method in this work.
Data from LMS can be of several types; LMS logs are widely used and known as students' digital prints (Helal et al., 2018); they have improved the understanding of particular educational phenomena using computational techniques and predictive algorithms (Sclater, 2014).
Data interpretation and reproducibility issues arose from these studies, and the resultant models are complicated to replicate and understand. Moreover, these data types are challenging to track and often unavailable because of regulations that protect individuals' sensitive data (Nunn et al., 2016). Therefore, the purposes of this work include the construction of an easy build model that allows practitioners with a few modifications to replicate this analysis.
Other studies explore factors collected through instruments such as questionnaires and surveys. These factors were correlated with SP and proposed as input data for the prediction models: the student's context, psychological and personality traits, learning practices (Yeh et al., 2019); students' emotions (Rastrollo-Guerrero et al., 2020), instructional conditions, and technology use (Gašević et al., 2016). Their methodological procedures and results varied, sometimes presenting divergent results and data-related issues (Thakar et al., 2015).
Furthermore, the multiplicity of educational models, evaluation systems, and learning output measures (Namoun & Alshanqiti, 2021) displays a great variety in learning settings, avoiding generalising technical, practical, and pedagogic terms.
In researching SP prediction, Gašević et al. (2016) advise that studies should include instructional characteristics and differentiate how technology is implemented in the particular learning setting to make more accurate assertions, implying no standardisable model. It suggests that educational actors should perform their experimentation to apply a prediction model instead of advantage of knowledge created. Nevertheless, in general terms, the variety of predictor variables is a researcher's concern, whereas they want to improve the accuracy or identify the importance of certain features of the models (Voss, 2005).
This advised particularity (Gašević et al., 2016) is not far from my reflections —the institutional technological infrastructure is diverse according to each institution generating a diversity of data types, obscuring the reproduction and generalisation of analyses (McDermott et al., 2021). Further, the lack of clarity and quality in the management, collection, and validation of the data, prevents the application of prediction models documented in different learning settings and building a body of knowledge.
As concluded, I built the prediction models with student grades data to prevent the data issues listed and provide a manageable method to reproduce this work. Moreover, by building these algorithms with student grades, I provide the means to reproduce this study.
2.3 Issues in student performance prediction
AI studies, in general, observe reproducibility problems (Gundersen & Kjensmo, 2018). In 2020 these problems were more noticeable when the number of COVID-19 related publications exponentially grew and identified data issues that compromised the veracity and impact of the research results (Jalali et al., 2020). Accordingly, researchers identify this lack of reproducibility in AI studies applied to other fields.
In practical terms, the SP prediction models are not manageable by educational administrators, teachers, or mentors (Gobert et al., 2015) and considering confusing enough for most stakeholders (Namoun & Alshanqiti, 2021). These limitations also prevent their application in different educational scenarios. Building classification algorithms (more readable than other algorithm types) with data easier to gather and few predictor variables (I used a single predictor variable) diminishes the inherent difficulties of creating prediction models.
Most educational publications are based on Social Sciences and Humanities approaches. These fields do not force researchers to report data or experimental procedures that allow replication; however, the need for more documented practices (Hardwicke et al., 2020). Scientific editorials recommend sharing data in public repositories to solve reproducibility and partially solve the data accessibility problem (AlQuraishi & Sorger, 2016). However, this hallmarks the inherent problems of data management and policies such as individual privacy.
OHE was the modal instruction with more growth during 2020 because of the COVID-19 pandemic (Tzivinikou et al., 2020); it is imperative to provide experimental and research results that the educational community could easily apply. The first step is to develop prediction models of student performance readably by most educational actors. I attend this call by applying classification algorithms that are readable prediction outputs.
2.4 Summary of related work
Several computational models are described in this section, using various predictor variables relating them to a final grade. The application of PNN stands out because of the absence of SP prediction studies reporting it. However, PNNs are proven adequate for binary problems, such as the one described here with two classes, "pass" and "fail."
I did not identify SVMs applied for predicting SP in OHE, but one work. To provide knowledge to the AI and Learning Analytics fields about SVM performance when predicting SP in OHE, I include the study of SVM, whose methods are effective for classification problems either in binary or multi-class classification (Vapnik, 1998).
Student grades are common and recognised data, easy to obtain and understand. They are spotlighted because of the number of publications that used and described them as accessible and manageable (Maurya et al., 2021; Namoun & Alshanqiti, 2021; Rastrollo-Guerrero et al., 2020; BuenañoFernández et al., 2019). These data allow the easy implementation of several analytic operations as recommended practices for AI applications (PFA Community, 2015). Moreover, student grades are an observable and measurable summary of SP, which permit comparisons on the assumption that reflects the whole learning outputs and processes, integrating qualitative and quantitative criteria in a single quantity, based on the teacher's perspective as an expert judge (Adelfio et al., 2014).
Student failure has transcended as the main OHE issue, but the variety of OHE systems worldwide prevents building a body of knowledge in terms of SP.
In accordance, I build three prediction models from student grades, addressing the need to use accessible and standardisable data which facilitate the experiments' replication. The results of this work may produce methodologically and theoretically independent applications, eliminating the limitations of particular focus and improving prediction models by their replication in different OHE settings.
3 Methodology
3.1 Description of the data
One of the purposes of this work is to facilitate the use and application of the prediction models proposed by people with no full access to student data. Therefore, I use data accessible as described in the Related Work section: the students' grades obtained through the reporting tools that virtually all learning management systems have and can be generated and accessed by professors, tutors, and educational administrators. The data sets constituted a holistic representation of student performance based on the teacher's judgment (Adelfio et al., 2014).
The data corresponds to one fully OHE program where students do not need to attend synchronic meetings or sessions; instead, the educational dynamic takes place on two LMS platforms. One is Moodle, and the other is an LMS developed by the higher education institution of the study case (Rodríguez Armenta, 2006); I used the automated grades reports from the two platforms, meaning that I do not have to calculate the scores.
The Metacampus platform was developed to host courses with social, economic, and humanistic content. It is the first step for people who have no previous context with LMSs and online education. The Metacampus only generates general statistics of student activity.
Moodle is a very known LMS openly distributed. In the context of the OHE institution of this study, it is used for more complex, technical and practical courses. It generates reports of the whole students' activity exhaustively.
In an unintrusive way, I downloaded the grades from both platforms, obtaining four first-semester subjects of an OHE program in the Information Technologies field, which make up the following four data sets described in Table 1, with complete closure of people's identities.
The final grades are calculated automatically on both platforms by obtaining the average (sets 1, 2, and 3) or the sum (set 4) of each activity's weighted values. The teachers manually assigned the scores for each activity based on their educational and field expertise and the evaluation rubrics with criteria specified in advance by an academic experts group, combining quantitative and qualitative aspects (Sistema de Universidad Virtual, 2021).
I calculated the first unit scores for each course in unity with the evaluation system established per course, as the average or the summation of that unit's activities scores. I verified each case with the respective course teacher, and the official scores report to detect missing values. Later I changed the missing values in correspondence (all cases were zero).
I performed two experiments—the first, using the complete database called BD1 with 692 records. Then to analyse the model behaviour in terms of prediction accuracy, I created the second database (BD2) by eliminating the students who dropped out of the course. The total number of students on BD2 is 488 (Table 2).
3.2 Support vector machine (SVM)
SVMs are used for classification problems either in binary, as in this study (fail and pass) or in multi-class classification such as excellent, good, regular, and insufficient (Vapnik, 1998).
An SVM represents the data in the p-dimensional space. The training algorithm takes these data dots as a p-dimensional vector, looking for the hyperplane that separates them into two classes. The training algorithm searches for the linear decision surface that separates the two classes and maximises the margin between that linear decision and the vectors closest to it. Those vectors are called support vectors. Figure 1 shows a hypothetical perfectly linear separable case.

Perfectly linear separable case. Note: adapted from James et al. (2013)
When the decision surface results in non-linear, the input vectors are non-linearly mapped into the feature space (Cortes & Vapnik, 1995).
A linear decision surface ensures maximal margin and low generalisation error. The machine does that by an optimal generalisation between all the hypothetical hyperplanes, which, in turn, improves the model's predictive ability, minimising errors from the classification tasks.
There are three concepts in the SVM algorithm:
-
(1)
A solution obtained from an optimal hyperplane
-
(2)
Allowing non-linear solution surfaces by convoluting the dot product
-
(3)
Soft margins allow flexibility from the original hard margin model
Equation 1 expresses these concepts and describes the search for the weight vector w and the scalar b, satisfying the inequality in the problem restrictions.
Subject to \({y}^{i}\left({w}^{T}\phi \left({x}^{i}\right)+b\right)\ge 1-{\mathcal{E}}_{i}\)
When the restrictions are met, the decision surface has the maximum margin and achieves the optimal generalisation. The element ϕ(xi) in Eq. 1 is a non-linear function that impacts the problem by mapping the input vector to a higher dimensional space.
The SVM includes the slack variables ξi, which are the distance of the input vector xi from the decision hyperplane. These variables help work with the problem of data that is not linearly separable. The ξi variables are associated with the parameter C (C > 0), which helps control over-training. When the value of the C parameter is high, the tolerance to classification errors is low. Thus, this parameter should be adjusted depending on the classification problem.
The problem described in Eq. 1 is complicated because of the high dimensionality of w and the significant number of training vectors; the solution is proposed through its dual form (Lagrange Multipliers, n.d.; Cortes & Vapnik, 1995), and the optimal vector of weights satisfy the constraint shown in Eq. 2.
The SVM training algorithm achieves the optimisation problem's solution and builds the decision function, represented in Eq. 3, for any test pattern x.
The Kühn-Tucker coefficients of Eq. 3, (or Lagrange multipliers), are used to solve the dual problem. The kernel function K(xi, x) = ϕ(xi)Tϕ(x) implements the three previously mentioned concepts and the model known as the support vector network (Cortes & Vapnik, 1995). The most common kernel functions (Maimon & Rokach, 2010) and used in this study are depicted in Eqs. 4, 5, 6, and 7:
3.3 Probabilistic neural network (PNN)
A PNN was introduced in 1990 by Specht (1990), who demonstrated breaking up the Bayes–Parzen classifier into several processes. The PNN has a four-layer structure, independently performed in parallel by a multilayer neural network. A PNN performs a nonparametric method to classify high reliability and speed observations. In this study, these observations correspond to those obtained from online students into g groups or categories, and in this case, g = 2 corresponds to pass or fail. The PNN uses v quantitative variables. Here, v is equal to 1, which corresponds to the independent variable, U1, whose value is related to students' grades when the course's first unit has finished.
The PNN constructs a nonparametric estimate of each density function for each group at the desired location based on neighbouring observations from that group. This estimation is obtained from a Parzen window, which weights observations from each group, considering the distance from the specified location.
A PNN consists of the following four layers:
-
1.
Input layer. It has v neurons, where v = 1 (an input variable, which corresponds to the grade obtained in the first unit by each student);
-
2.
Pattern layer. It has n neurons, where n = 180 patterns, that in Fig. 2 corresponds to the number of students for the first course (i.e., DPLM)
-
3.
Summation layer. It consists of g neurons, where g = 2 (corresponding to those two types of classifications: "pass" and "fail")
-
4.
Output layer. It contains a binary neuron for each category g. Whether a determined student is/is not assigned to the corresponding category, it turns on or off.
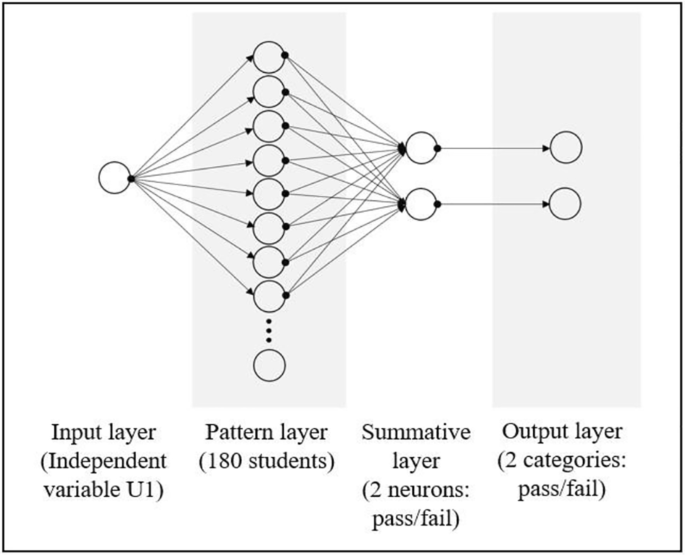
Diagram of a PNN applied to the first data set of this study
Figure 2 describes the data flow across the PNN as follows: the predictor variable U1 of the input layer is standardised based on the mean of its values divided by the standard deviation. These values are the input for the pattern layer that passes them utilising an activation function, which applies those input values to estimate the probability density function for each g category at a specific location. Equation 8 corresponds to the activation function used if the student i belongs to the category j; that is, Eq. 8 would be equal to zero if the student i do not belong to the category j (gij = 0), where:
-
X corresponds to the set of values for the input variable: the set of grades of the first unit obtained by each student.
-
xi corresponds to the i-th grade of the i-th student
-
σ is the standard deviation calculated from the set of the degrees of the group
$${g}_{ij}=W\left(\frac{X-{x}_{i}}{\sigma }\right)$$(8)
The W function corresponds to that Gaussian described in Eq. 9, where \(X-{x}_{i}^{2}\) is the Euclidean distance between X and xi.
These density estimates are shifted to the summation layer, which combines the information received with the n students' data with their related costs of probability and misclassification to derive a score for each g category. These scores are passed on to the binary neurons in the output layer.
3.4 Discriminant analysis (DA)
The DA finds linear relationships between the independent variables that best discriminate the students in the categories, which are two in this study: pass or fail; the independent variables are numerical, corresponding to only one in our study, U1. These variables help determine to which category the students belong.
Next, the DA constructs a decision rule to assign a new student to one of the pre-established categories, that is, a rule that answers the question "which category should be given to a student with a given grade obtained in their first unit of the course?"
The objective in a statistical model of DA is to construct n linear combinations of the v independent variables to better discriminate between the g categories. The discriminant functions come from the eigenvalues of W−1B, where W corresponds to the output of the categories sum of squares and the matrix of the cross products. In contrast, B corresponds to the sum of squares between the categories and the cross-product matrix. The j-th discriminant function has the form of Eq. 10, where each value of Z is standardised based on the mean of its values divided by its standard deviation. The coefficients of the discriminant functions are obtained from eigenvectors (McLachlan, 1992).
The ranking functions are derived from ranking a new student, and a score is consequent for each category. The jth category score is calculated based on Eq. 11; the new student is classified within a particular category with the largest value for Cj*priorj, where priorj corresponds to the prior probability of belonging to the j-th category.
3.5 Training and testing of models
Several cross-validation methods exist, such as hold-out, k-fold, and leave-one-out. I used the method LOOC to train and test the three models because it is deterministic and allows the training and testing of the model with the complete database records (Witten et al., 2011).
The LOOC method trains each model with records of N-1 students, where N is the size of the students' dataset. The model already trained is tested with the left student. The procedure is performed N times, calculating each accuracy measure per model.
3.6 Metrics for evaluating classifier performance
The measures used to evaluate a classifier's performance are calculated from the confusion matrix shown in Table 3 (Han et al., 2012). Their formulae are included in Table 4, and the meaning of their initials for the present study are as follows:
-
True positives (TP). The classifier labels correctly the number of students who failed the course.
-
True negatives (TN). The classifier labels correctly the number of students who passed the course.
-
False positives (FP). The classifier mislabels the number of students who failed the course as passing students.
-
False negatives (FN). The classifier mislabels the number of students who passed the course (as failing students).
The size of each class shows that the number of students in each is not the same. Therefore, I used the IR of applied classifiers as an additional suitable performance measure. IR is helpful for binary problems (Ortigosa-Hernández, 2017) and is calculated by dividing the majority class frequencies by the minority class frequencies. If IR > 1.5, then a data set is considered as imbalanced (Fernández et al., 2008). Table 5 shows the IR results by data set, indicating that just using the accuracy measures of Table 3 is insufficient for a performance comparison of classifiers for all of the data sets.
I executed the five performance analysis based on the measures described in Table 3 for each data set.
Then, I performed three types of analyses based on the results:
-
1.
Based on the number of data sets having the best performance by model.
-
2.
Based on the central tendency measures: mean and median.
-
3.
Based on statistical significance.
4 Results
The SVM, PNN, and DA were trained and tested using the LOOC method. The first experiment, BD1, implemented the total records (693). The second experiment used BD2 with 488 records.
I tested the parameters for each model by an exhaustive search until obtaining the best performance by applying LOOC. SVM obtained the best result (Table 6) with the linear kernel described in Section 3.2 and C = 1, suggesting the data allow a clear separation between fail and pass classes.
4.1 Best performance results, based on the number of data sets having the best scores
4.1.1 BD1
-
Accuracy: the SVM
-
outperformed DA in DPLM, DPP, and DS; and outperformed PNN in DPLM;
-
was equal to DA in CFC and PNN in DPP and CFC
-
-
Recall: the SVM
-
has the equal performance to PNN and DA in DPP
-
-
Sensitivity: the SVM
-
outperformed DA in all data sets;
-
outperformed PNN in DPLM and CFC and was equal in DPP.
-
-
Specificity: the SVM
-
outperformed DA in DPP;
-
was equal to PNN in DPP and DS
-
-
f-measure: the SVM
-
outperformed DA in all data sets;
-
outperformed PNN in DPLM and CFC and was equal in DPP.
-
4.1.2 BD2
-
Accuracy: the SVM
-
outperformed DA in DPLM, DPP, and DS; and was equal in CFC;
-
outperformed PNN in DPLM and DPP and was equal in CFC.
-
-
Recall: the SVM
-
outperformed DA in DPP and DS;
-
outperformed PNN in DPP.
-
-
Sensitivity: the SVM
-
outperformed DA in DPLM, DPP, and DS; it was equal in CFC;
-
outperformed PNN in DPLM and CFC and was equal in DPP.
-
-
Specificity: SVM
-
was equal to DA in DPP and DS;
-
outperformed PNN in DPP and was equal in DS.
-
-
f-measure: SVM
-
outperformed DA in DPLM, DPP, and DS;
-
outperforms PNN in DPLM, DPP, and CFC.
-
4.2 Results based on central tendency measures such as mean and median
4.2.1 BD1
-
SVM presented the best mean and median than DA in terms of Accuracy, Sensitivity, and f-measure. Also, it had the best mean and median than PNN in terms of Sensitivity and F-measure.
-
DA presented the best mean and median between SVM and PNN in terms of Recall and Specificity measures.
4.2.2 BD2
-
SVM presented the best mean and median than PNN and DA in terms of the Sensitivity and f-measure.
-
DA presented the best mean and median than PNN and DA in the Specificity measure.
4.3 Performance results based on statistical significance
To know if the performance differences are statistically significant, I select a suitable statistical test called the Friedman test (Conover, 1998), considering:
-
the number of data sets to compare (three data sets, one by prediction model)
-
the data are dependent (three models applied to the same data sets)
-
their variance is unknown (I have only four data sets; thus, it is impossible to perform any statistical normality test).
Table 7 shows the p-value for all performance measures and allows identifying a statistically significant difference in BD1 between the three models at the 95% confidence level for Accuracy, Sensitivity, and f-measure. There was no statistically significant difference between the models in BD2.
To determine which means/medians are significantly different for the three measures, I created a data set with each pair of model differences, SVM-DA, PNN-DA, and SVM-PNN, to perform a statistical test compare them. Since four data sets integrate BD1, it is useless to perform a normality test. Thus, a Wilcoxon nonparametric test is selected to compare the medians included in Table 8.
5 Conclusions
Based on the results presented in Tables 6, 7, and 8, I can elaborate on the following conclusions:
-
1.
The SVM outperforms DA in the three performance measures. However, Accuracy results should be analysed carefully, seeing that the number of students who fail surpasses the number of students who succeed. The IR analysis (Table 5) invites us to consider the risks of unbalanced data for DPLM and CFC.
-
2.
The SVM was better than DA but equal to PNN in terms of the Sensitivity measure, which helps identify which model better predicts risk students, enabling early decision-take to prevent these failures. Also, these results indicate that applying SVM enables more in-depth analyses, such as the characterisation of low performers at a specific time of the scholar calendar.
-
3.
The three models decreased their performances in terms of the mean and the median for the five performance criteria when using BD2 (Table 6). I recommend using the complete data set (BD1), which guarantees a more accurate representation of the actual educational scenario (Rancati, 2019).
-
4.
The Specificity criterion is adequate when the goal is to identify successful online students, enabling profiling of these students. However, there were no statistically significant differences between the models.
-
5.
The f-measure combines the Sensitivity and Recall measures and helps to deal with the risks of unbalanced data, which is the case. In two data sets, DPLM and DPP, SVM outperforms DA and PNN, whereas SVM was better than DA in DS and PNN in CFC. Therefore, I recommend using SVM for predicting students at risk of failure in OHE courses.
-
6.
Under the results presented in Tables 6, 7, and 8, in comparing SVM and DA for the experiment BD1, we can reject the null hypothesis and accept the alternative in favour of the SVM H1a: the SVM performance is not equal to that of the DA, for the Accuracy, Sensitivity, and f-measure criteria. Likewise, we accept the null hypothesis H0b: the SVM performance is equal to that of the PNN for all the cases.
-
7.
When comparing PNN and DA for both BD1 and BD2, we can accept the null hypothesis H0c: the PNN performance is equal to that of the DA in all the cases.
-
8.
We can apply SVM to predict student performance in OHE programs using only early student grades following the presented results, which is in the best interest of practitioners with only access to student grades.
6 Discussion and future work
The COVID-19 pandemic forces institutions and people to incorporate remote work and learning into their lives; OHE became an immediate solution, abruptly implemented, preventing institutions and people from generating technology appropriation strategies and increasing the magnitude of OHE issues. These conditions increase the negative perception of OHE outputs (Al-Mawee et al., 2021).
Issues of OHE have been identified and discussed in the past, where SP prediction is listed as a strategy helpful for decision-making, improving OHE outputs, and enabling further analyses of OHE educational phenomena.
Unlike common studies on SP prediction, I provide a practical prediction method to habilitate practitioners with minimum data access, more accessible for people with brief training, by using just early students' grades as a single predictor variable applying SVM. These results will help them identify and classify students at risk, implement remedial actions, and more profound research on students' conditions.
I applied three classifiers; two were identified in previous studies as practical means of predicting SP: PNN and DA; only one study compared them using a single accuracy measure (Ulloa-Cazarez, 2020); this would be the second study using SVM to predict student performance in OHE environments in ten years to the best of my knowledge.
Three literature reviews (Avella et al., 2016; Rastrollo-Guerrero et al., 2020; Romero & Ventura, 2010) on the use of computational algorithms to predict educational variables report the use of several neural networks: feedforward, backpropagation, radial basis, multilayer perceptron, generalised regression, but not probabilistic neural networks. Additionally, I identified one paper applying a multilayer neural network (Aydoğdu, 2020).
Generally, the neural networks obtained better prediction accuracy when compared to statistical techniques.
Two differences between previous studies with my proposal are:
-
1.
Comparing the three algorithms (I add the SVM) by using five measures, whereas other papers use just one metric; in this way, I provide answers for different interest domains as explained in the Introduction and further in the Methodology section.
-
2.
I performed a second analysis by eliminating dropouts from the dataset to test the impact of these records on the accuracy of the models, as described in the Methodology section.
The SVMs often used as optimisation techniques and for predicting several variables, such as student dropout in traditional education (Rastrollo-Guerrero et al., 2020). In most cases, SVMs provided the most accurate predictions, but their use of predicting SP in OHE is scarce. In this work, the results contribute to the understanding and improving SVM, PNN and DA when applied to predict SP in OHE.
I generated three classifiers using only the students' numerical grades marked by the teachers, which are easier to obtain and understand, enabling the performance of further experiments based on the ease of data access and standardisation (Abu Zohair, 2019). Working with these data allows for making decisions on time and deploying remedial strategies, as stated in the literature review section providing the data's precedence (Reis & Judd, 2014).
The achieved prediction accuracy enables identifying students at risk of failure, strengthening decision-making in remedial actions. These results also allow identifying good performance students and profiling them to, for instance, improve their academic routes. The algorithms directly interpret the classification and present it in a simple format that allows understanding of the prediction output. This classification supports several courses of action as informed interventions to improve student selection and experience.
The generation of two experiments is highlighted by creating a second database with the students' grades, eliminating those who dropped out of the course (BD2). My results may prove that this is unnecessary since the models' performances decreased.
This work contributes to applied AI knowledge by implementing computational algorithms for binary classification (pass/fail). Also, this work can be used for reproduction purposes, changing the type of students, for instance, online vs traditional education (Plesser, 2018). Moreover, the replication of this study is enabled under the conditions stipulated in Section 3, a necessary step to move forward with the generalisation of methodology and results achieved in terms of educational goals and computational analyses.
The SVM is barely used to predict student performance, though its speed of response and precision make it a more viable alternative than the DA. Therefore, we recommend the application of SVM to predict SP in OHE.
This work has one data-related limitation. I use relatively small data sets corresponding to only one semester of one OHE Engineering program. However, this limitation enables more practitioners with data access issues to perform and replicate this study.
There is an external validation threat: the biases related to the expert judgment, meaning the teacher's experience who scores students' activities. Identifying teachers' pedagogical stands and their inclusion in mathematical analyses may prevent biases.
I consider collecting data from successive semesters and different OHE programs to analyse and apply these prediction models for future work. I include classifiers based on decision trees whose performance will be compared with those obtained from SVM, PNN, and DA. Also, it is relevant to include the analysis of teachers' impact on the scores obtained by the students.
Data availability
The data sets used to build the prediction models in this work are not publicly available due to institutional regulations of the Sistema de Universidad Virtual of Universidad de Guadalajara. However, they could be provided only to replicate and verify the results on a reasonable request to the corresponding author. The data sets generated from the analyses performed during the current study are available in the manuscript tables and requested from the corresponding author.
Code availability
Not applicable.
References
Abu Zohair, L. M. (2019). Prediction of Student’s performance by modelling small dataset size. International Journal of Educational Technology in Higher Education, 16(27), 1–18. https://doi.org/10.1186/s41239-019-0160-3
Adelfio, G., Boscaino, G., & Capursi, V. (2014). A new indicator for higher education student performance. Higher Education, 68, 653–668. https://doi.org/10.1007/s10734-014-9737-x
Al-Mawee, W., Kwayu, K. M., & Gharaibeh, T. (2021). Student’s perspective on distance learning during COVID-19 pandemic: A case study of Western Michigan University, United States. International Journal of Educational of Research Open, 2, 100080. https://doi.org/10.1016/j.ijedro.2021.100080
AlQuraishi, M., & Sorger, P. K. (2016). Reproducibility will only come with data liberation. Science Translational Research Journal, 8(339), 1–7. https://doi.org/10.1126/scitranslmed.aaf0968
Alyahyan, E., & Düstegör, D. (2020). Predicting academic success in higher education: Literature review and best practices. International Journal of Educational Technology in Higher Education, 17(3), 1–21. https://doi.org/10.1186/s41239-020-0177-7
Avella, J. T., Kebritchi, M., Nunn, S., & Kanai, T. (2016). Learning Analytics Methods, Benefits, and Challenges in Higher Education: A Systematic Literature Review. Online Learning Journal, 20(2), S/D. https://doi.org/10.24059/olj.v20i2.790
Aydoğdu, Ş. (2020). Predicting student final performance using artificial neural networks in online learning environments. Education and Information Technologies, 25, 1913–1927. https://doi.org/10.1007/s10639-019-10053-x
Banihashem, S. K., Aliabadi, K., Ardakani, S. P., & Delaver, A. (2018). Learning analytics: A systematic literature review. Interdisciplinary Journal of Virtual Learning in Medical Sciences, 9(2), 1–10. https://doi.org/10.5812/IJVLMS.63024
Buenaño-Fernández, D., Gil, D., & Luján-Mora, S. (2019). Application of machine learning in predicting performance for Computer Engineering students: A case study. Sustainability, 11(10), 2–18. https://doi.org/10.3390/su11102833
Burman, I., & Som, S. (2019). Predicting Students Academic Performance Using Support Vector Machine. 2019 Amity International Conference on Artificial Intelligence (AICAI) (pp. 756–759). Dubai: IEEE. https://doi.org/10.1109/AICAI.2019.8701260
Bydžovská, H. (2015). Are collaborative filtering methods suitable for student performance prediction? Portuguese Conference on Artificial Intelligence, EPIA 2015 (pp. 425–430). Portugal: Springer. https://doi.org/10.1007/978-3-319-23485-4_42
Cardona, T. A., & Cudney, E. A. (2019). Predicting Student Retention Using Support Vector Machines. 25th International Conference on Production Research Manufacturing Innovation: Cyber Physical Manufacturing. 39, pp. 1827–1833. Chicago: Elsevier. https://doi.org/10.1016/j.promfg.2020.01.256
Clinefelter, D. L., & Aslanian, C. B. (2016). Online college students 2016: Comprehensive Data on Demands and Preferences. Louisville: LearningHouse. Retrieved May 13, 2021, from https://www.learninghouse.com/wp-content/uploads/2017/10/OCS-2016-Report.pdf
PFA Community. (2015). Data mining group. Retrieved May 9, 2021 from Portable Format for Analytics: http://dmg.org/pfa/index.html
Conover, W. J. (1998). Practical nonparametric statistics (3rd ed.). Wiley.
Cortes, C., & Vapnik, V. (1995). Support-vector networks. Machine Learning, 20, 273–297. https://doi.org/10.1007/BF00994018
Dutt, A., Akmar Ismail, M., & Herawan, T. (2017). A systematic review on educational data mining. IEEE Access, 5, 15991–16005. https://doi.org/10.1109/ACCESS.2017.2654247
Fernández, A., García, S., del Jesús, M. J., & Herrera, F. (2008). A study of the behaviour of linguistic fuzzy rule based classification. Fuzzy Sets and Systems, 159, 2378–2398. https://doi.org/10.1016/j.fss.2007.12.023
Gašević, D., Dawson, S., Rogers, T., & Gasevic, D. (2016). Learning analytics should not promote one size fits all: The effects of instructional conditions in predicting academic success. The Internet and Higher Education, 28, 68–84. https://doi.org/10.1016/j.iheduc.2015.10.002
Gobert, J. D., Kim, Y. J., Sao Pedro, M. A., Kennedy, M., & Betts, C. G. (2015). Using educational data mining to assess students’ skills at designing and conducting experiments within a complex systems microworld. Thinking Skills and Creativity, 18, 81–90. https://doi.org/10.1016/j.tsc.2015.04.008
Guan, C., Mou, J., & Jiang, Z. (2020). Artificial intelligence innovation in education: A twenty-year data-driven historical analysis. International Journal of Innovation Studies, 4(4), 134–147. https://doi.org/10.1016/j.ijis.2020.09.001
Gundersen, O. E., & Kjensmo, S. (2018). State of the art: Reproducibility in artificial intelligence. Proceedings of the Thirty-Second AAAI Conference on Artificial Intelligence. 32, pp. 1644–1651. New Orleans: AAAI. Retrieved from The Thirty-Second AAAI Conference
Han, J., Pei, J., & Kamber, M. (2012). Data mining: Concepts and techniques. Elsevier. https://doi.org/10.1016/C2009-0-61819-5
Hardwicke, T. E., Wallach, J. D., Kidwell, M. C., Bendixen, T., Crüwell, S., & Ioannidis, J. P. (2020). An empirical assessment of transparency and reproducibility-related research practices in the social sciences (2014–2017). Royal Society Open Science, 7(190806), 1–10. https://doi.org/10.1098/rsos.190806
He, L., Levine, R. A., Bohonak, A. J., Fan, J., & Stronach, J. (2018). Predictive analytics machinery for STEM student success studies. Applied Artificial Intelligence, 32(4), 361–387. https://doi.org/10.1080/08839514.2018.1483121
Helal, S., Li, J., Liu, L., Ebrahimie, E., Dawson, S., Murray, D. J., & Long, Q. (2018). Predicting academic performance by considering student heterogeneity. Knowledge-Based Systems, 161(1), 134–146. https://doi.org/10.1016/j.knosys.2018.07.042
Jalali, M. S., DiGennaro, C., & Sridhar, D. (2020). Transparency assessment of COVID-19 models. The Lancet, 8, e1459–e1460. https://doi.org/10.1016/S2214-109X(20)30447-2
James, G., Witten, D., Hastie, T., & Tibshirani, R. (2013). Support vector machines. In G. James, D. Witten, T. Hastie, & R. Tibshirani (Eds.), Introduction to statistical learning: With applications in R (pp. 337–372). Springer.
Kardan, A. A., Hamid, S., Ghidary, S. S., & Fani Sani, M. R. (2013). Prediction of student course selection in online higher education institutes using neural networks. Computers & Education, 65, 1–11. https://doi.org/10.1016/j.compedu.2013.01.015
Kotsiantis, S., Pierrakeas, C., & Pintelas, P. (2004). Predicting students’ performance in distance learning using machine learning techniques. Applied Artificial Intelligence, 18(5), 411–426. https://doi.org/10.1080/08839510490442058
Kotu, V., & Deshpande, B. (2015). Predictive analytics and data mining. Concepts and practice with Rapidminer. Elsevier - Morgan Kauffmann. https://doi.org/10.1016/C2014-0-00329-2
Lagrange Multipliers. (n.d.). In S. I. Gass, & M. C. Fu. Boston: Springer. https://doi.org/10.1007/978-1-4419-1153-7_200374
Lemay, D. J., & Doleck, T. (2020). Grade prediction of weekly assignments in MOOCS: Mining video-viewing behavior. Education and Information Technologies, 25, 1333–1342. https://doi.org/10.1007/s10639-019-10022-4
Maimon, O., & Rokach, L. (2010). Data mining and knowledge discovery handbook (2nd ed.). Springer.
Maurya, L. S., Hussain, M., & Singh, S. (2021). Developing classifiers through machine learning algorithms for Student placement prediction based on academic performance. Applied Artificial Intelligence, 35(6), 403–420. https://doi.org/10.1080/08839514.2021.1901032
McDermott, M. B., Wang, S., Marinsek, N., Ranganath, R., Foschini, L., & Ghassemi, M. (2021). Reproducibility in machine learning for health research. Science Translational Medicine. Perspective, 13(586), 1–5. https://doi.org/10.1126/scitranslmed.abb1655
McLachlan, G. J. (1992). Discriminant analysis and statistical pattern recognition. Wiley.
Naicker, N., Adeliyi, T., & Wing, J. (2020). Linear support vector machines for prediction of student performance in school-based education. Mathematical Problems in Engineering, 2020, 7. https://doi.org/10.1155/2020/4761468
Namoun, A., & Alshanqiti, A. (2021). Predicting student performance using data mining and learning analytics techniques: A systematic literature review. Applied Sciences, 11(1), 1–28. https://doi.org/10.3390/app11010237
Nunn, S., Avella, J. T., Kanai, T., & Kebritchi, M. (2016). Learning analytics methods, benefits, and challenges in higher education: A systematic literature review. Online Learning Journal, 20(2), S/D. https://doi.org/10.24059/olj.v20i2.790
Ortigosa-Hernández, J., Inza, I., & Lozano, J. A. (2017). Measuring the class-imbalance extent of multi-class problems. Pattern Recognition Letters, 98, 32–38. https://doi.org/10.1016/j.patrec.2017.08.002
Paliwal, M., & Kumar, U. A. (2009). Neural networks and statistical techniques: A review of applications. Expert Systems with Applications, 36(1), 2–17. https://doi.org/10.1016/j.eswa.2007.10.005
Plesser, H. E. (2018). Reproducibility vs replicability: A brief history of a confused terminology. Frontiers in Neuroinformatics, 11(76), 1–4. https://doi.org/10.3389/fninf.2017.00076
Rancati, T. (2019). Exploiting large data base to build robust predictive models: Validation issues. Radiotherapy and Oncology, 133(1), S290. https://doi.org/10.1016/S0167-8140(19)30971-5
Rastrollo-Guerrero, J. L., Gómez-Pulido, J. A., & Durán-Domínguez, A. (2020). Analysing and predicting students’ performance by means of machine learning: A review. Applied Sciences, 10(1042), 1–16. https://doi.org/10.3390/app10031042
Reis, H. T., & Judd, C. M. (2014). Handbook of research methods in social and personality psychology. Cambridge University Press.
Rodríguez Armenta, C. E. (2006). El Metacampus Virtual. La tecnología al servicio de la educación. Boletín CUDI, pp. 1–2. Retrieved May 16, 2021, from https://www.cudi.edu.mx/boletin/2006/METACAMPUS_VIRTUAl.pdf
Romero, C., & Ventura, S. (2010). Educational data mining: A review of the state of the art. IEEE Transactions on Systems, Man and Cybernetics, 40(6), 601–618. https://doi.org/10.1109/TSMCC.2010.2053532
Romero, C., Ventura, S., Pechenizkiy, M., & Baker, R. (2010). Handbook of educational data mining. Chapman & Hall/CRC.
Ross, M., Graves, C. A., Campbell, J. W., & Kim, J. H. (2013). Using Support Vector Machines to Classify Student Attentiveness for the Development of Personalized Learning Systems. 2013 12th International Conference on Machine Learning and Applications (pp. 325–328). Miami: IEEE. https://doi.org/10.1109/ICMLA.2013.66
Sclater, N. (2014). Code of practice “essential” for learning analytics. Retrieved March 20, 2021, from A literature review of the ethical and legal issues: https://repository.jisc.ac.uk/id/eprint/5661
Sistema de Universidad Virtual. (2021). Licenciatura en Tecnologías e Información. Retrieved May 16, 2021 from Academias: http://www.udgvirtual.udg.mx/lti#
Sood, S., & Saini, M. (2021). Hybridisation of cluster-based LDA and ANN for student performance prediction and comments evaluation. Education and Information Technologies, 26(1), 2863–2878. https://doi.org/10.1007/s10639-020-10381-3
Specht, D. F. (1990). Probabilistic neural networks. Neural Networks, 3(1), 109–118. https://doi.org/10.1016/0893-6080(90)90049-Q
Thakar, P., Mehta, A., & Manisha, P. (2015). Performance analysis and prediction in educational data mining: a research travelogue. International Journal of Computer Applications, 110(15), 60–68. Retrieved May 15, 2022 from https://arxiv.org/ftp/arxiv/papers/1509/1509.05176.pdf
Tzivinikou, S., Charitaki, G., & Kagkara, D. (2020). Distance Education Attitudes (DEAS) during Covid-19 crisis: Factor structure, reliability and construct validity of the brief DEA scale in Greek-Speaking SEND teachers. Technology, Knowledge and Learning, 1-19. https://doi.org/10.1007/s10758-020-09483-1
Ulloa-Cazarez, R. L., Lopez-Martin, C., Abran, A., & Yañez-Marquez, C. (2018). Prediction of online students performance by means of genetic programming. Applied Artificial Intelligence, 32(9–10), 858–881. https://doi.org/10.1080/08839514.2018.1508839
Ulloa-Cazarez, R. L. (2020). Aplicación de una red neuronal probabilística para predecir el desempeño académico de estudiantes de educación superior en línea. Research in Computing Science, 149(8), 31–40. Retrieved May 15, 2022 from https://rcs.cic.ipn.mx/2020_149_8/Aplicacion%20de%20una%20red%20neuronal%20probabilistica%20para%20predecir%20el%20desempeno%20academico.pdf
Vapnik, V. N. (1998). Statistical learning theory. Wiley.
Voss, D. S. (2005). Multicollinearity. In K. Kempf-Leonard (Ed.), Encyclopedia of social measurement (pp. 759–770). Elsevier. https://doi.org/10.1016/B0-12-369398-5/00428-X
Witten, I. H., Frank, E., & Hall, M. A. (2011). Data mining practical machine learning tools and techniques. Elsevier. https://doi.org/10.1016/C2009-0-19715-5
Yan, N., & Au, O.T.-S. (2019). Online learning behavior analysis based on machine learning. Asian Association of Open Universities Journal, 14(2), 97–107. https://doi.org/10.1108/AAOUJ-08-2019-0029
Yeh, Y.-C., Kwok, O.-M., Chien, H.-Y., Wall Sweany, N., Baek, E., & McIntosh, W. (2019). How college students’ achievement goal orientations predict their expected online learning outcome: The mediation roles of self-regulated learning strategies and supportive online learning behaviors. Online Learning Journal, 23(4), S/D. https://doi.org/10.24059/olj.v23i4.2076
Acknowledgements
This paper cannot be possible without the institutional support of the Virtual University of Universidad de Guadalajara and the warm advising of Dr. Cuauhtémoc López-Martín.
Author information
Authors and Affiliations
Contributions
I confirm that I am the sole author of this manuscript; thus, the conception, design, analysis, and interpretation of data and results were my contribution.
Corresponding author
Ethics declarations
Conflicts of interest/competing interest
I, Rosa Leonor Ulloa-Cazarez the author of the manuscript Accuracy Comparison Between Statistical and Computational Classifiers Applied for Predicting Student Performance in Online Higher Education, work as a full-time professor in the institutions where I perform the research; however, my status does not interfere in any form in the results or their interpretation, nor I have any commercial or particular interest in the subject matter. Therefore, I want to state that I have no conflict of interest to disclose.
Additional information
Publisher's note
Springer Nature remains neutral with regard to jurisdictional claims in published maps and institutional affiliations.
Rights and permissions
About this article

Cite this article
Cazarez, R.L.U. Accuracy comparison between statistical and computational classifiers applied for predicting student performance in online higher education. Educ Inf Technol 27, 11565–11590 (2022). https://doi.org/10.1007/s10639-022-11106-4
Received:
Accepted:
Published:
Issue Date:
DOI: https://doi.org/10.1007/s10639-022-11106-4