
Abstract
Multi detector-row CT (MDCT), the current preferred method for coronary artery disease assessment, is still affected by motion artefacts. To rule out motion artefacts, qualitative image analysis is usually performed. Our study aimed to develop a quantitative image analysis for motion artefacts detection as an added value to the qualitative analysis. An anthropomorphic moving heart phantom with adjustable heart-rate was scanned on 64-MDCT and dual-source-CT. A new software technique was developed which detected motion artefacts in the coronaries and also in the myocardium, where motion artefacts are more apparent; with direct association to the qualitative analysis. The new quantitative analysis managed to detect motion artefacts in phantom scans and relate them to artefact-induced vessel stenoses. Quantifying these artefacts at corresponding locations in the myocardium, artefact-induced vessel stenosis findings could be avoided. In conclusion, the quantitative analysis together with the qualitative analysis rules out artefact-induced stenosis.
Introduction
Coronary artery disease (CAD) is the leading cause of death in western countries [1, 2]. It can result in coronary vessels obstruction and eventually myocardial ischemia. Multi detector computed tomography (MDCT), a non-invasive imaging modality featuring large scan coverage up to 320 detector system rows, sub-millimetre spatial resolution up to 0.23 mm, and high temporal resolution up to 135 ms for a single source CT and 75 ms for a dual source CT (DSCT) system (with options for further increase using multi-segmental reconstruction techniques), is the current preferred method for CAD assessment [3–6].
Because of patient movement, irregular heart rate, and insufficient temporal resolution for high heart rate, cardiac MDCT images are often hampered by motion artefacts. Although identification of motion artefacts in large structures such as the myocardium can be relatively easy, it is not always possible to identify motion artefacts in smaller structures like the coronary vessels. Motion artefacts in the vessel were acknowledged as discontinuity and/or blurring [7]. These artefacts could lead to misinterpretation in the coronary computed tomography angiography (CTA) analysis.
Motion artefacts are commonly evaluated qualitatively, either by visually determining their presence/absence [8] or by assigning a severity rating [9, 10]. However, this approach heavily depends on user experience and interpretation. Although qualitative analysis is not necessarily insufficient, a quantitative analysis can give more precise and objective information; and make the user aware of suspicious regions. Therefore, the purpose of this study was to develop an algorithm for quantitative image analysis for the detection of motion artefacts in coronary artery computed tomography as an added value to the qualitative analysis and test it in phantom scans of two different CT devices.
Materials and methods
An anthropomorphic moving heart phantom (Limbs & Things, Bristol, UK), with an artificial coronary vessel was used. The movement of the heart phantom and the artificial coronary vessel have been shown to be comparable to the clinical setting [10]. The artificial coronary vessel was filled with a contrast agent (Ultravist-300, Schering, Switzerland) diluted to a concentration of about 250 HU. The phantom was scanned on a 64-row MDCT (64CT; Somatom Sensation 64, Siemens Medical Solutions, Forchheim, Germany) at 120 kV, 770 mAs and a DSCT (Somatom Definition, Siemens Medical Solutions, Forchheim, Germany) at 120 kV, 300 mAs/rot; both at 330 ms rotation speed in cranio-caudal direction. The field of view (FOV) was set at 200 mm × 200 mm. The heart phantom was placed in supine position with its apex facing away from the bore hole. A respiratory device was connected to the phantom, which inflated and deflated the phantom at a programmed rate to simulate a beating heart and produced an ECG signal which was connected to the CT scanner [10]. The phantom was scanned at rest and at 50–110 beats per minute (bpm) with 10 bpm intervals, without changing the phantom position. Twenty preview series at intervals of 5% throughout the R–R interval were made, from which the phase in the R–R interval with least motion artefacts was selected. For all dataset, 70% of the R–R interval was chosen as the optimal phase and datasets were reconstructed at 0.6/0.4 mm slice thickness/increment using kernel B25f and B26f for 64CT and DSCT, respectively. Figure 1 shows the scanned heart phantom, where motion artefacts were absent (left images) and present (right images).

The phantom used for experiment. Images without motion artefacts (left) and with motion artefacts (right) are shown both in a volume reconstruction (top) and a sagittal reconstruction (bottom). Arrows no. 1 and 2 denote start and end location of vessel analysis, respectively. Dotted white lines on the top row indicate the location of the sagittal slices
Two plexiglas tubes with reference/stenosis diameters of 6/4 and 4/2 mm (resulting in area stenosis of 56 and 75%, respectively) were also used. The lumen was filled with contrast agent (Visipaque 320, General Electric Healthcare) diluted to a concentration of about 250 HU. The vessel phantoms were scanned on the 64CT without motion at 120 kV and 107 mAs. The images were reconstructed at 0.75/0.4 mm slice thickness/increment using kernel B35f.
A Siemens Syngo workstation (Siemens Medical Solutions, Erlangen, Germany) was used for visual three-dimensional observation. Software for quantitative mathematical analysis was developed using Matlab® software (Mathworks Inc, USA).
Quantitative analysis
Quantitative analysis was performed in the myocardium and the coronary for each heart rate and both modalities. The analysis was performed as follows: (see Fig. 2 for the overview diagram)

Diagram of the quantitative image analysis methods for the detection of motion artefacts in coronary artery computed tomography
-
I.
Myocardium analysis
Due to the nature of the phantom’s movement [10], motion artefacts in the myocardium were most apparent in the sagittal plane, especially in the anterior part of the myocardium. The sagittal cross-section images were taken at approximately the centre of the phantom (dotted line in Fig. 1). The anterior inner lining of the myocardium (green line at Fig. 3, left) was semi automatically extracted using a gradient vector flow (GVF) snake algorithm [11] by first placing several seed points for the initial contour which were then allowed to grow to match the inner lining. From the extracted line, the following parameter was determined:
-
Ia.
Smoothness of the inner-lining of the myocardium
Smoothness of the inner-lining is determined by the presence of discontinuities, which was examined from its gradient. A second order polynomial line was fitted to the gradient to act as reference line (Fig. 3, right). A Gaussian smoothing filter (width = 5; σ = 4) was applied to the gradient plot to remove possible noise. Locations with gradient deviating more than a preset threshold to the reference line were marked as motion artefacts. The threshold was set at twice the standard deviation at 0 bpm.
Fig. 3 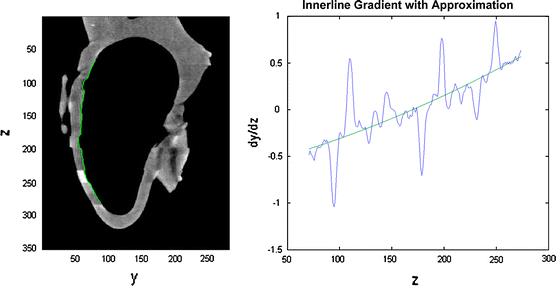
Illustration of myocardium analysis. From the sagittal cross section image of the phantom (left), the inner-lining of the myocardium was extracted (green line). The inner-lining was then analyzed for any discontinuities (right) by plotting the gradient along z-axis. Discontinuities were found at locations whose gradient deviates more than a certain threshold from the reference line
Visual observations by two independent observers were performed. The observers were blinded to the results of the quantitative analysis. Each observer was asked to score the sagittal images for the presence of no, mild or severe motion artefacts resulting in scores of 0, 1 and 2, respectively. Consensus reading was used in case of any disagreements.
-
Ia.

-
II.
Vessel analysis
Because of the occurrence of motion artefacts along z-axis, the analysis was limited to the vessel segment which was relatively parallel to the z-axis. The vessel segment was predetermined and set equal for all heart rates (segment from arrow 1 to arrow 2 at Fig. 1, top). A vessel extraction algorithm based on GVF snake was developed. Started by manual selection of the vessel lumen in the axial view at location 1 of Fig. 1, a small (50 by 50 pixels) region of interest (ROI) was determined around the vessel lumen. The image inside the ROI was thresholded at level 41% of the lumen peak value [12]. Afterwards, using GVF snake algorithm, the lumen boundary was extracted and its centre of mass was determined as centre point. The detection was continued to the next slice without further user interaction, and repeated until the last slice (Fig. 4, top).
Fig. 4 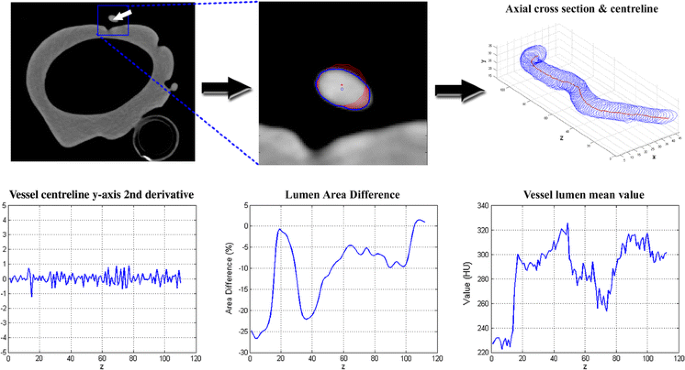
Illustration on vessel analysis. The vessel extraction algorithm (top images) was started by manual selection of the starting point (white arrow—top left) inside the vessel lumen at location 1 depicted at Fig. 1, from where an ROI (blue rectangle) was selected. Inside the ROI (top centre), the lumen boundary (bold blue line with centre point at blue circle) was detected using GVF snake algorithm. The vessel was constructed from the detected vessel boundaries and centre points (top right) along z-axis. Afterwards, the smoothness of vessel centreline (bottom left), the consistency of vessel lumen area (bottom centre) and the consistency of vessel lumen mean value (bottom right) along z-axis were analyzed
Three parameters were determined from the extracted vessel:
-
IIa.
Smoothness of the vessel centreline pathway along the z-axis
The vessel centreline was constructed using the detected centre points. The smoothness of the centreline is also determined by the presence of discontinuities, which were analyzed from its second derivative in the y-direction (direction of phantom movement; see direction legends at Fig. 1, bottom) at each heart rate. Comparison to 0 bpm dataset was made.
-
IIb.
Consistency of vessel lumen areas along the z-axis
Blurring can smear out the vessel lumen pixels, which consequently changes the amount of pixels considered to be lumen. Therefore the consistency of lumen area along the vessel was examined. The axial lumen area on each position along the detected centreline points from each heart rate was analyzed and compared to the 0 bpm data set.
-
IIc.
Consistency of vessel lumen value along the z-axis
Blurring can also change the lumen intensity value. Therefore the consistency of the lumen value along the vessel was examined. The lumen mean value inside the detected lumen boundary on each position along the detected centreline points from each heart rate was analyzed and compared to the 0 bpm data set. A mean-shift algorithm was performed to suppress noise while preserving large changes [13].
-
IIa.

The quantitative vessel lumen area and value consistency analysis was also applied to the second vessel phantom to see whether real stenosis would give any difference. Figure 4 bottom illustrates the vessel analysis methods.
The results of myocardium (I) and vessel (IIa–c) analysis were combined by correlating them side-by-side at the corresponding locations on z-axis, to determine whether there is coincidence of findings between the analysis results.
Association quantitative and qualitative analysis
A qualitative analysis was previously performed in the same dataset [9]. A direct comparison between the new quantitative method and the qualitative analysis was made.
Results
Quantitative analysis
The association between the qualitative and the developed quantitative analysis is listed on Tables 1 and 2, for 64CT and DSCT, respectively. The definition of quality scores are given by Table 3 [9].
-
Ia.
Smoothness of the inner-lining of the myocardium
The discontinuities threshold was set to 0.2. The visual observation of the two observers resulted in 38 individual motion artefacts, where 30 (79%) were identified by both observers, and eight (21%) by only one of both observers. 22 of 30 (73%) motion artefacts found by both observers were graded equal. From the eight artefacts found only by either one of the observer, four were discarded after consensus. In total, the consensus resulted in 34 motion artefacts: 21 on 64CT (six found to be severe) and 13 on DSCT (one found to be severe). The quantitative analysis managed to find 29 out of the consented 34 motion artefacts (85%), of which all 7 (100%) severe artefacts and 22 out of 27 (81%) mild artefacts were found. None of the four consensus-discarded artefacts were found to be artefacts by the quantitative analysis.
Tables 1 and 2 list the comparison of the true positive quantitative findings of myocardium inner-lining discontinuities artefacts versus the qualitative analysis. The qualitative findings scored DSCT with higher quality than 64CT, and the developed quantitative analysis concurred by finding more severe myocardium artefacts at 64CT. However, the same numbers of medium motion artefacts were found on both modalities. Therefore, only the severe myocardium artefacts can be related to the qualitative analysis.
-
IIa.
Smoothness of vessel centreline pathway along z-axis
The second derivatives of all heart rates have small absolute values below 1.5 indicating that no large discontinuities at the vessel pathway occurred and a student’s t test comparing the second derivatives of all heart rates to 0 bpm showed no significant differences (P < 0.05). The regular heart rate of the phantom and fixed selection of reconstruction phase in the R–R interval most probably caused the vessel to be always at the same position along the scan direction.
-
IIb.
Consistency of vessel lumen areas along the z-axis
Comparing the lumen area of all heart rates to 0 bpm on each modality, consistent vessel volume (cumulative sum of lumen areas along the vessel) reduction was observed at all dataset, except at 60 bpm on DSCT (see Tables 1, 2 under field “Cumulative Area Differences” for 64CT and DSCT, respectively). For the rest of this article, this lumen area reduction will be called stenosis (as opposed to the conventional definition of a stenosis, i.e. reduction of lumen area at certain location compared to the normal vessel proximal to it; which will be written in italic for the rest of the article). Although relatively small (<10%), this consistent stenosis implies that CT will always underestimate the vessel size and could thus underestimate stenosis severity in clinical settings. The stenoses occurred in segments, classified as medium (10–20%) and large (>20%) (see Tables 1, 2 under field “artefact-induced lumen area stenoses segments” for 64CT and DSCT, respectively). Small (<10%) lumen area stenoses segments were ignored because of their small significance.
Applying the algorithm to the vessel phantom, stenoses of 48 ± 2% and 73 ± 3% were detected for the designed stenoses of 56 and 75%, respectively.
Comparing to the qualitative results, the quantitative analysis concurred by finding larger overall cumulative stenosis on 64CT than on DSCT (4.9 vs. 3.5%). Moreover, the largest cumulative stenosis and the presence of large stenoses segments concurred with the lowest qualitative score at 100 bpm on 64CT. However, in the DSCT datasets qualitatively scored as ~4, medium stenoses segments were also found.
-
IIc.
Consistency of vessel lumen value along the z-axis
Fluctuations on vessel lumen value along z-axis were observed both at 64CT and DSCT. The (absolute) changes were classified as medium (20–40 HU), and large (>40 HU) (see Tables 1, 2 under field “lumen mean value changes”, for 64CT and DSCT, respectively). Small (<20 HU) changes were ignored because of their small significance.
Applying the algorithm to the vessel phantom, a small (10–20 HU) lumen-mean value decrease and a medium (40 HU) decrease were detected at the designed stenoses of 56 and 75%, respectively.
Comparing to the qualitative results, the quantitative analysis appears to show the opposite by finding more lumen value changes on DSCT than on 64CT. It is possible that these changes are not noticeable on the 3D VRT and curved MPR views used by the qualitative analysis.
Combination of analysis
Combining the vessel lumen value (IIc) and area (IIb) analysis, one large negative lumen value change (−60 HU) at 100 bpm on 64CT was found to coincide with the large lumen area stenosis (−30%). Combining the vessel lumen value (IIc) and myocardium (Ia) analysis, two out of 38 medium (5.3%) and five out of nine (55.6%) large lumen value changes were found to coincide with the myocardium artefacts (see Tables 1, 2 under field “lumen mean value changes”—values shown between brackets). From these findings, we can derive that motion could blur the vessel, reducing the attenuation value. From the experiment with the second vessel phantom, similar finding of a large lumen mean value decrease at the 75%-stenosis phantom was also observed, but not at the 56%-stenosis phantom. This result indicated that a large stenosis decreases the amount of lumen pixels to be significantly influenced by partial volume effect. Therefore, it is hard to distinguish artefact-induced and real stenosis based on lumen mean value decrease alone.
Combining the vessel lumen area (IIb) and myocardium (Ia) analysis, ten out of 29 myocardium artefacts were found to correlate with lumen area stenoses, of which two were severe stenoses at 100 bpm on 64CT. Figure 5 shows the combined analysis at this dataset. We can directly correlate the sharp change at point A with the qualitative step artefact observation, but not at point B. Nevertheless, there is more than 20% lumen area reduction close to it. Without apparent step artefacts on the plot, this lumen area reduction could be regarded as a true stenosis. However, by finding a myocardial motion artefact at the corresponding location, this lumen area reduction could be marked as artefact-induced. Although, as can be seen also in point C and D in Fig. 5, the presence of motion artefacts does not always have enough effect on the vessel visualization to result in apparent stenosis. Therefore, it is useful to check for the presence of motion artefacts in corresponding location in myocardium, if a stenosis is found. However, it might not be necessary if no stenosis is detected, although those areas will still be suspicious. This recommendation is summarized by Table 4.

Combination of vessel (IIb) and myocardium (Ia) analysis. The location of the detected myocardium artefacts are indicated by arrows A to D in the three-dimensional volume reconstruction view (left) and by red vertical lines A to D in the vessel lumen area consistency graph (right)
Discussion
The developed quantitative analysis managed to detect the motion artefacts in the phantoms scans at 64CT and DSCT. Moreover, it explored into more details the effect of motion artefacts on vessel visualization, even the ones that were missed by qualitative analysis.
When evaluating the coronary arteries, the proposed procedure could warn the radiologist for suspicious areas where motion artefacts are present that could hamper the evaluation of stenoses in the coronary arteries. This especially holds in the case that a radiologist is reviewing segmented and stretched views of the coronary arteries in which stenotic lesions could easily be misinterpreted. Detection of areas of motion artefacts could help to avoid false positive findings in coronary CTA stenoses evaluation. A false positive finding could direct the patients into unnecessary treatment which could pose another risk such as the possible risks related to percutaneous transluminal coronary angioplasty (PTCA). Meanwhile, a false negative finding could leave patients untreated. However, on the other side, patients with undetected coronary problems could live a long time without any problem, provided the patients were not subjected to excessive physical or emotional stress [14].
This study used 64-MDCT and DSCT, two modalities with similar characteristics except for their respective temporal resolution. DSCT has twice the temporal resolution of 64-MDCT, due to the two perpendicular X-ray tubes inside its gantry rotating simultaneously. The qualitative analysis had shown the superiority of DSCT over 64-MDCT in avoiding motion artefacts [9]. However, the quantitative analysis managed to reveal some artefacts on both modalities that would otherwise be missed.
Ferencik et al. [15] attempted to quantitatively analyze motion artefacts in coronary arteries, using two variables. The first variable is the percentage of coronary-length that is imaged without artefact, which nicely described the effect of motion to the coronaries. However, the detection of the motion artefact was performed qualitatively. In fact, our proposed method could be used for the motion artefact detection for this variable. The second variable is the contrast to noise ratio (CNR), which was calculated from the contrast of the vessel lumen mean attenuation value to the surrounding soft tissues, compared to the noise in the aorta. The consistency of vessel lumen value along z-axis measurement is similar to this variable, without comparison to surrounding soft tissue but with the advantage of location-specific depiction of motion artefacts. Otero et al. [16] reported their finding of lumen mean value decrease at stenoses larger than 20% based on patient study. This is consistent with our finding of lumen mean value decrease at large stenosis area. However, their study excluded dataset suffering from motion artefact which makes a direct comparison with our finding not possible.
The limitation of this study is the use of phantom data instead of patients’ data. Lack of real myocardium and vessel tissue of the phantom, and of surrounding pericardial fat tissue and chest cavity environment are factors that separate our phantom study to those of clinical patient examinations. Some adjustments can be made to apply our proposed method to the clinical examinations, such as: the parameters controlling GVF snake to extract myocardium boundaries, as in clinical examination, the heart chambers will be filled with contrast-enhanced blood instead of air. Other algorithm can be directly applicable to clinical examinations, such as: the lumen peak value-dependent lumen thresholding as this method was taken from a clinical study [12]. The pre-processing step of GVF snake should be able to handle the additional noises from scattering and attenuation inside the chest cavity.
Because of radiation dose concern, an examination with lower kV is desired. However, scans with different kV will affect HU values of materials, especially ones with high atomic number such as the contrast agent. The proposed method does not use a fixed HU threshold in any of the algorithms, which should make them also applicable to such examinations. In general, this phantom experiment has its advantage in the ability to adjust the heart rate in a controlled manner. The effects of heart rates in a large interval, from low until very high, can be individually studied.
We conclude that the developed quantitative analysis adds to the diagnostic value of a qualitative analysis. The quantitative analysis allows for the detection of suspicious regions of the coronary arteries thus reducing the false positive stenosis rate. Several publications reported an almost perfect score of negative predictive value of MDCT in detecting stenosis, but lower values were reported for positive predictive value [17–19]. The quantitative analysis proposed in this study could improve the positive predictive value by reducing the number of false positive finding. Future work applying the method into clinical data still needs to be conducted. Such study would involve patients examined by MDCT with X-ray angiography as stenosis reference. An adjusted version of the proposed method will be applied to the data to detect and quantify motion artefacts. The interpretation recommendation listed by Table 4 will be used to examine the images with reference to X-ray angiography findings.
References
Zheng ZJ, Croft JB, Giles WH, Mensah GA (2001) Sudden cardiac death in the United States, 1989 to 1998. Circulation 104:2158–2163
Heron MP, Smith BL (2007) Deaths: leading causes for 2003. Natl Vital Stat Rep 55:1–92
Fan J, Dong F, Sainath P, Hsieh J, Tang X, Toth T, Li B, Crandall P, Senzig R, Dixon A (2009) Image quality evaluation of a lightspeed CT750 HD computed tomography system. In: Samei E, Hsieh J, (eds) Medical imaging 2009: physics of medical imaging. Orlando, FL. Proc SPIE 7258: 72584S1–72584S8
Rybicki FJ (2009) Lower radiation dose coronary CT angiography with new imaging technologies. Int J Cardiovasc Imaging 25:149–151
Rybicki FJ, Otero HJ, Steigner ML, Vorobiof G, Nallamshetty L, Mitsouras D, Ersoy H, Mather RT, Judy PF, Cai T (2008) Initial evaluation of coronary images from 320-detector row computed tomography. Int J Cardiovasc Imaging 24:535–546
Walker MJ, Olszewski ME, Desai MY, Halliburton SS, Flamm SD (2009) New radiation dose saving technologies for 256-slice cardiac computed tomography angiography. Int J Cardiovasc Imaging 25:189–199
Leschka S, Wildermuth S, Boehm T, Desbiolles L, Husmann L, Plass A, Koepfli P, Schepis T, Marincek B, Kaufmann PA, Alkadhi H (2006) Noninvasive coronary angiography with 64-section CT: effect of average heart rate and heart rate variability on image quality. Radiology 241:378–385
Dodd JD, Kalva S, Pena A, Bamberg F, Shapiro MD, Abbara S, Cury RC, Brady TJ, Hoffmann U (2008) Emergency cardiac CT for suspected acute coronary syndrome: qualitative and quantitative assessment of coronary, pulmonary, and aortic image quality. AJR Am J Roentgenol 191:870–877
Dikkers R, Greuter MJ, Kristanto W, van Ooijen PM, Sijens PE, Willems TP, Oudkerk M (2008) Assessment of image quality of 64-row Dual Source versus Single Source CT coronary angiography on heart rate: a phantom study. Eur J Radiol 70:61–68
Greuter MJ, Dorgelo J, Tukker WG, Oudkerk M (2005) Study on motion artifacts in coronary arteries with an anthropomorphic moving heart phantom on an ECG-gated multidetector computed tomography unit. Eur Radiol 15:995–1007
Xu C, Prince JL (1998) Snakes, shapes, and gradient vector flow. IEEE Trans Image Process 7:359–369
Shimamoto R, Suzuki J, Yamazaki T, Tsuji T, Ohmoto Y, Morita T, Yamashita H, Honye J, Nagai R, Akahane M, Ohtomo K (2007) A new method for measuring coronary artery diameters with CT spatial profile curves. Radiography 13:44–50
Comaniciu D, Meer P (2002) Mean shift: a robust approach toward feature space analysis. IEEE Trans Pattern Anal Mach Intell 24:603–619
Strike PC, Perkins-Porras L, Whitehead DL, McEwan J, Steptoe A (2006) Triggering of acute coronary syndromes by physical exertion and anger: clinical and sociodemographic characteristics. Heart 92:1035–1040
Ferencik M, Nomura CH, Maurovich-Horvat P, Hoffmann U, Pena AJ, Cury RC, Abbara S, Nieman K, Fatima U, Achenbach S, Brady TJ (2006) Quantitative parameters of image quality in 64-slice computed tomography angiography of the coronary arteries. Eur J Radiol 57:373–379
Otero HJ, Mitsouras D, Steigner ML, Nallamshetty L, Levit NA, Rybicki FJ (2008) Contrast opacification gradients between normal and stenotic coronary arteries obtained from 320-detector row CT coronary angiography. In: 94th scientific assembly and annual meeting of radiological society of North America, Chicago, IL. p 471
Oncel D, Oncel G, Tastan A, Tamci B (2007) Detection of significant coronary artery stenosis with 64-section MDCT angiography. Eur J Radiol 62:394–405
Leber AW, Johnson T, Becker A, von Ziegler F, Tittus J, Nikolaou K, Reiser M, Steinbeck G, Becker CR, Knez A (2007) Diagnostic accuracy of dual-source multi-slice CT-coronary angiography in patients with an intermediate pretest likelihood for coronary artery disease. Eur Heart J 28:2354–2360
Oncel D, Oncel G, Tastan A (2007) Effectiveness of dual-source CT coronary angiography for the evaluation of coronary artery disease in patients with atrial fibrillation: initial experience. Radiology 245:703–711
Open Access
This article is distributed under the terms of the Creative Commons Attribution Noncommercial License which permits any noncommercial use, distribution, and reproduction in any medium, provided the original author(s) and source are credited.
Author information
Authors and Affiliations
Corresponding author
Rights and permissions
Open Access This is an open access article distributed under the terms of the Creative Commons Attribution Noncommercial License (https://creativecommons.org/licenses/by-nc/2.0), which permits any noncommercial use, distribution, and reproduction in any medium, provided the original author(s) and source are credited.
About this article
Cite this article
Kristanto, W., van Ooijen, P.M., Dikkers, R. et al. Quantitative image analysis for the detection of motion artefacts in coronary artery computed tomography. Int J Cardiovasc Imaging 26, 77–87 (2010). https://doi.org/10.1007/s10554-009-9502-x
Received:
Accepted:
Published:
Issue Date:
DOI: https://doi.org/10.1007/s10554-009-9502-x