
Abstract
Purpose
Cell lines are extremely useful tools in breast cancer research. Their key benefits include a high degree of control over experimental variables and reproducibility. However, the advantages must be balanced against the limitations of modelling such a complex disease in vitro. Informed selection of cell line(s) for a given experiment now requires essential knowledge about molecular and phenotypic context in the culture dish.
Methods
We performed multidimensional profiling of 36 widely used breast cancer cell lines that were cultured under standardised conditions. Flow cytometry and digital immunohistochemistry were used to compare the expression of 14 classical breast cancer biomarkers related to intrinsic molecular profiles and differentiation states: EpCAM, CD24, CD49f, CD44, ER, AR, HER2, EGFR, E-cadherin, p53, vimentin, and cytokeratins 5, 8/18 and 19.
Results
This cell-by-cell analysis revealed striking heterogeneity within cultures of individual lines that would be otherwise obscured by analysing cell homogenates, particularly amongst the triple-negative lines. High levels of p53 protein, but not RNA, were associated with somatic mutations (p = 0.008). We also identified new subgroups using the nanoString PanCancer Pathways panel (730 transcripts representing 13 canonical cancer pathways). Unsupervised clustering identified five groups: luminal/HER2, immortalised (‘normal’), claudin-low and two basal clusters, distinguished mostly by baseline expression of TGF-beta and PI3-kinase pathway genes.
Conclusion
These features are compared with other published genotype and phenotype information in a user-friendly reference table to help guide selection of the most appropriate models for in vitro and in vivo studies, and as a framework for classifying new patient-derived cancer cell lines and xenografts.
Avoid common mistakes on your manuscript.
Introduction
Heterogeneity pervades the molecular and cellular landscapes of breast tumours at virtually every level; a consequence of transformation-associated changes coalescing with epithelial lineage commitment programs inherited from the tumour cell(s)-of-origin. Patient-derived cell lines (PDCL) and xenografts (PDX) can model this complexity fairly accurately and are becoming more prevalent in preclinical research. While PDCL/PDX are in many ways ‘better’ models of breast cancer, established cell lines remain extremely useful in earlier-phase studies because they are versatile, reliable, reproducible, amenable to genetic manipulation and conducive to hypothesis testing under controlled experimental conditions.
Over the past decade, several groups have mapped the genotypes, phenotypes, in vitro and in vivo behaviour of cell line models in order to define their relevance to human disease, provide benchmarks for assessing the integrity of cell line stocks around the world and to help contextualise experimental data. The approaches have included exome sequencing, copy-number analysis, whole-transcriptome and targeted analysis of biomarkers relevant to breast cancer or mammary gland development [1,2,3,4,5,6,7,8,9]. These studies proposed various frameworks in which each line could be categorized. For example, expression array studies identified three major intrinsic subtypes (Luminal, Basal-A and Basal-B/claudin-low) [1, 4, 7], and 4–6 triple-negative (TN) cell line subgroups [3, 10]. Expression of breast epithelial lineage commitment markers can also discriminate phenotypic and functional classes, such as CD24 and CD44 (associated with differentiation and tumourigenicity); and EpCAM and CD49f, which exhibit restricted expression in the two major functional compartments (luminal or myoepithelial) of the mammary gland [2, 11, 12].
Here, we provide an update on breast cancer cell line classification,Footnote 1 incorporating single-cell protein profiling, targeted digital expression analysis and functional pathway mapping. In performing this analysis, we investigated which approaches could be applied to classify new cell lines, using a previously undescribed line derived in our lab from a metastatic bone deposit (P7731). We also applied the data to quantify the relationship between TP53 mutation status, RNA and protein expression. The data are interpreted in a context that recognises heterogeneity and the trending, anti-reductionist view of complex biological systems in cancer research. The cell lines used in this study were genetically authenticated, certified to be free of mycoplasma, and cultured under standardized conditions.
Materials and methods
Cell culture
Cell lines were sourced from the ATCC, or from the collection developed and authenticated by the Brisbane Breast Bank from 2010 to 2012 ([13] and Table 1). P7731 was derived in-house from a metastatic bone deposit from a breast cancer patient enrolled in the Victorian Tissue Bank (manuscript under review), who provided informed written consent to use donated tissue for research purposes. We acknowledge the existence of genotypic and phenotypic variants of some cell lines, and emphasise that the data presented here reflect our specific collection. Nonetheless, it broadly represents cell line collections used in standard breast cancer research laboratories around the world, and multiple quality control measures were in place to ensure its integrity. The QC process was as follows: (1) At baseline (earliest passage), the morphology of each line was checked for consistency with published information, cultures were photographed for future comparison, and expanded to generate cryopreserved ‘master stocks’. (2) Mycoplasma testing was performed using the Mycoalert® kit (Lonza) according to the manufacturer’s instructions, using media from cells cultured without antibiotic for 2 weeks. All master stocks used in this study were mycoplasma-negative. (3) DNA was extracted for STR-profiling and targeted mutation analysis (see below). (4) Thawed master stocks were cultured for at least 48 h to 70% confluence prior to each experiment, and used within five passages of the authenticated baseline (Table 1), with ongoing re-analysis of morphology and growth rates, and regular re-testing to confirm negative mycoplasma status.
Culture media were prepared according to ATCC recommendations ([14] and Table 1), and cells were maintained at 37 °C in a humidified atmosphere with 5% CO2. Base media and supplements were purchased from Thermofisher Scientific (TFS) or Sigma-Aldrich (SA): DMEM (TFS catalogue no. 11995065), RPMI (TFS-11875093), McCoy’s 5A modified medium (TFS-16600082), DMEM/F12 (TFS-11330032), Ham’s F12 (TFS-11765054), foetal bovine serum (FBS; TFS-16000044), horse serum (TFS-16050130), bovine pituitary extract (TFS-13028014), Insulin (SA-I5500), Hydrocortisone (SA-H0888), cholera toxin (SA-C8052), epidermal growth factor (SA-E9644), transferrin (SA-T8158). Antibiotic/antimycotic was routinely included in culture media (TFS-15240062). Master stocks were cryopreserved in a solution comprising 50% of the regular growth medium, 10% dimethyl sulfoxide (DMSO) and 40% FBS.
Short tandem repeat (STR)-profiling and targeted mutation analysis
DNA extraction from cell pellets was performed using the QIAamp DNA Mini kit (QIAGEN) and profiling was performed using the Cell ID™ System (Promega). The assay allows co-amplification and three-color detection of 9 STR loci (D21S11, TH01, TPOX, vWA, CSF1PO, D16S539, D7S820, D13S317 and D5S818) and Amelogenin for gender identification and collectively provides a genetic profile with a random match probability of 1 in 2.92 x 10⁹. The amplified and fluorescently-tagged loci were analysed by capillary electrophoresis on an ABI Prism 3100 Genetic Analyser (Applied Biosystems) at QIMR Berghofer (Table-S1). Of the 35 lines tested, 25 matched profiles published by either the ATCC or other laboratories, seven had not been previously published, and three gave partial matches (HBL100, the subject of an authenticity debate (below); Hs578T, which exhibited loss-of-heterozygosity (LOH) at 2/10 STR loci; and MDAMB435, LOH at one locus and different number of STRs at another. The three partially matched lines are triple-negative and may exhibit heightened genomic instability [4].
Targeted mutation analysis of PIK3CA, HRAS, KRAS and BRAF was performed using the Oncocarta Assay (v1.0; Sequenom [15]). Variants were validated by High Resolution Melt analysis, iPLEX (using different PCR and extension primers), repeat OncoCarta analysis and/or Sanger sequencing. Lines were also Sanger-sequenced to identify mutations in EGFR (NC_000007.1; Ex 5–11/23–28) and TP53 (NC_000017.9; exons 4–10 as per International Agency for Research on Cancer (IARC) recommendations [16, 17]). Comparing our findings to cell line mutation data repositories [18, 19] revealed several differences: four instances where we could only detect the wild-type allele but a mutation had been reported previously, possibly indicating LOH at these loci (BT474 (PIK3CA, EGFR), MDAMB231 (BRAF), MDAMB436 (BRAF) and ZR751 (HRAS); MDAMB436, where a BRAF deletion was found by the CCLE but not COSMIC or our study; and two with discordant findings between the CCLE and COSMIC (BRAF mutations in MDAMB361 and MDAMB415). These findings highlight the existence of clonal and phenotypic drift in different cell line stocks around the world (Table-S1).
Based on these analyses we can also make the following comments about cell line authenticity:
-
Previous reports have suggested that KPL1 and MCF7 are the same cell line [20]. Indeed, our stocks had identical STR profiles, shared the E545 K PIK3CA mutation (Table-S1) and had very similar transcriptional profiles (Fig. 3/S3), though there were some phenotypic differences noted with single-cell analysis (Figs. 1,2), consistent with KPL1 being a clonal derivative of MCF7.
Fig. 1 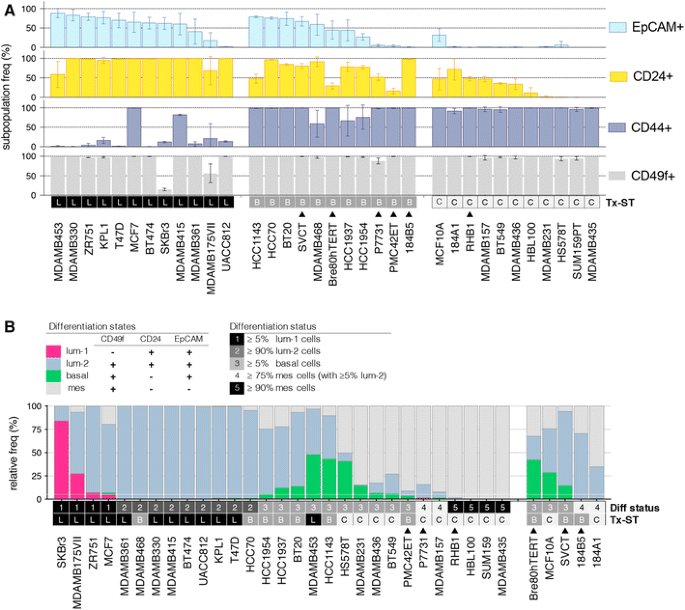
Breast cancer cell line differentiation states assessed by multiplexed flow cytometry. a Proportions of cells positive for EpCAM, CD24, CD44 and CD49f within subconfluent cultures of 34 breast cancer cell lines. The error shown is the standard deviation from analysis of at least three independent cultures of each line. Cells are arranged in descending order of EpCAM-positivity, grouped by gene expression subtype (Tx-ST; L, luminal; B, basal; C, claudin-low). Filled triangle: transcriptome subtype determined using surrogate cytokeratin analysis ([1] and Table-S2). b CD49f/CD24/EpCAM phenotypes were used to infer epithelial differentiation states in cell line cultures (L1, luminal-1; L2, luminal-2; B, basal; M, mesenchymal; according to the criteria in the upper panel). We identified five major groups characterised by relative abundance of these subpopulations: (1) cultures retaining at least 5% of L1 cells; (2) cultures comprising >90% L2 cells; (3) cultures retaining at least 5% basal cells; (4) cultures comprising mesenchymal cells with at least 5% L2 cells; (5) cultures comprising virtually 100% mesenchymal cells. The horizontal white line at 5% and transcriptomic subtypes are shown for reference
Fig. 2 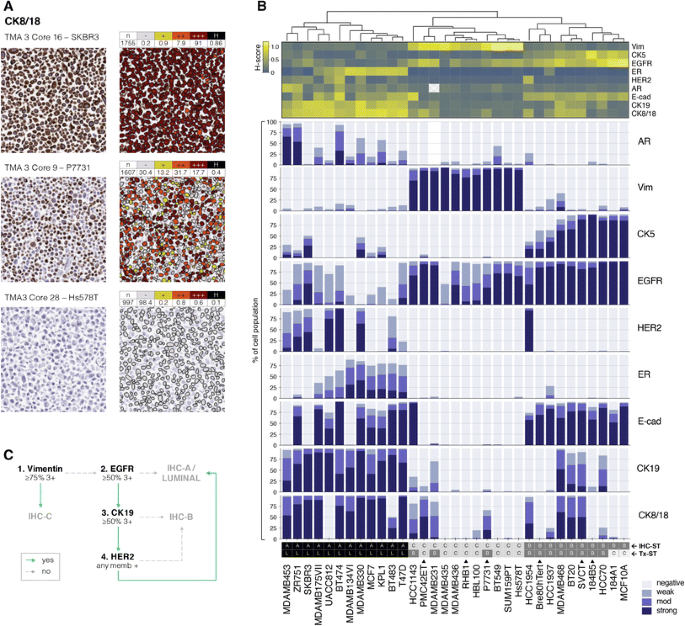
Mapping heterogeneity in cell line cultures using digital immunohistochemistry (IHC) analysis of lineage markers. a Example digital analysis pipeline showing cell pellet IHC for cytokeratin 8/18 (left), and the results of the nucleus-based cell segmentation and quantification algorithm used (right), for three cell lines exemplifying different overall staining. Matrices show of all cells (n) analysed for each core, the proportions lacking (−), or with low (+), moderate (++) or high (+++) expression of CK8/18. Each line was also given an overall H-score (H), weighted for proportion and intensity of staining. At least two cultures were separately grown, fixed, stained and analysed for each line. b Unsupervised analysis of H-scores for eight markers across 33 cell lines produced three IHC-clusters (A, B and C; coloured in the dendrogram). The heatmap shows relative H-scores aligned with stacked bar charts indicating relative proportions of cells exhibiting negative, weak, moderate and strong staining. c Flowchart for categorising new cell lines using a minimal set of IHC tests. Recommended staining criteria are indicated for each marker (% of the population exhibiting 3 + (strong) staining. Other abbreviations: memb = membrane. Filled triangle: transcriptome subtype determined using surrogate cytokeratin analysis ([1] and Table-S2)
-
We did not detect a Y chromosome in HBL100 (Table-S1), which has been the basis for its exclusion from cell line repositories and cell line panel studies.
-
MDAMB435 has also been the subject of an historic authenticity debate, with conflicting reports that it could either be the M14 melanoma cell line or a breast-derived line that exhibits lineage infidelity, including melanocytic features [21,22,23]. This line was an outlier in multiple experiments in our study, though others have performed more comprehensive analyses [24]. The most recent consensus is that the line was indeed contaminated with melanoma cells and should not be used as a breast cancer model [25].


Molecular classification
Transcriptome subtype (Tx-ST) was assigned based on previous gene expression array studies, summarised in Table-S2. Six lines in the cohort had not been previously classified, and so we applied the surrogate cytokeratin expression method of Hollestelle et al. [1] (Fig. 2 and Table-S2). Briefly, the criteria are: Luminal phenotype: CK8/18+ and/or CK19+, CK5-; Basal-like luminal phenotype (L+B): CK8/18+ and/or CK19+, CK5+; null (claudin-low): CK8/18 low, CK19-, CK5-; basal: CK8/18 low, CK19-, CK5+. Triple-negative (TN) cell lines were sub-classified using the TNBCtype tool [3] (Table-S2).
Multiplexed flow cytometry analysis (FC)
Cells were prepared from three separate cultures as previously described [14]. Single cell suspensions were stained with SYTOX BLUE (Molecular Probes), CD49f-PE-Cy5, EpCAM-FITC, CD44-APC H7 and CD24-PE (Becton–Dickinson (BD); Table 2), or isotype and fluorophore-matched control antibodies. Raw fluorescence data were collected on either FACSAria-I or LSRFortessa flow cytometers (BD) using FACSDiva acquisition software (v6.1.3; BD). Particles and dead cells were excluded based on low light scatter and SYTOX BLUE positivity. Doublet discrimination was also performed by gating out cells with disproportionate forward scatter height and area. Positivity thresholds were determined based on the signal from isotype controls for each marker and cell line combination (Fig-S1). At least 1x10⁴ events representing live, single cells were collected for each sample. Fluorescence compensation was performed on each occasion, then retrospectively checked and modified if necessary using FCS Express software (v6.0; DeNovo). Population frequencies were determined for individual and combined parameters from an average of three cultures (consecutive passages). The proportions of luminal-1, luminal-2, basal and mesenchymal subpopulations were determined as described [2].
Immunohistochemistry (IHC)
Cultures were washed twice in PBS and then harvested with cell scrapers after soaking in versene (EDTA) for 5 min, so as not to remove trypsin-sensitive cell surface proteins. An equal volume of growth media was added before centrifuging, then washed twice in PBS, resuspended in a minimal volume of PBS and fixed in 5 mL 10% neutral buffered formalin for 30 min at room temperature. After centrifuging (200 × g), samples were washed twice in PBS before processed for paraffin embedding. A cell line TMA was then constructed from 0.6 mm cores. 4 μm TMA sections were cut for IHC. For each of the primary antibodies used, Table 2 lists the working dilution and one of the following antigen retrieval methods: heat retrieval in a decloaking chamber (Biocare Medical) with either: (EDTA) 0.001 M Tris-ethylenediaminetetraacetic acid pH 8.8, at 105 °C for 15 min; (citrate) 0.01 M citric acid buffer pH 6.0, at 125 °C for 5 min; (Chymo) 0.1% Chymotrypsin in 0.01 M CaCl2 + 0.05 M Tris buffer, pH 7.8 at 37 °C for 10 min. The Dako EnVision + (Dakocytomation) and Vectastain® Universal ABC kit (Vector laboratories) were used for detection according to the manufacturers’ instructions. The Dako HercepTest™ kit was used for HER2 staining. Sections were reviewed and described by a qualified pathologist (ACV). We used at least two separate cultures (successive passages) for each cell line.
Digital IHC analysis
Stained TMA sections were scanned on an Aperio ScanScope T2 high-resolution slide scanner (20 x magnification). Digital images were imported into Definiens Tissue Studio 3.0 for automated analysis. Cells were segmented based on nuclear haematoxylin-defined staining and antigen specific DAB-defined chromatic staining was assessed per cell either localised to nucleus for nuclear stains (ER, p53, AR) or in the cytoplasm by dilating the area segmented by the nucleus. The intensity of staining for each antigen was divided into negative, low, moderate and strong categories was verified by visual assessment of a small panel of positive and negative controls. These thresholds were then used to calculate the frequency of cells in each category across all cores in the TMAs. An overall histological score for each antigen was calculated using an algorithm that considers the frequency of cells assigned to each intensity category. Histological score = (1 x % weak + 2 x % moderate + 3 x % strong). TMA sections had to contain at least 100 cells for inclusion. Where multiple cores were analysed, an average was taken. Unsupervised hierarchical clustering was performed on the eight antigens (ER, E-cadherin, CK5, CK8/18, CK19, Vimentin, EGFR and HER2) using Euclidean distance and complete linkage method for clustering via the R Project for Statistical Computing [26].
Nanostring® targeted pancancer pathways assay
RNA was extracted from each line using the RNeasy kit (QIAGEN), then quantified using Nanodrop. We used the PanCancer Pathways Panel, a set of barcoded probes for 730 genes and 40 housekeeping genes (nanoString®). Assays and analysis were performed according to the manufacturer’s instructions using 50 ng of total RNA [9]. Data were collected using the nCounter® Dx Digital Analyzer (QIMR Berghofer) and processed using nSolver Software (v3.0 NanoString). Unsupervised clustering based on the expression of all the genes in the PanCancer Pathways panel was performed in R [26], using rank correlation as the distance metric and centroid linkage, with genes ordered by cluster tightness. Significance thresholds (p) used to assign functional enrichment were 0.01 (genes) and 0.05 (samples).
Results and discussion
Single cell biomarker profiling of key breast cancer biomarkers
Established cell lines are perpetual and (relatively) genetically and phenotypically stable, therefore a proportion of the culture population must self-renew. Keller [2] proposed that epithelial lineage differentiation hierarchies inherited from the tumour-of-origin might be maintained in cell cultures in some form, despite in vitro adherent selection and genetic drift over time. Analysis of 20 cell lines for expression of cell surface markers that discriminate luminal and myoepithelial/basal compartments in the mammary gland (EpCAM, CD49f, CD24, CD44), showed that each line exhibited a restricted version of the epithelial lineage hierarchy in normal breast, consistent with intrinsic subtype. To investigate how widespread these categories are, we performed multiplex flow cytometry analysis on 34 breast cell lines (including 26 different from the Keller study; Table 1). We assessed at least three independent cultures to encompass normal variability/plasticity (Fig. 1 and Fig-S1). Consistent with the previous findings [2], luminal lines were predominantly EpCAM+/CD49f+/CD24+, and only a few retained a ‘Luminal-1′ subpopulation (EpCAM+/CD49f−/CD24+); most notably SKBr3, which exhibits pronounced epithelioid morphology in vitro. EpCAM/CD24-negativity featured prominently in lines with mesenchymal morphology. EpCAM+/CD49f+/CD24− subpopulations were most common in basal lines, though not exclusively. Basal and claudin-low lines exhibited the most heterogeneity.
We screened the panel for expression of an additional nine biomarkers using digital (d)IHC analysis of fixed cell pellets, calculating the frequencies of cells exhibiting no, low, moderate and strong staining as a readout of heterogeneity, and integrated these data to calculate the overall Histo(H)-score for each marker in each line. (Fig. 2). Unsupervised clustering of the H-scores produced three major groups that conformed with intrinsic subtype 85% of the time (Fig. 2B). The discordant cases included two immortalised ‘normal’ lines (184A1, MCF10A), P7731, PMC42ET and HCC1143 (expression subtype for the latter two was ascribed using cytokeratin surrogate markers [1]; Table-S2). Statistically, vimentin, EGFR and ER best discriminate these groups (Fig-S2A), but a minimal panel of vimentin, EGFR, CK19 and HER2 would be most useful for classifying individual lines (Fig. 2C).
Vimentin was the only marker with categorically positive or negative expression by the majority of cells in each population. The others exhibited striking variability, with co-existence of cells exhibiting a range of staining intensities. While overall expression of lineage markers like ER, CK19 and CK8/18 and CK5 was generally associated with luminal or basal subtype, this was not exclusive or uniform. For example, ER expression was highly heterogeneous amongst the luminal lines, and cytokeratins traditionally associated with basal or luminal differentiation were often expressed in subpopulations of the ‘opposite’ subtype. For example, CK19/8/18-positivity was common in CK5+ lines classified basal-like based on the transcriptomic average of the whole culture, and CK5+ subpopulations were present in cultures of ‘luminal’ cell lines. This diversity was unlikely to be introduced by technical bias, as we analysed at least two cores per line (minimum 100 cells/core), the scoring algorithm was based foremost on nucleus recognition and none of the markers bore any relationship to the regions-of-interest analysed (Fig-S2B). The data likely reflect bona fide biological diversity in the culture dish.
Taken together, these findings are consistent with the idea [2] that cultures of established cell lines comprise diverse subpopulations, even after extensive in vitro passage. The large cohort and panel of lineage markers investigated here confirm that this at least partly reflects their maintenance of restricted differentiation hierarchies. Heterogeneous expression of lineage markers is also evident on IHC-stained human tissue sections (for example, ‘basal-like’ tumours express CK19 focally or diffusely; and luminal, CK5+ cells lacking expression of basal/myoepithelial markers (vimentin, SMA and CK14) exist in the luminal layer of normal breast tissue [27]). Determining how faithfully this resembles hierarchies in the normal breast or the tumour-of-origin is outside the scope of this study, but could be investigated using single-cell transcriptomics, or time-lapse immunofluorescence to trace successive generations in vitro.
Pan-cancer pathway analysis using digital RNA counting
In the years since the original array-based taxonomy of breast tumours and spin-off classifiers for cell lines [3,4,5], we have learned much about molecular processes that distinguish the major divisions. Technology for quantifying gene expression has also evolved considerably, including digital platforms that directly count specific RNA molecules from complex mixtures, which drastically improves dynamic range and accuracy compared with amplification/hybridisation-based methods. We applied the nanoString PanCancer Pathways panel to the cohort using the nCounter® Dx system, to quantify 730 transcripts representing 13 canonical cancer pathways. We reasoned that a pathway-focused, digital analysis may identify new phenotypic groups.
Unsupervised analysis of these data produced five separate clusters, which generally conformed with classical gene-expression subtype (Fig. 3A/S3; Table-S3), with three exceptions:

Pan-cancer pathway profiling by digital mRNA counting identifies new breast cancer cell line subgroups. a Heatmap and cluster dendrogram showing five main subgroups (grey boxes) produced by unsupervised analysis of nCounter® PanCancer pathways expression data from the cell line panel (Table-S4). The coloured tile bar indicates the most robust subgrouping based on analysis of pathways individually. b, c Identification of pathway expression patterns that discriminate subgroups. c Heatmap showing the results of one-way ANOVA tests (Tukey’s correction for multiple comparisons) comparing pathway expression in each pair of PanCan subgroups. Corrected p values less than 0.01 are shown. The luminal/HER2 group exhibited the most distinct pathway phenotypes overall (highest inverse log10 corrected p values). Chromatin modification (ChromMod) and DNA damage repair (DDR) are omitted from panel c as they did not segregate subtypes in the multiple comparison analysis. Other abbreviations: CC, cell cycle; Tx, transcriptional
-
(1)
Lines classified as ‘basal-like’ based on whole transcriptome profile or surrogate cytokeratin expression were divided: 4/7 were more similar to luminal/HER2 group (BT20, MDAMB468, HCC70 and HCC1954), while 3/7 exhibited more similarity to the claudin-low and normal groups (P7731, HCC1143 and PMC42ET, referred to as ‘basal-mesenchymal’). Indeed, analysing the expression of each pathway separately showed this basal stratification produced the lowest error (Fig. 3B). Basal and basal-mes groups were mostly discriminated by expression of PI3 K, TGFβ and transcriptional misregulation pathways (corrected p-values 2.1E−03, 4.6E−03 and 1.7E−03; Fig. 3C/S3B, Table-S4). Interestingly, basal-mes lines were indistinguishable from normal/immortalised lines by PanCancer pathway expression.
-
(2)
All five normal/immortalised lines co-segregated in this analysis (MCF10A and 184A1 have been classified as claudin-low, while 184B5, Bre80hTERT and SVCT are basal-like according to surrogate cytokeratin protein expression profiles [1] (Table-S2)). The luminal/HER2 group exhibited the most distinct phenotypes overall, marked by relatively low baseline expression of growth factor receptor signalling networks (Wnt/Hedgehog (HH), Ras, MAPK, JAK/STAT and PI3 K pathways).
-
(3)
There were two outliers in this analysis: MDAMB435, which exhibits lineage infidelity, including neuronal and melanocytic features [22, 23]; and MDAMB453, a luminal AR+ line (Fig. 2) [28].
p53 protein expression is associated with TP53 mutation status but is not a reliable surrogate in breast cancer cell lines
Functional abrogation of TP53 through germline (Li-Fraumeni syndrome) or somatic mutation is an important driver of breast cancer development, particularly in HER2+ and TN disease [29, 30]. Missense mutations can disrupt feedback signaling and/or stabilize the protein, resulting in accumulation within the nucleus (so-called “over-expression”). An optimized IHC method has recently been developed that shows p53 over-expression in serous ovarian cancer is an accurate predictor of mutation status [31], though the use of IHC as a TP53 mutation surrogate is currently not supported by the WHO/IARC [16, 17].
TP53 background is an important consideration for in vitro modelling of breast cancer, but genotype-expression relationships have not been clearly defined in cell lines. We therefore sequenced exons 4–10 of TP53 (encodes the DNA-binding domain and contains 99% of human mutations [16, 17]) in our cell line cohort, and identified mutations in 18/32 lines (56%; Table-S1). Using nanostring and dIHC data, we then analysed the relationships between TP53 mutation status, RNA and protein expression to see if expression might be a useful surrogate for loss-of-function, and whether this is impacted by protein heterogeneity. There was no association with RNA levels. p53 protein expression was higher in lines harbouring nonsynonymous mutations (p = 0.01), though there were multiple outliers in this analysis indicating that this method is not a reliable substitute for mutation analysis (Fig. 4).

p53 protein expression is associated with somatic TP53 mutations but is not a reliable surrogate. a dIHC and nCounter® data for p53/TP53, aligned next to intrinsic subtype (L, B, C) and mutations identified in exons 4–10. b, c p53 RNA and protein expression as a function of mutation status. With the exception of P7731, MDAMB436 and HCC1937, which harboured nonsense mutations likely to target transcripts for nonsense-mediated decay, lines with somatic alterations exhibited higher expression of p53 protein (p value from an unpaired, 2-tailed t test). Abbreviations: fs frameshift, indel insertion–deletion, mis missense, mod moderate, mut mutant, non nonsense, neg negative, ns not significant, wt wild-type. Underline = mutation data from the CCLE
Summary
Cell lines are extremely useful tools in breast cancer research. However, their advantages must be weighed against the limitations of modelling such a complex disease in vitro. Apart from the existence of clonal variants and phenotypic drift, we found that cultures of established lines exhibit striking heterogeneity (Fig. 5/Table-S5), at least partly reflecting maintenance of restricted lineage differentiation hierarchies in the culture dish. These factors are important to consider when selecting cell lines to test particular hypotheses, and interpreting data from in vitro assays. Targeted digital mRNA counting identified new subgroupings based on expression of important cancer pathways; notably, PanCan transcriptomes segregated basal lines into two subgroups that aligned with either luminal or mesenchymal phenotypes. This compendium of molecular profiling information has utility for informing selection of appropriate cell line models, and as a framework in which new PDCL and PDX can be characterised.

Reference table comparing study findings with published breast cancer cell line classification data. Abbreviations: B1 basal-like 1, B2 basal-like 2, CK19 cytokeratin-19, Diff states differentiation states, EGFR epidermal growth factor receptor, ERBB2 epidermal growth factor receptor-2 gene,ER oestrogen receptor, IC invasive carcinoma, LAR/lum AR + , luminal androgen-receptor, lum luminal, IM/immuno-mod immunomodulatory, M/mes mesenchymal, TN triple-negative, ST subtype, Vim vimentin. Filled triangle: transcriptome subtype determined using surrogate cytokeratin analysis ([1] and Table-S2)
Notes
Cell line nomenclature has been simplified in this paper for ease of analysis, by removing dashes and spaces (e.g. MDA-MB-231 to MDAMB231).
References
Hollestelle A et al (2009) Distinct gene mutation profiles among luminal-type and basal-type breast cancer cell lines. Breast Cancer Res Treat 121(1):53–64
Keller PJ et al (2010) Mapping the cellular and molecular heterogeneity of normal and malignant breast tissues and cultured cell lines. Breast cancer research: BCR 12(5):R87
Lehmann BD et al (2011) Identification of human triple-negative breast cancer subtypes and preclinical models for selection of targeted therapies. J Clin Invest 121(7):2750–2767
Neve RM et al (2006) A collection of breast cancer cell lines for the study of functionally distinct cancer subtypes. Cancer Cell 10(6):515–527
Prat A et al (2010) Phenotypic and molecular characterization of the claudin-low intrinsic subtype of breast cancer. Breast cancer research: BCR 12(5):R68
Smart CE et al (2013) In vitro analysis of breast cancer cell line tumourspheres and primary human breast epithelia mammospheres demonstrates inter- and intrasphere heterogeneity. PLoS ONE 8(6):e64388
Kao J et al (2009) Molecular Profiling of Breast Cancer Cell Lines Defines Relevant Tumor Models and Provides a Resource for Cancer Gene Discovery. PLoS ONE 4(7):e6146
Daemen A et al (2013) Modeling precision treatment of breast cancer. Genome Biol 14(10):R110
Barretina J et al (2012) The Cancer Cell Line Encyclopedia enables predictive modelling of anticancer drug sensitivity. Nature 483(7391):603–607
Lehmann BD et al (2016) Refinement of Triple-Negative Breast Cancer Molecular Subtypes: implications for Neoadjuvant Chemotherapy Selection. PLoS ONE 11(6):e0157368
Fillmore CM, Kuperwasser C (2008) Human breast cancer cell lines contain stem-like cells that self-renew, give rise to phenotypically diverse progeny and survive chemotherapy. Breast Cancer Res 10(2):R25
Lim E et al (2010) Transcriptome analyses of mouse and human mammary cell subpopulations reveal multiple conserved genes and pathways. Breast Cancer Res 12(2):R21
McCart Reed, A.E., et al., The Brisbane Breast Bank. Open Journal of Bioresources, 2017. In Press
Smart CE et al (2013) In vitro analysis of breast cancer cell line tumourspheres and primary human breast epithelia mammospheres demonstrates inter- and intrasphere heterogeneity. PLoS ONE 8(6):e64388
Da Silva L et al (2010) HER3 and downstream pathways are involved in colonization of brain metastases from breast cancer. Breast Cancer Res 12(4):R46
International Agency for Research on Cancer (IARC). TP53 database. Available from: http://www-p53.iarc.fr/
Bouaoun L et al (2016) TP53 Variations in Human Cancers: new Lessons from the IARC TP53 database and genomics data. Hum Mutat 37(9):865–876
COSMIC, the Catalogue Of Somatic Mutations In Cancer. Cell lines project; Available from: http://cancer.sanger.ac.uk/cancergenome/projects/cell_lines/
The Broad Institute. Cancer Cell Line Encyclopedia. Available from: http://www.broadinstitute.org/ccle/home
Nugoli M et al (2003) Genetic variability in MCF-7 sublines: evidence of rapid genomic and RNA expression profile modifications. BMC Cancer 3:13
Chambers AF (2009) MDA-MB-435 and M14 cell lines: identical but not M14 melanoma? Cancer Res 69(13):5292–5293
Hollestelle A, Schutte M (2009) Comment Re: mDA-MB-435 and M14 cell lines: identical but not M14 Melanoma? Cancer Res 69(19):7893
Nerlich AG, Bachmeier BE (2013) Density-dependent lineage instability of MDA-MB-435 breast cancer cells. Oncol Lett 5(4):1370–1374
Rae JM et al (2007) MDA-MB-435 cells are derived from M14 melanoma cells–a loss for breast cancer, but a boon for melanoma research. Breast Cancer Res Treat 104(1):13–19
Prasad VV, Gopalan RO (2015) Continued use of MDA-MB-435, a melanoma cell line, as a model for human breast cancer, even in year, 2014. NPJ Breast Cancer 1:15002
R Core Team. R: A language and environment for statistical computing. 2014; Available from: http://www.r-project.org/
Johnston RL et al (2016) High content screening application for cell-type specific behaviour in heterogeneous primary breast epithelial subpopulations. Breast Cancer Res 18(1):18
Moore NL et al (2012) An androgen receptor mutation in the MDA-MB-453 cell line model of molecular apocrine breast cancer compromises receptor activity. Endocr Relat Cancer 19(4):599–613
Alsner J et al (2000) Heterogeneity in the clinical phenotype of TP53 mutations in breast cancer patients. Clin Cancer Res 6(10):3923–3931
TCGA, Cancer Genome Atlas Network: Comprehensive molecular portraits of human breast tumours. Nature, 2012. 490(7418): p. 61-70
Kobel M et al (2016) Optimized p53 immunohistochemistry is an accurate predictor of TP53 mutation in ovarian carcinoma. J Pathol Clin Res 2(4):247–258
Forbes, SA et al (2011) COSMIC: mining complete cancer genomes in the Catalogue of Somatic Mutations in Cancer. Nucleic Acids Res 39:945–950
Acknowledgements
We would like to acknowledge the Brisbane Breast Bank for assistance with sample preparation and pathology review, and thank the following collaborators for their assistance and contributions: Tony Blick and Rik Thompson (St. Vincent’s Hospital, Melbourne and Queensland University of Technology (QUT)); Melissa Brown (UQ); Lisa Chopin (QUT); Lily Huschtscha (Westmead, The University of Sydney); Patricia Keith and Neelam Malik (UQ); Gillian Lehrbach, Chris Ormandy and Alex Swarbrick (Garvan Institute of Medical Research, Sydney); Mike McGuckin (Mater Medical Research Institute); and Sarah Roberts Thompson and Greg Monteith (UQ).
Funding
This work was supported by funding from the National Health and Medical Research Council (NHMRC program APP1017028 and APP1113867, NHMRC Project grant APP1082458), Australian Research Council (fellowship to FA, FT130101417) and the National Breast Cancer Foundation (fellowship to PTS).
Author information
Authors and Affiliations
Corresponding author
Ethics declarations
Conflict of Interest
All authors declare that they have no conflicts of interest.
Ethical approval
This article does not contain any studies with human participants or animals performed by any of the authors.
Electronic supplementary material
Below is the link to the electronic supplementary material.
Rights and permissions
Open Access This article is distributed under the terms of the Creative Commons Attribution 4.0 International License (http://creativecommons.org/licenses/by/4.0/), which permits unrestricted use, distribution, and reproduction in any medium, provided you give appropriate credit to the original author(s) and the source, provide a link to the Creative Commons license, and indicate if changes were made.
About this article

Cite this article
Saunus, J.M., Smart, C.E., Kutasovic, J.R. et al. Multidimensional phenotyping of breast cancer cell lines to guide preclinical research. Breast Cancer Res Treat 167, 289–301 (2018). https://doi.org/10.1007/s10549-017-4496-x
Received:
Accepted:
Published:
Issue Date:
DOI: https://doi.org/10.1007/s10549-017-4496-x