
Abstract
Deadwood is an extremely nitrogen (N) poor plant litter whose decomposition may rely on external N sources. Biological N2 fixation (BNF) by free-living diazotrophs, encoded with the nifH gene, is a potential pathway of N acquisition in deadwood. Still, the control of this process by tree species specific traits is hardly known. Here, we examined (1) BNF rates and nifH gene abundances in deadwood of 13 tree species after 12 years of decomposition and (2) how BNF was related to nutrient concentrations and non-structural carbohydrates (NSC). Comparing our BNF rates with the literature revealed no difference for angiosperms but gymnosperms. Large variability prevented any significant difference in BNF and nifH gene abundance between tree species identities of deadwood. Still, higher BNF and nifH gene abundances occurred in the group of diffuse-porous angiosperms compared to ring-porous angiosperms and gymnosperms. Positive relationships between BNF rates and molybdenum, phosphor, sulfur, and N suggested co-limitation of BNF by several nutrients in deadwood. Relatively high NSC concentrations indicated good carbon availability for diazotrophs. Furthermore, structural equation modeling highlighted the importance of water content for BNF and nifH gene abundance, although the overall explanatory power was low. In conclusion, BNF is a ubiquitous microbial process in deadwood of native European tree species and the comparison with other studies suggests no down-regulation of BNF by high N deposition in Central Europe.
Introduction
Deadwood is an essential ecological component in forest ecosystems, whose function as habitat and resource for xylobiontic organisms is related to its nutrient availability (Purahong et al. 2016). Among other nutrients, nitrogen (N) availability is particularly low (Rinne et al. 2017). It constrains the growth and expansion of fungal hyphae (Hodge et al. 2000) as N is, for instance, crucial for the synthesis of the fungal cell-wall constituent chitin. Low N availability can slow down the decay process of deadwood, especially during the initial phase (Noh et al. 2017). A gradual increase in N concentration with proceeding decay improves the growth conditions for xylobiontic organisms (Rinne et al. 2017; Pastorelli et al. 2020).
A part of the increase in N concentration results from the loss of carbon (C) and the simultaneous retention of N in deadwood during the decay process. Another part of N in decaying deadwood may originate from different sources. Besides the input of reactive N via atmospheric deposition as ammonia (NH3) and nitrate (Lladó et al. 2017; Romashkin et al. 2018), and the translocation of N from underlying soil into deadwood via fungal hyphae (Lindahl and Finlay 2006; Palviainen et al. 2010), asymbiotic biological N2 fixation (BNF) can contribute to N enrichment in deadwood (Boring et al. 1988). BNF in deadwood provided up to 14% of the N input (Hicks 2000). However, BNF rates can enormously vary between study sites, wood compartments, and tree species (Hendrickson 1988; Cushon and Feller 1989; Griffiths et al. 1993). Most BNF measurements originate from studies in western North America or boreal regions in Europe (Mäkipää et al. 2018a). Compared to North America or Northern Europe, atmospheric N deposition is higher in Central European forests (Borken and Matzner 2004; Bobbink et al. 2010). Therefore, the function of diazotrophs is potentially not mandatory for satisfying N demands of wood-decaying organisms. High availability of reactive N can even suppress BNF (Reed et al. 2011), though this relationship has not been reported for deadwood yet.
The process of asymbiotic BNF in deadwood depends on several factors. These include climatic (Roskoski 1980; Mäkipää et al. 2018b) and site factors, such as exposition (Gómez-Brandón et al. 2020) and seasonal differences (Roskoski 1980; Hicks 2000), but also the acidity of deadwood (Tláskal et al. 2021), and nutrient availability. Molybdenum (Mo) is a vital nutrient for BNF because of its function as a metal cofactor of the diazotrophic key enzyme nitrogenase. The nitrogenase catalyzes the reduction of N2 to NH3 and is responsible for BNF (Hardy et al. 1971). BNF rates vary with the decay stages in deadwood, but the variation is not consistent among studies. The highest BNF rates can occur in the early (Tláskal et al. 2021), intermediate (Wei and Kimmins 1998; Hicks et al. 2003; Rinne et al. 2017), or advanced decay stages (Spano et al. 1982). Those differences can be attributed to changes in the microbial community structure (Hicks et al. 2003), the need for N, particularly in early decay stages (Kuramae et al. 2019), or decreasing wood density (Mäkipää et al. 2018b). As nitrogenase is a highly energy-demanding process, C availability is another limiting factor for the activity of diazotrophs (Khan et al. 2021). Jurgensen et al. (1984) showed increasing BNF rates with decreasing total carbohydrates and water-soluble sugars within the decay process in logs of Pseudotsuga menziesii. However, a study relating BNF rates in deadwood and various non-structural carbohydrates (NSC), such as glucose, xylose, and arabinose, is not known to us. Hence, the availability of an energy source to diazotrophs can be considered limited by NSC (Khan et al. 2021), as NSC concentrations changed with decomposition: arabinose, glucose, xylose, and galactose peaked in the second decay stage at one site but remained the same at another. In contrast, fructose and mannose did not change during decay (Di Lella et al. 2019).
Deadwood of different tree species differs by lignin, cellulose, and hemicellulose composition (Rowell et al. 2005; Zhang et al. 2014), nutrient concentrations (Bonanomi et al. 2021), or decomposability (Kahl et al. 2017). However, a tree species effect on BNF is not consistent among studies, ranging from no effect (Griffiths et al. 1993; Brunner and Kimmins 2003; Hicks et al. 2003) to a significant impact on BNF in deadwood (Hendrickson 1988; Mäkipää et al. 2018a; Törmänen and Smolander 2022). Due to the missing consistent tree species effect, Hicks et al. (2003) suggested that differences are more likely to occur between angiosperms and gymnosperms, as the factors controlling the BNF mentioned above seem to differ more between angiosperms and gymnosperms rather than between individual tree species of the same group. To date, research about BNF in logs has focused mainly on gymnosperms, such as Tsuga heterophylla, Picea sitchens, Pseudotsuga menziesii, and Pinus ponderosa (Griffiths et al. 1993; Brunner and Kimmins 2003; Chen and Hicks 2003; Hicks et al. 2003) whereas few studies are available for angiosperms (Hendrickson 1988; Mäkipää et al. 2018a). A comprehensive study examining BNF in deadwood of many tree species was not yet performed to the best of our knowledge.
The BNF activity is encoded in the nifH gene within the enzyme complex nitrogenase (Hsu and Buckley 2009). The presence and expression of these genes highly depend on deadwood tree species, decay stage, and the N concentration in the logs (Hoppe et al. 2014). However, studies relating the nifH gene quantity with the BNF rate in deadwood are rare (Mäkipää et al. 2018b). The existing literature focuses either on one tree species (Gómez-Brandón et al. 2020; Tláskal et al. 2021) or on the diazotrophic abundance without a relation to BNF rates (Hoppe et al. 2014; Gómez-Brandón et al. 2020). Due to limited knowledge of diazotrophic abundance and activity in deadwood of temperate forest sites, it is unclear how factors, such as C, NSC, and nutrients, influence the abundance of diazotrophs and the process of BNF or vice versa.
This study was part of a long-term experiment on deadwood decay of 13 tree species at nine forest sites at the Hainich-Dün exploratory in Central Germany. Our objective was to assess BNF rates and nifH gene copy numbers in logs of 13 tree species after 12 years of decay and identify potential relationships between wood traits and BNF rates. Moreover, we compiled available BNF rates in deadwood from the literature, considering tree species, location, and applied method, and compared the BNF rates with this study. We hypothesized that (1) BNF rates differ between tree species or between phylogenetic clades (gymnosperms, ring-porous, and diffuse-porous angiosperms) because of differences in deadwood traits, (2) nifH gene abundance is higher in angiosperms than in gymnosperms, and BNF correlate positively to nifH gene abundance, and (3) BNF rates increase with increasing concentrations of nutrients and NSC. Moreover, we used a structural equation model (SEM) to examine direct and indirect relationships between BNF rate, nifH gene abundance, nutrients, NSC, water content (WC), and respiration rate.
Material and methods
Study region and experimental design
This study was part of the long-term experiment BELongDead within the Biodiversity Exploratories project, which focuses on the interactions of tree species, microbial communities, and local conditions at three exploratories in Germany (Schwäbische Alb, Schorfheide-Chorin, and Hainich-Dün). In each exploratory, forest plots with different management intensities in threefold repetition were chosen to represent local management practices (Kahl et al. 2015).
The forests in the Hainich-Dün exploratory in Central Germany (50°56′14’’-51°22′43’’N/10°10′24’’–10°46′45’’E) were dominated by European beech (Fagus sylvatica). The study region was characterized by mean annual temperatures of 6.5 to 8 °C, mean annual precipitation of 500 to 800 mm, and altitude from 285 to 550 m a.s.l. Soils were characterized as Luvisols and Stagnosols, which developed on calcareous bedrock with a loess layer (Fischer et al. 2010; Kahl et al. 2017). N deposition was 10.1 ± 0.8 kg ha−1 per vegetation period in the Hainich-Dün exploratory (Schwarz et al. 2014). Different forest management practices include selective timber forest, timber forest, and unmanaged forest (Fischer et al. 2010).
On each of the nine experimental plots in Hainich-Dün, all located in European beech forests, the BELongDead experiment was established in the winter of 2008/09. Freshly cut logs (4 m length, ~ 31 cm diameter) of 13 tree species were placed on the soil in random order within 1 m distance to each other. The 13 tree species included four gymnosperms (Larix decidua, Picea abies, Pinus sylvestris, and P. menziesii), seven diffuse-porous angiosperms (Acer spp., Betula pendula, Carpinus betulus, F. sylvatica, Populus spp., Prunus avium, and Tilia spp.) and two ring-porous angiosperms (Fraxinus excelsior and Quercus spp.) (Kahl et al. 2017). All logs originated from the state forest of the Federal State of Thuringia in Central Germany and were thus grown under similar climatic conditions.
Sample collection
In June 2020, deadwood samples were cut laterally with an electric saw from the outer 7 cm of each log. Deadwood samples consisted almost exclusively of sapwood, but mixtures of sapwood and heartwood were taken from Quercus logs due to the decay and loss of sapwood. One part of the sample was stored in a plastic bag in the field and kept cool (~ 5 °C) until further treatment. A second part of the sample (sawdust) was transferred into a 15 mL falcon tube in the field. After that, 10 mM bromodeoxyuridine (BrdU) was added sufficiently until the sawdust was completely soaked with solution. The falcon tubes were placed in an upright position and covered with aluminum foil, followed by incubation at room temperature for 48 h. The samples were then frozen at −80 °C in the laboratory before the characterization of the abundance of metabolically active diazotrophs (see below).
BNF
At the laboratory, deadwood samples (~ 20 cm3) were saturated with water for 16 h to achieve maximum water holding capacity in all samples, then drained, and weighted into glass flasks (~ 131 mL, Media Bottle Rasotherm ISO, GL45). After five days of acclimatization in the dark at 20 °C, the lids were equipped with a 6 mm thick chlorobutyl septum. After closure, the glass flasks were flushed for 10 min with a prepared gas mixture consisting of 8% oxygen (O2), 30% nitrogen (N2), and 62% helium (Riessner-Gase GmbH, Lichtenfels, Germany). To determine the BNF rate (Weaver and Danso 1994), 25 mL of acid-washed 15N2 (99.1%, batch number MBBC7366, Sigma-Aldrich Inc., St. Louis, MI, USA) was added to each glass flask using a syringe. The gas pressure was measured before and after the addition of 15N2 to calculate the exact proportion of 15N2 in the headspace of glass flasks. After adding 15N2, the samples were incubated at 20 °C for 72 h in the dark. The flasks were then opened, and the samples were immediately dried at 60 °C for at least 72 h until mass constancy to terminate the incubation and to determine the water content. Dried samples were ground at low temperatures using a ball mill (MM400, Retsch GmbH, Haan, Germany). Incubated and respective non-incubated subsamples were analyzed for δ15N signatures and N concentration at the Centre for Stable Isotope Research and Analysis, Göttingen, using an element analyzer (Euro EA 3000, EuroVector S.p.A., Milano, Italy), coupled to a Delta C isotope mass spectrometer with a ConFlo III interface (Thermo Electron, Bremen, Germany) and an element analyzer (Euro MA 3000, EuroVector S.p.A., Milano, Italy), coupled to a Delta C isotope mass spectrometer with a ConFloII interface (Thermo Electron, Bremen, Germany) for natural abundance and 15N enriched samples, respectively.
As certified 15N2 gas (Sigma-Aldrich Inc., St. Louis, MI, USA) contained significant amounts of NH3 and N oxides (Dabundo et al. 2014), the 15N2 gas was acid-washed before adding to deadwood samples. For this purpose, an acid solution with a pH of 3 to 4 was produced by adding 100 mL deionized water and ~ 2 µL of 2 M H2SO4 (95%, Chemsolute, Th. Geyer GmbH & Co.KG, Renningen, Germany) to a 650 mL glass flask. The flask was closed with a screw cap and a gas-tight, 6 mm thick chlorbutyl septum. After that, the bottle was evacuated to 200 mbar, flushed with helium for 15 min, and then shaken overhead (6 rpm) for 1 h. This procedure of evacuating, flushing, and shaking was repeated three times. Afterwards, the bottle was evacuated to 200 mbar, and 15N2 gas was transferred directly from the 15N2 gas container to the flask up to a pressure of ~ 2200 mbar. The glass flask was shaken overhead for 1 h, left standing overnight, and shaken again for 1 h before use. Gas pressure measurements determined the proportion of 15N2 in the headspace before and after 15N2 addition. Finally, the purification and repeated refilling with the 15N2 gas amounted to a 15N2 concentration of 98 to 99% in the headspace of the 650mL glass flask. To determine potential contamination of the 15N2 gas, four wood samples were autoclaved at 121 °C with 1 bar overpressure for 20 min. The samples were incubated and processed as described above. The enrichment in the δ15N signature in the autoclaved deadwood samples was neglectable (0.003 ± 0.0007 µg 15N per ml 15N2).
After the conversion of δ15N signatures of enriched and non-enriched (natural abundance, NA) deadwood samples into 15N atom fractions, BNF rates (µg N g−1 d−1) referring to the dry weight of deadwood was calculated using Eq. 1:
where N is the amount of N in deadwood (µg), 15Nenriched is 15N atom% in deadwood after incubation, 15NNA is the 15N atom% natural abundance in deadwood, DW is the dry weight of deadwood (g), t is the incubation time (d), and HS is the ratio of 15N2 to total N2 in the headspace of incubation flasks.
Respiration rate
The respiration rate of deadwood was determined by measuring the increase in carbon dioxide (CO2) concentration during the incubation. Gas samples of 100 µL were taken with a syringe from the glass jars after 21 h (t1) and 45 h (t2) after flushing with the CO2-free gas mixture at t0 (see above). The gas samples were directly injected into a gas chromatograph (SRI 8610C, SRI Instruments, Torrance, CA, USA) equipped with a flame ionization detector coupled to a methanizer catalyst. Certified gas standards (10,000 and 20,000 ppm CO2, Riessner Gase, Lichtenfels, Germany) were used to calibrate the gas chromatograph.
The respiration rate (µg C g−1 h−1) was calculated using Eq. 2:
where ΔCO2 Δt−1 (ppm h−1) is the change in CO2 concentration within the incubation flasks during the incubation, assuming that the initial CO2 concentration was 0 ppm after flushing, Vgas (m3) is the gas volume of the incubation flasks, DW (g) is the dry weight of the deadwood sample, ρair (Pa) is the air pressure, R (8.314 J K−1 mol−1) is the gas constant, Tair (K) is the air temperature, and M (g mol−1) is the molar mass of C.
NSC and elemental analyzes
The concentrations of ethanol-soluble NSC were measured at the Max Planck Institute of Biogeochemistry, Jena, as reported earlier (Landhäusser et al. 2018). Briefly, 1.5 mL of 80% ethanol was mixed with 30 mg of ground wood sample and heated to 90 °C. After cooling down to room temperature, the mixture was centrifuged at 13,000 g for 1 min. The supernatant was filtered, and about 1 mL was injected into a High-Performance Anion Exchange Chromatograph with Pulsed Amperometric Detection (DIONEX ICS-3000 with CarboPac columns, Thermo Fisher Scientific Inc., Waltham, MA, USA) to analyze concentrations of glucose, arabinose, xylose, galactose, and total NSC. We assumed that starch was not present in deadwood after 12 years of decay.
Moreover, the concentrations of calcium (Ca), magnesium (Mg), potassium (K), phosphor (P), sulfur (S), manganese (Mn), and Mo were determined using pressure digestion. 1 g of dried wood sample was filled in vessels, and 12 mL of HNO3 (65%, Chemsolute, Th. Geyer GmbH & Co.KG, Renningen, Germany) was added. The mixture was microwaved (MARS6, CEM Corporation, Matthews, NC, USA) and filtered using sterile syringe filters (0.45 µm). Afterwards, the supernatant was analyzed at the Analytical Chemistry Lab, University Bayreuth, using an ICP-MS (Agilent 7500ce, Cetac ASX-510, Santa Clara, CA, USA) for Mo and an ICP-OES (Varian, Vista-Pro radial, Palo Alto, CA, USA) for Ca, Mg, K, P, S and Mn according to manufacture’s instructions. The C concentration was analyzed with a vario Max CN element analyzer (elementar Analysensysteme GmbH, Hanau, Germany) With the concentrations of C and N (see above), the CN ratio was calculated.
In-situ deadwood BrdU labeling and molecular biological analysis
For in-situ labeling with BrdU, 1 mL of 10 mM BrdU solution (Sigma-Aldrich Inc., St. Louis, MI, USA) was added directly after sampling to each deadwood sample (~ 1 g) and incubated in sterile 50 mL tubes covered with aluminum foil with loose cap for 48 h at room temperature as explained earlier (Purahong et al. 2022). Only the metabolically active, replicating cells can incorporate the BrdU during DNA synthesis (McMahon et al. 2011). According to the manufacturer’s instructions, DNA was extracted from the BrdU-treated deadwood samples using Quick-DNA Fecal/Soil Microbe Miniprep Kit (Zymo, California, USA). We named this total DNA as it included all types of genomic DNA (dormant cells, dead cells, metabolically active, and replicating cells). As outlined earlier (McMahon et al. 2011; Purahong et al. 2022), this immunocapture approach was employed to separate the BrdU-labeled DNA from the total DNA. Briefly, for each sample, 2 μL monoclonal BrdU antibodies (1 mg μL–1 mouse anti-BrdU, clone BU-33, Sigma-Aldrich Inc., St. Louis, MI, USA) were added to 18 mL denatured herring sperm DNA (1.25 mg mL–1 in phosphate buffer saline (PBS), Promega, Walldorf, Germany), and then incubated for 45 min at 30 °C to form antibody-herring sperm DNA complex. Denatured sample DNA (25 μL; ∼200 ng DNA + 10 μL PBS) was then mixed with antibody-herring sperm DNA complex and incubated for 30 min at 30 °C to capture BrdU-labeled DNA. 6.26 µL washed Dynabeads™ Goat Anti-Mouse IgG (Invitrogen, Life Technologies GmbH, Darmstadt, Germany) were then added to the incubated solution and rotated (66 rpm) for 30 min at room temperature on an RM-2 roll mixer (Carl Roth GmbH, Karlsruhe, Germany) to form the Dynabead complex (Dynabead-BrdU antibodies-BrdU-labeled DNA). After that, the Dynabead complex was treated eight times with 100 μL PBS–BSA solution (0.05 g bovine serum albumin in 50 mL phosphate-buffered saline) and washed with a DynaMag™-2 (Invitrogen, Life Technologies GmbH, Darmstadt, Germany). BrdU-labeled DNA was isolated from the washed Dynabead complex by adding 20 μL BrdU solution (1.7 mM) followed by 35 min incubation under slow rotation. Finally, the BrdU-labeled DNA was separated from the Dynabeads using a DynaMag™ -2 (Life Technologies GmbH, Darmstadt, Germany), thereafter named active DNA.
The abundance of nifH gene copy numbers in deadwood samples of the total and active DNA fraction was accessed by quantitative PCR (qPCR). Diazotrophic gene copy numbers were quantified by the primer set PolF and PolR (Poly et al. 2001). All reactions were performed in 96-well plates using the CFX96™ Real-Time System (Bio-Rad Laboratories GmbH, Feldkirchen, Germany), and nuclease-free master mix blanks were run as a negative control. Gene copy number was calculated by comparing PCR-cycle threshold values (CT) to a standard curve of triplicate tenfold dilutions of genomic DNA. Genomic DNA extracted from a culture of Azotobacter vinelandii (DSM 2289) by employing the Quick-DNA Fecal/Soil Microbe Miniprep Kit was used to establish quantification standards for generating a standard curve. Petroff counting chamber (Paul Marienfeld GmbH, Germany) was used to determine the genomic DNA concentration (gene copies µL−1). A five‐point tenfold serial dilution of the A. vinelandii genomic DNA (10–100,000 fg) was run in triplicate with each set of reactions to generate the standard curve. For nifH gene-based qPCR, the reactions were performed in 10 µL assays containing 5 µL SYBR® Green Supermix (Bio-Rad Laboratories GmbH, Feldkirchen, Germany), PolF and PolR primers (0.5 µL each of the primer (2.5 µM)), 3 µL sterile and nuclease-free water (Carl Roth GmbH, Karlsruhe, Germany) and 1 µL of either 1:10 diluted DNA-extract, ten-fold diluted standard DNA or 1 µL water as no template control. After an initial denaturation at 94 °C for 5 min, 40 amplification cycles (regardless of the active or total fraction) were performed for 1 min at 95 °C (denaturation), 1 min at 55 °C (annealing), and 1 min 30 s at 72 °C (extension), followed by a final extension of 5 min at 72 °C. Runs were completed with a melting analysis starting from 65 °C to 95 °C with temperature increments of 0.5 °C and a transition rate of 5 s to check for product specificity and potential primer dimer formation. The purity of the amplified products was checked by electrophoresis on a 1.5% agarose gel. Multiple dilutions (non-dilution, with 1:10 and 1:100 dilution) were run simultaneously to check for inhibitors in qPCR assays. We observed no inhibition as the CT value shifted for each decimal dilution step in the same CT gap. CT and efficiency were calculated automatically by the Bio-Rad software CFX manager version 3.1. Both, total and active nifH gene copy numbers refer to the dry mass of deadwood samples.
Data collection from the literature
Available BNF rates in deadwood were compiled to the best of our knowledge to compare our BNF rates with the values from the literature (Online Resource Table S1). BNF rates were taken from tables or graphs and transformed into µg N g−1 d−1 when values were only presented as ethylene production, based on the acetylene reduction assay (ARA, see Hardy et al. (1971)). For the transformation, we used deadwood studies in which ARA was calibrated with the 15N2 approach (Roskoski 1981; Silvester et al. 1982; Silvester 1989; Chen and Hicks 2003; Hicks et al. 2003; Burgoyne 2007; Burgoyne and DeLuca 2009; Benoist et al. 2022). A mean ratio of 3.9:1 (range from 0.8:1 to 8.5:1) was used to estimate the BNF rate from ethylene production. Information about phylogenetic clade, tree species, deadwood age, decay stage, location, climate zone, incubation method, and incubation temperature were summarized for an overview of BNF in deadwood (Online Resource Table S1).
Statistical analyses
Statistics were performed using R version 4.0.4 (R Core Team 2021) with additional packages. Data were screened visually for outliers with box plots and Cleveland’s dot plots. Normal distribution was checked with histograms, quantile–quantile plots, and the Shapiro–Wilk-Test. Significant differences (p < 0.05) were calculated using the Kruskal–Wallis-Test and pairwise Wilcoxon Rank Sum test for non-normal distributed data between tree species and phylogenetic clades (gymnosperms, diffuse-porous and ring-porous angiosperms). Due to the non-normal distribution of the data, correlations were assessed with Spearman’s rank correlation coefficient. Graphics were generated with the package ggplot2 (Whickham 2016).
To find direct and indirect effects of nifH gene abundance, BNF rate, respiration rate (as a proxy for fungal activity), WC, NSC, Mo, P, and N, a SEM was applied. Before analysis, a theory model with possible connections was built based on theoretical knowledge (Online Resource Fig. S1) and the significant correlation of BNF with all measured parameters. The package piecewiseSEM version 2.1.0 (Lefcheck 2016) was used for the analysis, as plot identity was included as a random factor. Before fitting the piecewise SEM, the single linear mixed-effect models within the SEM were checked for meeting model assumptions, using the package nlme version 3.1–152 (Pinheiro et al. 2021). For the piecewise SEM, the model fitting and the detection of missing paths were accomplished by Fisher’s C and Shipley’s test of d-separation, respectively (Shipley 2013). Models were considered valid when the model’s p-value was > 0.05 and the degrees of freedom (df) > 1, meaning that the piecewise SEM was not different from our data but displayed the data. For endogenous, response variables (BNF, nifH gene abundance, and respiration rate), a conditional Rc2 is given. Standardized path coefficients determine relationships between variables.
Results
BNF rates compared to the literature
BNF rates from the BELongDead experiment ranged from 0.05 to 0.10 µg N g−1 d−1 in the gymnosperms and from 0.03 to 0.28 µg N g−1 d−1 in the angiosperms (Fig. 1). The median BNF rates in the gymnosperms were significantly (p = 0.04) lower in the literature (0.005 µg N g−1 d−1) compared to the BELongDead experiment (0.075 µg N g−1 d−1). In contrast, angiosperms in the literature fixed similar N (both 0.14 µg N g−1 d−1). Deadwood of gymnosperms exhibited significantly (p = 0.02) lower BNF rates than angiosperms in the literature, but not in the BELongDead experiment.

BNF rates in deadwood of angiosperm (a) and gymnosperm (g) tree species from the BELongDead experiment (BLD) and the literature (lit). For the BNF rates in the BELongDead experiment, the mean for each tree species was calculated. For the literature, one mean BNF rate per study was calculated. Corresponding references and BNF rates are given in Online Resource Table S1. The number of repetitions (n) per boxplot is given above the boxplot. Boxplots show the median of the values. Each boxplot's upper and lower edges represent the 25 and 75% quartile, respectively. The whiskers represent the 1.5 × inter-quartile range. Points beyond the whiskers are outliers. Significant differences between all boxplots are denoted as capital letters (p < 0.05)
BNF and nifH gene abundance
The highest median BNF rates were detected in Populus (0.30 µg N g−1 d−1), Tilia, and Fraxinus (both 0.16 µg Ng−1 d−1), whereas the lowest rates occurred in Fagus (0.03 µg N g−1 d−1), Quercus, and Larix (both 0.02 µg N g−1 d−1) (Fig. 2). Tree species had no significant effect on BNF due to the large variation within each tree species. However, BNF rate was significantly (p = 0.04) lower for gymnosperms (0.05 µg N g−1 d−1) than for diffuse-porous angiosperms (0.09 µg g−1 d−1). In contrast, ring-porous angiosperms’ BNF rates were not significantly different from gymnosperms and diffuse-porous angiosperms.

BNF rates in deadwood after 12 years of decomposition of 13 tree species. Boxplots show the median of the values. Each boxplot’s upper and lower edges represent the 25 and 75% quartile, respectively. The whiskers represent the 1.5 × inter-quartile range. Points beyond the whiskers are outliers. Significant differences between phylogenetic clades are denoted as capital letters (p < 0.05)
The total nifH gene abundance within the logs of all tree species was averaged at a median of 19.2 \(\times\) 106 copies g−1, ranging from 0.2 to 239.5 \(\times\) 106 copies g−1 (Fig. 3a). Low abundances were found in Quercus (7.2 \(\times\) 106 copies g−1) and Picea (7.3 \(\times\) 106 copies g−1) compared to higher abundances in Populus (53.1 \(\times\) 106 copies g−1), Tilia (48.4 \(\times\) 106 copies g−1), and Betula (46.0 \(\times\) 106 copies g−1). A tree species effect on the total nifH gene abundance could not be detected, but all diffuse-porous angiosperms (27.3 \(\times\) 106 copies g−1) had significantly higher (p = 0.01) abundances than the gymnosperms (13.0 \(\times\) 106 copies g−1).

Abundance of total (a) and active (b) nifH gene copy numbers in deadwood after 12 years of decomposition of 13 tree species. Boxplots show the median of the values. Each boxplot's upper and lower edges represent the 25 and 75% quartile, respectively. The whiskers represent the 1.5 × inter-quartile range. Points beyond the whiskers are outliers. Significant differences between phylogenetic clades are denoted as capital letters (p < 0.05)
The active nifH gene abundance ranged from 0.0016 \(\times\) 106 copies g−1 to 5.2 \(\times\) 106 copies g−1 with a median of 0.11 \(\times\) 106 copies g−1 (Fig. 3b). No significant differences occurred between tree species or phylogenetic clades. The highest values were found in Tilia (0.99 \(\times\) 106 copies g−1) as opposed to the lowest values in Quercus and Picea (both 0.04 \(\times\) 106 copies g−1). Diffuse-porous angiosperms (0.18 \(\times\) 106 copies g−1) showed slightly higher abundances than ring-porous angiosperms (0.13 \(\times\) 106 copies g−1) and gymnosperms (0.09 \(\times\) 106 copies g−1). The active diazotrophic community accounted for 0.06 to 11.4% of the total nifH gene abundance based on BrdU analysis.
Relationship between BNF and nifH gene abundance
Correlating BNF and total nifH gene abundances showed a non-significant linear increase (R = 0.18, p = 0.62) (Fig. 4). However, low BNF rates occurred when low total nifH gene abundances were observed. Higher total nifH gene abundances resulted in only a slight increase in the BNF rate. The highest BNF rates appeared seemingly arbitrary when only a low total nifH gene abundance was present. Compared to the total nifH gene abundance, the active diazotrophic abundance had less effect on the BNF rate (R = 0.053, p = 0.58) (data not shown). Even though only a small number of diazotrophs were metabolically active, their activity did not correlate with BNF. Apart from BNF rates, active and total nifH gene abundances were significantly correlated with each other (R = 0.67, p < 0.001) (data not shown).
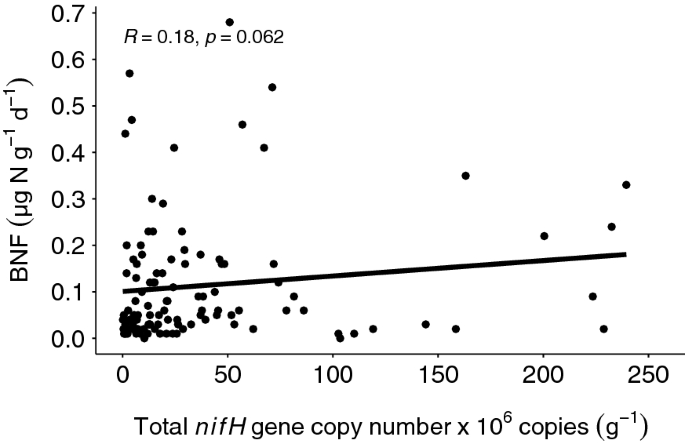
Relationship between BNF rates and total nifH gene abundance of logs from 13 tree species
Respiration rate
The respiration rate in deadwood ranged from 1 to 58 µg C g−1 h−1 (Fig. 5). The effect of tree species was significant (p < 0.001) between some tree species, mainly angiosperms to gymnosperms. The highest rates occurred in Tilia (29 µg C g−1 h−1) and Carpinus (28 µg C g−1 h−1) compared to the lowest rates in Picea and Pinus (both 8 µg C g−1 h−1). Diffuse-porous (21 µg C g−1 h−1) and ring-porous angiosperms (20 µg C g−1 h−1) showed significantly (p < 0.001 and p = 0.02, respectively) higher respiration rates than gymnosperms (8 µg C g−1 h−1). Respiration rate had a significant effect on BNF (R = 0.29, p = 0.002) (Online Resource Fig. S2).

Respiration rate in deadwood after 12 years of decomposition of 13 tree species. Boxplots show the median of the values. Each boxplot's upper and lower edges represent the 25 and 75% quartile, respectively. The whiskers represent the 1.5 × inter-quartile range. Points beyond the whiskers are outliers. Significant differences between phylogenetic clades are denoted as capital letters, between tree species in small letters (p < 0.05)
NSC and nutrient concentrations in deadwood and relationships to BNF
Deadwood showed a wide variety of glucose (0 to 8 mg g−1), arabinose, xylose (both 0 to 1.1 mg g−1) and galactose (0 to 0.2 mg g−1) (Table 1). The most abundant NSC was glucose, with around 74% of total NSC. Diffuse-porous angiosperms showed higher glucose, xylose, and total NSC concentrations than ring-porous angiosperms and gymnosperms. Differences were partly significant, especially for angiosperms and gymnosperms. C concentrations were similar for all deadwood logs (~ 47%).
Similar to NSC, nutrient concentrations showed a great spread within the deadwood logs, such as Mo (0 to 1.6 µg g−1), Ca (0.2 to 17.5 mg g−1), Mg (0.04 to 2.5 mg g−1), K (0.03 to 4 mg g−1), P (0 to 0.6 mg g−1), S (0.03 to 0.9 mg g−1), and Mn (0 to 1.4 mg g−1) (Table 2). Diffuse-porous angiosperms showed significantly higher concentrations of Mg (p < 0.001) and non-significant higher concentrations of Mo, Ca, P, S, and Mn compared to ring-porous angiosperms and gymnosperms. Significant differences for S were found between diffuse-porous angiosperms and gymnosperms (p = 0.008). Mo and P did not show significant differences between phylogenetic clades.
The relationship between BNF, NSC and nutrients, including N, was investigated using a Spearman rank correlation coefficient (Online Resource Fig. S2). There were significant, slightly positive correlation between BNF and Mo (R = 0.21, p = 0.04), P (R = 0.26, p = 0.007), S (R = 0.22, p = 0.02), and N (R = 0.43, p < 0.001). Glucose had an almost significant positive effect on BNF (R = 0.18, p = 0.06). Concentrations of Mn, Ca, Mg, K, xylose, galactose, and total NSC had a non-significant effect on the BNF rate.
Structural equation modeling
As variability in BNF rates and nifH gene abundance could not be explained by tree species and only partially by a variety of other factors (see above), a SEM was applied to determine both direct and indirect effects of the significant, most correlated parameters on BNF and nifH gene abundance (Fig. 6). The SEM revealed that the selected parameters only partially explained the nifH gene abundance (Rc2 = 0.15) and the BNF rates (Rc2 = 0.10). BNF rates were significantly correlated with WC (standardized path coefficient 0.27, p = 0.02), while nifH gene abundance was significantly correlated to total NSC (standardized path coefficient 0.28, p = 0.006) and WC (standardized path coefficient 0.35, p = 0.004). No significant correlation was found between nifH gene abundance and BNF (standardized path coefficient 0.06, p = 0.59).

Structural equation model for logs from 13 tree species after 12 years of decomposition, relating BNF, nifH gene abundance, respiration rate, NSC, WC, N, P, and Mo. Single-headed arrows indicate a direct effect of one parameter on the other, whereas double-headed arrows indicate a mutual relationship between two parameters. Standardized path coefficients are shown next to the arrow. Solid lines indicate significant and dashed lines non-significant effects (p < 0.05). Rc.2 is given under the endogenous parameter. Model Fisher’s C 7.271 (p = 0.51, df = 8)
Discussion
BNF in deadwood – comparison to the literature
Substantial BNF rates in deadwood were observed in almost all studies, but the variability within and among the studies is high. As we found no significant differences between individual tree species (see below), we compared available BNF rates of angiosperms and gymnosperms. Despite different techniques, decay stages, and incubation temperatures (Online Resource Table S1), median BNF rates of angiosperms were similar in our study and the literature. By contrast, BNF rates of gymnosperms were 15 times higher in our study than in the literature (Fig. 1). We attributed the high BNF rates of gymnosperms in our study primarily to the N saturation of forests in Central Europe, resulting from decades of increased N deposition (Borken and Matzner 2004; Ackerman et al. 2019). All other studies on BNF in deadwood of gymnosperms were performed in North America or Northern Europe, where N deposition is much smaller (Ackerman et al. 2019). Since specific N availability is required to develop and establish diazotrophic communities (Reed et al. 2011), low initial N concentrations may particularly limit BNF in deadwood of gymnosperms (see below). The fact that no difference was found for deadwood of angiosperms between our study and the literature could be explained by generally higher N concentrations in angiosperm deadwood.
Different measurement techniques probably caused differences in BNF rates between our and other studies. Previous studies almost exclusively used ARA as an indirect measurement of nitrogenase activity (Hardy et al. 1971). Methodological problems could have led to an over- or underestimation of BNF rates. These include highly variable conversion factors from reduced acetylene (ethylene) to fixed N2 in deadwood and other substrates (Soper et al. 2021) or the dampening activity of acetylene on nitrogenase (de Bont and Mulder 1976). Additionally, contamination of the 15N2 gas by reactive N overestimates BNF rates (Dabundo et al. 2014), particularly in N poor habitats such as deadwood. Thus, removing reactive N from 15N2 gas and sterilized controls is a prerequisite for the correct determination of BNF rates.
No tree species effect on BNF
Our first hypothesis that tree species influence BNF in logs was not confirmed. The variability of BNF was high within each of the 13 tree species and therefore did not result in any statistically verifiable difference. Still, higher BNF rates were found in diffuse-porous angiosperms than in gymnosperms, perhaps due to better nutrient availability for diazotrophs (see below). The greater mass loss of those logs (Kahl et al. 2017) also indicates the higher activity of deadwood degrading fungi and more readily available NSC in diffuse-porous angiosperm logs. Low BNF rates in Quercus and gymnosperm logs correlate with high phenolic compounds, which suppress the microbial activity and decay of deadwood (Aloui et al. 2004; Kahl et al. 2017). Hence, different levels of nutrients, phenolic compounds, and decay stages could have contributed to the high variability of BNF between the 13 tree species.
In contrast to our study, some studies reported an effect of tree species on BNF. Those studies mainly examined differences between gymnosperms, such as Picea sitchens, Pinus ponderosa, P. menziesii, or Tsuga heterophylla (Griffiths et al. 1993; Chen and Hicks 2003; Hicks et al. 2003). Of the few studies comparing angiosperms and gymnosperms, Populus tremuloides exhibited two to four times higher BNF rates than Acer rubrum, Betula papyrifera, Pinus resinosa, and Pinus strobus and ten times higher BNF rates than Picea glauca (Hendrickson 1988). Likewise, Mäkipää et al. (2018a) reported higher BNF rates in P. abies than B. pendula. However, large differences in BNF rates are also known for the same tree species as for F. sylvatica and P. abies (Mäkipää et al. 2018a, b; Rinne et al. 2017; Tláskal et al. 2021). This shows that differences between tree species cannot be generalized, and that local factors and deadwood traits could affect the BNF rates.
Abundance of nifH genes and relation to BNF
We could not find a tree species effect on nifH gene abundance or a positive relationship between BNF and nifH gene abundance, leading to rejecting the second hypothesis. Analogous to the total nifH gene abundance, we could not find a correlation between BNF and active diazotrophs. Based on BrdU labeling, only 0.1 to 11.4% of the diazotrophs were metabolically active under field conditions, suggesting an immense potential for diazotrophs in deadwood. Incubation under laboratory conditions with adjusted temperature and WC could have increased the BNF rate, while the activity status in the diazotrophic community was recorded directly at the field site. An in-situ 15N2 incubation might have resulted in a closer relationship between BNF and active diazotrophs. Consistent with our study, Mäkipää et al. (2018b) found no association between BNF and nifH genes in deadwood. We cannot exclude an underestimation of active diazotrophs by incomplete BrdU uptake during the 48 h incubation, especially of slow growing taxa (Wahdan et al. 2021). Moreover, specific diazotrophic community patterns could be responsible for the observed patterns in BNF (Das et al. 2020; Wu et al. 2021). It was shown that the nifH gene abundance is not inevitable the best proxy for diazotrophs, as pseudo-nifH sequences could over- or underestimate the diazotrophic abundance during sequencing (Mise et al. 2021). More research is needed to improve our understanding of nitrogen fixation rates and functioning of diazotrophs' nitrogenase enzyme.
Relation between BNF and NSC and nutrients
Our third hypothesis was not confirmed, as BNF rates did not increase with the increasing concentration of NSC in logs. However, glucose showed a weak positive relationship with BNF and made up 47% of total NSC. Glucose is an intermediate of cellulose degradation, and its concentrations in our samples are in the range reported in another study (Di Lella et al. 2019). The exceptional NSC availability in deadwood becomes evident when comparing glucose availability in other habitats of free-living diazotrophs, such as soils with 1,000 to 10,000 times lower NSC concentrations (Ratnayake et al. 2013). Despite strong competition for resources among different fungi and other organisms (Hiscox et al. 2018), the supply of NSCs to diazotrophic organisms appears to be relatively good over many years of log decay. NSC is an energy source for many diazotrophs (Khan et al. 2021), and C availability was shown to drive BNF (Vitousek et al. 2002). However, the addition of glucose to deadwood led to decreased BNF rates (Hendrickson 1991). Some diazotrophs, abundant in deadwood, utilize methane as energy and carbon source instead of NSC (Mäkipää et al. 2018b), especially when methane levels in deadwood are higher than in the atmosphere (Covey et al. 2016). Other simple C compounds like methanol can also be utilized by some diazotrophs (Benoist et al. 2022). This repertoire of C sources would reduce the direct dependency of many diazotrophs on glucose, although glucose can be degraded to methane via fermentation processes under anoxic conditions.
Except for C, deadwood is an extremely nutrient-poor habitat in which several nutrients could concurrently limit the growth of diazotrophs. Differences in BNF rates between logs of diffuse-porous angiosperm and gymnosperm species could be related to the generally lower nutrient levels in deadwood of gymnosperms. Nitrogen had the most positive relation with BNF among various analyzed nutrients, suggesting severe N limitation of diazotrophs. Reed et al. (2011) postulated that the growth of diazotrophs or BNF could be limited at extremely low N availability. With initial N concentrations often < 0.1%, deadwood is much more N-depleted than leaf and needle litter with 0.5 to 0.6% N (Taylor et al. 1989; Peršoh and Borken 2017; Rinne et al. 2017). It is still uncertain whether low N availability in deadwood can hamper the establishment of diazotrophic communities. Yet, other N sources could contribute to the initial development of diazotrophs and fungi in logs. Atmospheric deposition together with canopy leaching represent a possible pathway for uptake of inorganic and organic N. In the Hainich-Dün exploratory, atmospheric N deposition was relatively high with 10 kg N ha−1 per vegetation period (Schwarz et al. 2014) as compared to other regions during the time of the BNF studies, such as northwest America and northern Europe (0.8 to 6 kg N ha−1 yr−1) (Sollins et al. 1980; Vitousek 1994; Merilä et al. 2014). Elevated N deposition in Central Europe could positively affect BNF in the initial phase of log decay since the N level in wood, especially of coniferous tree species, is very low (Kahl et al. 2017). Mutually related increases in N concentrations and BNF can be assumed for most logs in our study since concentrations were still relatively low with 0.2 to 0.4% N. Despite the high atmospheric N deposition at our study sites, BNF is still limited by low N concentration in deadwood after 12 years of decay.
Moreover, we could not find a correlation between BNF and the δ15N signature, but a tree species effect on the δ15N signature (Online Resource Fig. S3). Generally, BNF reflects the δ15N signature of atmospheric N2 (~ 0‰) (Hobbie et al. 2020). However, other processes, such as the translocation of N from underlying soil into deadwood or atmospheric N deposition, may co-occur. These processes change the δ15N signature to more negative values (Knorr et al. 2015; Sabo et al. 2016) and make it difficult to assign the origins of N. Additionally, BNF was measured after 12 years of decay, but the δ15N signatures partly originate from N uptake during the tree´s life.
As for N, the concentrations of P, S, and Mo of the 13 log species were also very low and positively correlated to BNF. A co-limitation of BNF by these essential nutrients was likely. However, it is unclear which nutrient had the greatest limiting effect on diazotrophs in deadwood. Low levels of available P constrained the growth of diazotrophic microorganisms and the ATP-dependent enzymatic conversion of N2 to NH3 by nitrogenase (Hardy et al. 1971). The average increase in deadwood P concentration by 75% in our study between 2009 and 2020 (Kahl et al. 2017, Table 1) resulted mainly from the C loss during the decay. In addition, deadwood decaying fungi can transfer P from the underlying soil into deadwood via their hyphal system to overcome P deficiency (Boddy and Watkinson 1995). Enrichment of P could enhance the growth of diazotrophs and the BNF rate in logs, but studies on the response of BNF to P addition in deadwood are lacking to our knowledge. Strong positive effects of P addition on BNF were reported for soil (Barron et al. 2009), mosses (Rousk et al. 2017), and leaf litter (Reed et al. 2013). Although, Barron et al. (2009) suggested that P fertilizers could be contaminated with Mo, meaning that additional P is not exclusively responsible for increasing BNF rates.
Mo is an essential element for many diazotrophs through its function in the transfer of electrons in the nitrogenase enzyme complex (Burris and Roberts 1993). Except for Acer, levels of Mo in logs were very low, although the correlations to BNF were also significant without Acer (not shown). A positive correlation between Mo and BNF has been found in studies for soil (Perakis et al. 2017), mosses (Rousk et al. 2017), and litter (Silvester 1989), but no effect was found for deadwood (Benoist et al. 2022). Due to the scarcity of Mo in several ecosystems, diazotrophs can also fix N using alternative nitrogenases, which are encoded as anfH and vnfH and depend on iron or vanadium (V) instead of Mo (Bellenger et al. 2020). Benoist et al. (2022) suggested that alternative nitrogenases could play a more prominent role in BNF since V is more abundant in deadwood than Mo. Hence, vnfH could be responsible for the weak correlation between BNF and nifH gene abundance in our study.
Compared to N and P, the relevance of S availability for the growth of non-symbiotic diazotrophs or BNF was barely studied in terrestrial ecosystems (Silvester 1989). Increasing S and K concentrations seemed to accelerate deadwood decay while other elements had no effect (Kahl et al. 2017). The positive correlation between BNF and S points to a mutual relation between fungi and diazotrophs, as Hoppe et al. (2014) suggested. Since S promotes both growth and activity of fungi (Schmalenberger et al. 2011), more C and other nutrients, such as P and Mo, could become available for diazotrophs (see above). In exchange, N becomes available to fungi, thus, supporting the idea of a mutual relationship between fungi and diazotrophs.
BNF and nifH gene abundance is mainly driven by WC
A SEM was applied to explore direct and indirect relationships between BNF, nifH abundance, and potential drivers. WC was the best explanatory variable for BNF and nifH gene abundance, reflecting higher diazotrophy and water holding capacity in diffuse-porous angiosperms versus ring-porous angiosperms and gymnosperms. All deadwood samples were adjusted to maximum water holding capacity, but WC strongly differed because of varying wood densities and capacities to store water. Positive correlations of BNF and WC in deadwood were associated with O2 availability since O2 is an inhibitor of the nitrogenase and can dampen BNF (Larsen et al. 1978; Burris and Roberts 1993; Hicks 2000). Thus, WC below water holding capacity could reduce BNF and nifH gene abundance in logs under field conditions. Other factors, such as the decay stage (Hendrickson 1988) or chemical properties of deadwood, including carbohydrates and N (Cushon and Feller 1989), play a minor role.
As mentioned above, NSC and nutrients, such as Mo, and N, are crucial for the BNF activity as they serve as an energy source (Khan et al. 2021), act as a metal cofactor in the nifH gene (Bellenger et al. 2020) or activate BNF at low N concentrations (Reed et al. 2011), respectively. However, we could not find such relationships in the SEM (Online Resource Fig. S2), and the SEM explained only a little part of the variability. The low explanatory power indicates the complex control and high variability of BNF in deadwood.
Conclusions
Our literature evaluation demonstrates that BNF is a ubiquitous and fundamental microbial process in deadwood of all investigated tree species across different biomes. High atmospheric N deposition in Central Europe does not suppress BNF in deadwood. In contrast, BNF in deadwood of gymnosperms with very low N levels could even benefit from this atmospheric N input. Regardless of N deposition, deadwood from diffuse-porous angiosperm tree species with relatively high decomposability and high initial nutrient concentrations has greater potential for BNF than deadwood from other phylogenetic tree clades. The high variability of BNF rates and nifH gene abundances within individual tree species suggests a complex control of diazotrophs through abiotic factors and saprotrophic organisms. Among the abiotic factors, WC and the associated control of O2 availability are most effective in controlling BNF in deadwood. BNF is relevant for the N supply of saprotrophic organisms and can substantially contribute to the gradual enrichment of N in deadwood during the long-term decay process. Given the low exploratory power of abiotic factors, the interspecies interaction patterns with the emphasis on diazotrophs and saprotrophic organisms could strongly affect the activity of diazotrophs.
Data availability
This work is based on data elaborated by the project Woodstock of the Biodiversity Exploratories program (DFG Priority Program 1374). The data (ID 31321) are available in the Biodiversity Exploratories Information System (https://doi.org/10.25829/bexis.31.321-4).
References
Ackerman D, Millet DB, Chen X (2019) Global estimates of inorganic nitrogen deposition across four decades. Glob Biogeochem Cycles 33:100–107. https://doi.org/10.1029/2018GB005990
Aloui F, Ayadi N, Charrier F, Charrier B (2004) Durability of European oak (Quercus petraea and Quercus robur) against white rot fungi (Coriolus versicolor): relations with phenol extractives. Holz Als Roh - Und Werkst 62:286–290. https://doi.org/10.1007/s00107-004-0489-7
Barron AR, Wurzburger N, Bellenger JP, Wright SJ, Kraepiel AM, Hedin LO (2009) Molybdenum limitation of asymbiotic nitrogen fixation in tropical forest soils. Nat Geosci 2:42–45. https://doi.org/10.1038/ngeo366
Bellenger JP, Darnajoux R, Zhang X, Kraepiel AML (2020) Biological nitrogen fixation by alternative nitrogenases in terrestrial ecosystems: a review. Biogeochemistry 149:53–73. https://doi.org/10.1007/s10533-020-00666-7
Benoist A, Houle D, Bradley RL, Bellenger JP (2022) Evaluation of biological nitrogen fixation in coarse woody debris from Eastern Canadian boreal forests. Soil Biol Biochem 165:108531. https://doi.org/10.1016/j.soilbio.2021.108531
Bobbink R, Hicks K, Galloway J, Spranger T, Alkemade R, Ashmore M, Bustamante M, Cinderby S, Davidson E, Dentener F, Emmett B, Erisman JW, Fenn M, Gilliam F, Nordin A, Pardo L, De Vries W (2010) Global assessment of nitrogen deposition effects on terrestrial plant diversity: a synthesis. Ecol Appl 20:30–59. https://doi.org/10.1890/08-1140.1
Boddy L, Watkinson SC (1995) Wood decomposition, higher fungi, and their role in nutrient redistribution. Can J Bot 73:S1377–S1383. https://doi.org/10.1139/b95-400
Bonanomi G, Zotti M, Cesarano G, Sarker TC, Saulino L, Saracino A, Idbella M, Agrelli D, D’Ascoli R, Rita A, Adamo P (2021) Position of woody debris in mediterranean ecosystems: the role of wood chemical and anatomical traits. Plant Soil 460:26–280. https://doi.org/10.1007/s11104-020-04799-4
Boring LR, Swank WT, Waide JB, Henderson GS (1988) Sources, fates, and impacts of nitrogen inputs to terrestrial ecosystems: review and synthesis. Biogeochemistry 6:119–159. https://doi.org/10.1007/BF00003034
Borken W, Matzner E (2004) Nitrate leaching in forest soils: an analysis of long-term monitoring sites in Germany. J Plant Nutr Soil Sci 167:277–283. https://doi.org/10.1002/jpln.200421354
Brunner A, Kimmins JP (2003) Nitrogen fixation in coarse woody debris of Thuja plicata and Tsuga heterophylla forests on northern Vancouver Island. Can J for Res 33:1670–1682. https://doi.org/10.1139/x03-085
Burgoyne TA, DeLuca TH (2009) Short-term effects of forest restoration management on non-symbiotic nitrogen-fixation in western Montana. For Ecol Manage 258:1369–1375. https://doi.org/10.1016/j.foreco.2009.06.048
Burgoyne TA (2007) Free living nitrogen-fixation in ponderosa pine/Douglas-fir forests in western Montana. Master Thesis, University of Montana
Burris RH, Roberts GP (1993) Biological nitrogen fixation. Annu Rev Nutr 13:317–335. https://doi.org/10.1146/annurev.nu.13.070193.001533
Chen H, Hicks W (2003) High asymbiotic BNF rates in woody roots after six years of decomposition: controls and implications. Basic Appl Ecol 4:479–486. https://doi.org/10.1078/1439-1791-00190
Covey KR, de Mesquita CPB, Oberle B, Maynard DS, Bettigole C, Crowther TW, Duguid MC, Steven B, Zanne AE, Lapin M, Ashton MS, Oliver CD, Lee X, Bradford MA (2016) Greenhouse trace gases in deadwood. Biogeochemistry 130:215–226. https://doi.org/10.1007/s10533-016-0253-1
Cushon GH, Feller MC (1989) Asymbiotic nitrogen fixation and denitrification in a mature forest in coastal British Columbia. Can J for Res 19:1194–1200. https://doi.org/10.1139/x89-179
Dabundo R, Lehmann MF, Treibergs L, Tobias CR, Altabet MA, Moisander PH, Granger J (2014) The contamination of commercial 15N2 gas stocks with 15N-labeled nitrate and ammonium and consequences for nitrogen fixation measurements. PLoS ONE 9:e110335. https://doi.org/10.1371/journal.pone.0110335
Das S, Ganguly D, Mukherjee A, Chakraborty S, De TK (2020) Exploration of N2 fixation and denitrification processes in the sundarban mangrove ecosystem. India IJMS 49:740–747
de Bont JAM, Mulder EG (1976) Invalidity of the acetylene reduction assay in alkane utilizing, nitrogen fixing bacteria. Appl Environ Microbiol 31:640–647. https://doi.org/10.1128/aem.31.5.640-647.1976
Di Lella S, Tognetti R, La Porta N, Lombardi F, Nardin T, Larcher R (2019) Characterization of silver fir wood decay classes using sugar metabolites detected with ion chromatography. J Wood Chem Technol 39:90–110. https://doi.org/10.1080/02773813.2018.1508301
Fischer M, Bossdorf O, Gockel S, Hänsel F, Hemp A, Hessenmöller D, Korte G, Nieschulze J, Pfeiffer S, Prati D, Renner S, Schöning I, Schumacher U, Wells K, Buscot F, Kalko EKV, Linsenmair KE, Schulze E-D, Weisser WW (2010) Implementing large-scale and long-term functional biodiversity research: the biodiversity exploratories. Basic Appl Ecol 11:473–485. https://doi.org/10.1016/j.baae.2010.07.009
Gómez-Brandón M, Probst M, Siles JA, Peintner U, Bardelli T, Egli M, Insam H, Ascher-Jenull J (2020) Fungal communities and their association with nitrogen-fixing bacteria affect early decomposition of Norway spruce deadwood. Sci Rep 10:8025. https://doi.org/10.1038/s41598-020-64808-5
Griffiths RP, Harmon ME, Caldwell BA, Carpenter SE (1993) Acetylene reduction in conifer logs during early stages of decomposition. Plant Soil 148:53–61. https://doi.org/10.1007/BF02185384
Hardy RWF, Burns RC, Hebert RR, Holsten RD, Jackson EK (1971) Biological nitrogen fixation: a key to world protein. Plant Soil 35:561–590. https://doi.org/10.1007/BF02661879
Hendrickson OQ (1988) Use of acetylene reduction for estimating nitrogen fixation in woody debris. Soil Sci Soc Am J 52:840–844. https://doi.org/10.2136/sssaj1988.03615995005200030043x
Hendrickson OQ (1991) Abundance and activity of N2-fixing bacteria in decaying wood. Can J for Res 21:1299–1304. https://doi.org/10.1139/x91-183
Hicks WT, Harmon ME, Myrold DD (2003) Substrate controls on nitrogen fixation and respiration in woody debris from the Pacific Northwest, USA. For Ecol Manage 176:25–35. https://doi.org/10.1016/S0378-1127(02)00229-3
Hicks WT (2000) Modeling nitrogen fixation in dead wood. Dissertation, Oregon State University
Hiscox J, O’Leary J, Boddy L (2018) Fungus wars: basidiomycete battles in wood decay. Stud Mycol 89:117–124. https://doi.org/10.1016/j.simyco.2018.02.003
Hobbie EA, Grandy AS, Harmon ME (2020) Isotopic and compositional evidence for carbon and nitrogen dynamics during wood decomposition by saprotrophic fungi. Fungal Ecol 45:1–9. https://doi.org/10.1016/j.funeco.2020.100915
Hodge A, Robinson D, Fitter A (2000) Are microorganisms more effective than plants at competing for nitrogen? Trends Plant Sci 5:304–308. https://doi.org/10.1016/S1360-1385(00)01656-3
Hoppe B, Kahl T, Karasch P, Wubet T, Bauhus J, Buscot F, Krüger D (2014) Network analysis reveals ecological links between N-fixing bacteria and wood-decaying fungi. PLoS ONE 9:e88141. https://doi.org/10.1371/journal.pone.0088141
Hsu SF, Buckley DH (2009) Evidence for the functional significance of diazotroph community structure in soil. ISME J 3:124–136. https://doi.org/10.1038/ismej.2008.82
Jurgensen MF, Larsen MJ, Spano SD, Harvey AE, Gale MR (1984) Nitrogen fixation associated with increased wood decay in douglas-fir residue. For Sci 30:1038–1044. https://doi.org/10.1093/forestscience/30.4.1038
Kahl T, Baber K, Otto P, Wirth C, Bauhus J (2015) Drivers of CO2 emission rates from dead wood logs of 13 tree species in the initial decomposition phase. Forests 6:2484–2504. https://doi.org/10.3390/f6072484
Kahl T, Arnstadt T, Baber K, Bässler C, Bauhus J, Borken W, Buscot F, Floren A, Heibl C, Hessenmöller D, Hofrichter M, Hoppe B, Kellner H, Krüger D, Linsenmair KE, Matzner E, Otto P, Purahong W, Seilwinder C, Schulze E-D, Wende B, Weisser WW, Gossner MM (2017) Wood decay rates of 13 temperate tree species in relation to wood properties, enzyme activities and organismic diversities. For Ecol Manag 391:86–95. https://doi.org/10.1016/j.foreco.2017.02.012
Khan S, Nadir S, Iqbal S, Xu J, Gui H, Khan A, Ye L (2021) Towards a comprehensive understanding of free-living nitrogen fixation. Circ Agric Syst. https://doi.org/10.48130/cas-2021-0013
Knorr K-H, Horn MA, Borken W (2015) Significant nonsymbiotic nitrogen fixation in patagonian ombrotrophic bogs. Glob Chang Biol 21:2357–2365. https://doi.org/10.1111/gcb.12849
Kuramae EE, Leite MFA, Suleiman AKA, Gough CM, Castillo BT, Faller L, Franklin RB, Syring J (2019) Wood decay characteristics and interspecific interactions control bacterial community succession in Populus grandidentata (Bigtooth Aspen). Front Microbiol 10:979. https://doi.org/10.3389/fmicb.2019.00979
Landhäusser SM, Chow PS, Dickman LT, Furze ME, Kuhlman I, Schmid S, Wiesenbauer J, Wild B, Gleixner G, Hartmann H, Hoch G, McDowell NG, Richardson AD, Richter A, Adams HD (2018) Standardized protocols and procedures can precisely and accurately quantify non-structural carbohydrates. Tree Physiol 38:1764–1778. https://doi.org/10.1093/treephys/tpy118
Larsen MJ, Jurgensen MF, Harvey AE (1978) N2 fixation associated with wood decayed by some common fungi in Western Montana. Can J for Res 8:341–345. https://doi.org/10.1139/x78-050
Lefcheck JS (2016) piecewiseSEM: piecewise structural equation modelling in R for ecology, evolution, and systematics. Methods Ecol Evol 7:573–579. https://doi.org/10.1111/2041-210X.12512
Lindahl BD, Finlay RD (2006) Activities of chitinolytic enzymes during primary and secondary colonization of wood by basidiomycetous fungi. New Phytol 169:389–397. https://doi.org/10.1111/j.1469-8137.2005.01581.x
Lladó S, López-Mondéjar R, Baldrian P (2017) Forest soil bacteria: diversity, involvement in ecosystem processes, and response to global change. Microbiol Mol Biol Rev 81:e00063-e116. https://doi.org/10.1128/mmbr.00063-16
Mäkipää R, Huhtiniemi S, Kaseva J, Smolander A (2018a) Asymbiotic nitrogen fixation on woody roots of Norway spruce and silver birch. Can J for Res 48:172–179. https://doi.org/10.1139/cjfr-2017-0270
Mäkipää R, Leppänen SM, Munoz SS, Smolander A, Tiirola M, Tuomivirta T, Fritze H (2018b) Methanotrophs are core members of the diazotroph community in decaying Norway spruce logs. Soil Biol Biochem 120:230–232. https://doi.org/10.1016/j.soilbio.2018.02.012
McMahon SK, Wallenstein MD, Schimel JP (2011) A cross-seasonal comparison of active and total bacterial community composition in Arctic tundra soil using bromodeoxyuridine labeling. Soil Biol Biochem 43:287–295. https://doi.org/10.1016/j.soilbio.2010.10.013
Merilä P, Mustajärvi K, Helmisaari HS, Hilli S, Lindroos A-J, Nieminen TM, Nöjd P, Rautio P, Salemaa M, Ukonmaanaho L (2014) Above- and below-ground N stocks in coniferous boreal forests in Finland: implications for sustainability of more intensive biomass utilization. For Ecol Manag 311:17–28. https://doi.org/10.1016/j.foreco.2013.06.029
Mise K, Masuda Y, Senoo K, Itoh H (2021) Undervalued pseudo-nifH sequences in public databases distort metagenomic insights into biological nitrogen fixers. mSphere 6:e00785-e821. https://doi.org/10.1128/msphere.00785-21
Noh NJ, Yoon TK, Kim R-H, Bolton NW, Kim C, Son Y (2017) Carbon and nitrogen accumulation and decomposition from coarse woody debris in a naturally regenerated Korean red pine (Pinus densiflora S. et Z.) forest. Forests. https://doi.org/10.3390/f8060214
Palviainen M, Finér L, Laiho R, Shorohova E, Kapitsa E, Vanha-Majamaa I (2010) Carbon and nitrogen release from decomposing Scots pine, Norway spruce and silver birch stumps. For Ecol Manag 259:390–398. https://doi.org/10.1016/j.foreco.2009.10.034
Pastorelli R, Paletto A, Agnelli AE, Lagomarsino A, De Meo I (2020) Microbial communities associated with decomposing deadwood of downy birch in a natural forest in Khibiny Mountains (Kola Peninsula, Russian Federation). For Ecol Manage 455:117643. https://doi.org/10.1016/j.foreco.2019.117643
Perakis SS, Pett-Ridge JC, Catricala CE (2017) Nutrient feedbacks to soil heterotrophic nitrogen fixation in forests. Biogeochemistry 134:41–55. https://doi.org/10.1007/s10533-017-0341-x
Peršoh D, Borken W (2017) Impact of wood debris of different tree species on the microbial activity and community of an underlying organic horizon. Soil Biol Biochem 115:516–525. https://doi.org/10.1016/j.soilbio.2017.09.017
Pinheiro J, Bates D, DebRoy S, Sarkar D, R Core Team (2021) nlme: Linear and Nonlinear Mixed Effects Models. R package version 3.1–152. https://CRAN.R-project.org/package=nlme Accessed 08 April 2022
Poly F, Monrozier LJ, Bally R (2001) Improvement in the RFLP procedure for studying the diversity of nifH genes in communities of nitrogen fixers in soil. Res Microbiol 152:95–103. https://doi.org/10.1016/S0923-2508(00)01172-4
Purahong W, Arnstadt T, Kahl T, Bauhus J, Kellner H, Hofrichter M, Krüger D, Buscot F, Hoppe B (2016) Are correlations between deadwood fungal community structure, wood physico-chemical properties and lignin-modifying enzymes stable across different geographical regions? Fungal Ecol 22:98–105. https://doi.org/10.1016/j.funeco.2016.01.002
Purahong W, Tanunchai B, Muszynski S, Maurer F, Wahdan SFM, Malter J, Buscot F, Noll M (2022) Cross-kingdom interactions and functional patterns of active microbiota matter in governing deadwood decay. Proc R Soc B 289:20220130. https://doi.org/10.1098/rspb.2022.0130
R Core Team (2021) R: A language and environment for statistical computing. R Foundation for Statistical Computing, Vienna, Austria. https://www.R-project.org/ Accessed 08 April 2022
Ratnayake RR, Seneviratne G, Kulasooriya SA (2013) Effect of soil carbohydrates on nutrient availability in natural forests and cultivated lands in Sri Lanka. Eurasian Soil Sci 46:579–586. https://doi.org/10.1134/S1064229313050177
Reed SC, Cleveland CC, Townsend AR (2011) Functional ecology of free-living nitrogen fixation: a contemporary perspective. Annu Rev Ecol Evol Syst 42:489–512. https://doi.org/10.1146/annurev-ecolsys-102710-145034
Reed SC, Cleveland CC, Townsend AR (2013) Relationships among phosphorus, molybdenum and free-living nitrogen fixation in tropical rain forests: results from observational and experimental analyses. Biogeochemistry 114:135–147. https://doi.org/10.1007/s10533-013-9835-3
Rinne KT, Rajala T, Peltoniemi K, Chen J, Smolander A, Mäkipää R (2017) Accumulation rates and sources of external nitrogen in decaying wood in a Norway spruce dominated forest. Funct Ecol 31:530–541. https://doi.org/10.1111/1365-2435.12734
Romashkin I, Shorohova E, Kapitsa E, Galibina N, Nikerova K (2018) Carbon and nitrogen dynamics along the log bark decomposition continuum in a mesic old-growth boreal forest. Eur J for Res 137:643–657. https://doi.org/10.1007/s10342-018-1131-2
Roskoski JP (1980) Nitrogen fixation in hardwood forests of the northeastern United States. Plant Soil 54:33–44. https://doi.org/10.1007/BF02181997
Roskoski JP (1981) Comparative C2H2 reduction and 15N2 fixation in deciduous wood litter. Soil Biol Biochem 13:83–85. https://doi.org/10.1016/0038-0717(81)90109-7
Rousk K, Degboe J, Michelsen A, Bradley R, Bellenger J-P (2017) Molybdenum and phosphorus limitation of moss-associated nitrogen fixation in boreal ecosystems. New Phytol 214:97–107. https://doi.org/10.1111/nph.14331
Rowell RM, Pettersen R, Han JS, Rowell JS, Tshabalala MA (2005) Cell wall chemistry. In: Rowell RM (ed) Handbook of wood chemistry and wood composites. CRC Press Inc, Washington, pp 35–74
Sabo RD, Scanga SE, Lawrence GB, Nelson DM, Eshleman KN, Zabala GA, Alinea AA, Schirmer CD (2016) Watershed-scale changes in terrestrial nitrogen cycling during a period of decreased atmospheric nitrate and sulfur deposition. Atmos Environ 146:271–279. https://doi.org/10.1016/j.atmosenv.2016.08.055
Schmalenberger A, Pritzkow W, Ojeda JJ, Noll M (2011) Characterization of main sulfur source of wood-degrading basidiomycetes by S K-edge X-ray absorption near edge spectroscopy (XANES). Int Biodeterior Biodegrad 65:1215–1223. https://doi.org/10.1016/j.ibiod.2011.08.013
Schwarz MT, Bischoff S, Blaser S, Boch S, Schmitt B, Thieme L, Fischer M, Michalzik B, Schulze E-D, Siemens J, Wilcke W (2014) More efficient aboveground nitrogen use in more diverse Central European forest canopies. For Ecol Manag 313:274–282. https://doi.org/10.1016/j.foreco.2013.11.021
Shipley B (2013) The AIC model selection method applied to path analytic models compared using a d-separation test. Ecology 94:560–564. https://doi.org/10.1890/12-0976.1
Silvester WB (1989) Molybdenum limitation of asymbiotic nitrogen fixation in forests of Pacific Northwest America. Soil Biol Biochem 21:283–289. https://doi.org/10.1016/0038-0717(89)90106-5
Silvester WB, Sollins P, Verhoeven T, Cline SP (1982) Nitrogen fixation and acetylene reduction in decaying conifer boles: effects of incubation time, aeration, and moisture content. Can J for Res 12:646–652. https://doi.org/10.1139/x82-098
Sollins P, Grier C, McCorison F, Cromack K Jr, Fogel R, Fredriksen RL (1980) The internal element cycles of an old-growth douglas-fir ecosystem in western Oregon. Ecol Monogr 50:261–285. https://doi.org/10.2307/2937252
Soper FM, Simon C, Jauss V (2021) Measuring nitrogen fixation by the acetylene reduction assay (ARA): is 3 the magic ratio? Biogeochemistry 152:345–351. https://doi.org/10.1007/s10533-021-00761-3
Spano SD, Jurgensen MF, Larsen MJ, Harvey AE (1982) Nitrogen-fixing bacteria in douglas-fir residue decayed by Fomitopsis pinicola. Plant Soil 68:117–123. https://doi.org/10.1007/BF02374731
Taylor BR, Parkinson D, Parsons WFJ (1989) Nitrogen and lignin content as predictors of litter decay rates: a microcosm test. Ecology 70:97–104. https://doi.org/10.2307/1938416
Tláskal V, Brabcová V, Větrovský T, Jomura M, López-Monéjar R, Monteiro LMO, Saraiva JP, Human ZR, Cajthaml T, da Rocha UN, Baldrian P (2021) Complementary roles of wood-inhabiting fungi and bacteria facilitate deadwood decomposition. mSystems 6:e01078-e1120. https://doi.org/10.1128/msystems.01078-20
Törmänen T, Smolander A (2022) Biological nitrogen fixation in logging residue piles of different tree species after final felling. J Environ Manage 303:113942. https://doi.org/10.1016/j.jenvman.2021.113942
Vitousek PM (1994) Potential nitrogen fixation during primary succession in Hawai`i Volcanoes national park. Biotropica 26:234–240. https://doi.org/10.2307/2388844
Vitousek PM, Cassman K, Cleveland C, Crews T, Field CB, Grimm NB, Howarth RW, Marino R, Martinelli L, Rastetter EB, Sprent JI (2002) Towards an ecological understanding of biological nitrogen fixation. Biogeochemistry 57:1–45. https://doi.org/10.1023/A:1015798428743
Wahdan SFM, Heintz-Buschart A, Sansupa C, Tanunchai B, Wu Y-T, Schädler M, Noll M, Purahong W, Buscot F (2021) Targeting the active rhizosphere microbiome of Trifolium pratense in grassland evidences a stronger-than-expected belowground biodiversity-ecosystem functioning link. Front Microbiol 12:629169. https://doi.org/10.3389/fmicb.2021.629169
Weaver R, Danso S (1994) Dinitrogen fixation. In: Weaver R, Angle S, Bottomley P, Bezdicek D, Smith S, Tabatabai A, Wollum A (eds) Methods of soil analysis, part 2. Microbiological and biochemical properties. Soil Science Society of America, Inc, Madison, pp 1019–1045
Wei X, Kimmins JP (1998) Asymbiotic nitrogen fixation in harvested and wildfire-killed lodgepole pine forests in the central interior of British Columbia. For Ecol Manag 109:343–353. https://doi.org/10.1016/S0378-1127(98)00288-6
Wickham H (2016) ggplot2: elegant graphics for data analysis. Springer Nature, New York
Wu C, Wei X, Hu Z, Liu Y, Hu Y, Qin H, Chen X, Wu J, Ge T, Zhran M, Su Y (2021) Diazotrophic community variation underlies differences in nitrogen fixation potential in paddy soils across a climatic gradient in China. Microb Ecol 81:425–436. https://doi.org/10.1007/s00248-020-01591-w
Zhang H, Wang C, Wang X (2014) Spatial variations in non-structural carbohydrates in stems of twelve temperate tree species. Trees 28:77–89. https://doi.org/10.1007/s00468-013-0931-8
Acknowledgements
We thank Jessica Bauer, Anett Enke, Leonie Hegelheimer, Uwe Hell, Sebastian Knorr, Renate Krauß, Savoyane Lambert, Lennart Lehmann, Pooja Parmar, Karin Söllner and Dominik Stapf for technical assistance in the field and the laboratory, the Central Analytical Department of BayCEER, the Centre for Stable Isotope Research and Analysis Göttingen and the MPI for Biogeochemsitry Jena for supporting chemical analyses. We thank the managers of the three exploratories, Kirsten Reichel-Jung, Florian Staub, Julia Bass, Juliane Vogt, Anne K. Franke, Miriam Teuscher, Franca Marian and all former managers for their work in maintaining the plot and project infrastructure; Victoria Grießmeier for giving support through the central office, Andreas Ostrowski for managing the central data base, and Markus Fischer, Eduard Linsenmair, Dominik Hessenmöller, Daniel Prati, Ingo Schöning, François Buscot, Ernst-Detlef Schulze, Wolfgang W. Weisser and the late Elisabeth Kalko for their role in setting up the Biodiversity Exploratories project. We thank the administration of the Hainich national park, the UNESCO Biosphere Reserve Swabian Alb and the UNESCO Biosphere Reserve Schorfheide-Chorin as well as all landowners for the excellent collaboration. The work has been (partly) funded by the DFG Priority Program 1374 "Biodiversity- Exploratories" (BO 1741/15-1 and NO 834/6-1). Field work permits were issued by the responsible state environmental offices of Baden-Württemberg, Thüringen, and Brandenburg.
Funding
Open Access funding enabled and organized by Projekt DEAL. The work has been funded by the DFG Priority Program 1374 “Biodiversity- Exploratories” (BO 1741/15–1 and NO 834/6–1).
Author information
Authors and Affiliations
Contributions
CG performed the research and analyzed the data; SH provided the nifH gene abundance; HH provided data about NSC concentrations; CG and WB wrote the paper with contributions from all authors; WB and MN designed the study.
Corresponding author
Ethics declarations
Conflict of interest
The authors have no relevant financial or non-financial interests to disclose.
Additional information
Publisher's Note
Springer Nature remains neutral with regard to jurisdictional claims in published maps and institutional affiliations.
Responsible Editor: Heleen A. de Wit.
Supplementary Information
Below is the link to the electronic supplementary material.
Rights and permissions
Open Access This article is licensed under a Creative Commons Attribution 4.0 International License, which permits use, sharing, adaptation, distribution and reproduction in any medium or format, as long as you give appropriate credit to the original author(s) and the source, provide a link to the Creative Commons licence, and indicate if changes were made. The images or other third party material in this article are included in the article's Creative Commons licence, unless indicated otherwise in a credit line to the material. If material is not included in the article's Creative Commons licence and your intended use is not permitted by statutory regulation or exceeds the permitted use, you will need to obtain permission directly from the copyright holder. To view a copy of this licence, visit http://creativecommons.org/licenses/by/4.0/.
About this article

Cite this article
Groß, C., Hossen, S., Hartmann, H. et al. Biological nitrogen fixation and nifH gene abundance in deadwood of 13 different tree species. Biogeochemistry 161, 353–371 (2022). https://doi.org/10.1007/s10533-022-00986-w
Received:
Accepted:
Published:
Issue Date:
DOI: https://doi.org/10.1007/s10533-022-00986-w