
Abstract
Edible insects are found in agricultural systems worldwide, and are an important source of food and income. However, many edible insects are also pests of important food crops, which raises the question of how far their presence might be costly to farmers in terms of reduced crop yields. In this study we aimed to understand the impact of defoliation of shea trees by edible caterpillars on yields of shea and maize in a mixed agroforestry system in Burkina Faso, West Africa. We collected field data in two consecutive years. Our results suggest that tree defoliation by caterpillars has no effect on shea fruit yields, and that defoliation may have a positive effect on maize productivity. We conclude that this appears to be an example of an agricultural system in which nutritionally and economically important plants and insects are both harvested by humans without risking yield reductions of harvested plants.
Introduction
Wild-harvested edible insects are an important source of food and income across much of the world (Van Huis et al. 2013). This is particularly true in sub-Saharan Africa, where termites, locusts and caterpillars are traded and consumed, mostly in rural but also in urban areas (Kelemu et al. 2015; Illgner and Nel 2000). Edible insects are often harvested from agricultural systems. In many cases, this is because insects that feed on crop plants are deliberately collected as food (DeFoliart 1992; Van Itterbeeck and Van Huis 2012). For example, palm weevil larvae are harvested from many palm-based agroforestry systems worldwide (Binnqüist and Shanley 2004), and weaver ants are harvested from fruit tree plantations in Southeast Asia (Payne and Van Itterbeeck 2017).
We know little about the interactions of edible insects with crop yields. The best data available are based on assumptions generalised across species in ways that even the authors admit are unlikely to be accurate (Wegier et al. 2018; Payne and Van Itterbeeck 2017). Some insects—such as grasshoppers and crickets—are collected at multiple points in the middle of their life cycle with the explicit aim of limiting crop damage. This presumably means that the harvested biomass of insects is not maximised, but crop yield is higher than it would have been if the insects had been left to mature. In such cases there is likely to be a trade-off between harvested biomass of insects and that of crops. How farmers respond to this trade-off may depend on demand—e.g. in parts of Mexico, edible grasshoppers are so prized that some farmers set aside fields of alfalfa specifically for the grasshopper crop (Cerritos and Cano-Santana 2008). Elsewhere farmers use insecticide to control outbreaks of these edible insects, apparently choosing higher crop yield over insect yield (Ecobichon 2001).
Other insects are harvested only at a specific point in their life cycle. Caterpillars are a good example of this: many are eaten only when in their final larval stage. This is the case for the mopane worm (Imbrasia belina), which is an economically important edible caterpillar throughout southern Africa (Ghazoul et al. 2006). The same is true for termite (Macrotermes spp.) alates, harvested after their nuptial flight, which occurs in response to the first rains (Kinyuru et al. 2013). These insects are found in abundance, but only when in season. However, most are wild-harvested, and are not found in agricultural fields. Many larval insects feed on crops, but are small in size and not traditionally eaten.
This study looks at an exception to these patterns: an insect which is harvested as a larva which is also potential agricultural pest. The shea caterpillar Cirina butyrospermi (Fig. 1) only feeds on the leaves of the shea tree (Vitellaria paradoxa). This is a wild tree that has been selectively retained in agricultural fields across western and sub-saharan Africa, a stretch of land known as the shea belt, with fields referred to as shea parklands (Maranz and Wiesman 2003). The nuts from the trees are collected to make shea butter, used in food, confectionery and cosmetics (Lovett 2010). Shea caterpillars are abundant in parts of these agroforestry systems, and are collected as food (Bonkoungou 2002). They are commonly harvested in their final instar before pupation, by which time they have usually caused extensive damage to the shea trees (Fig. 1).

he shea caterpillar (Cirina butyrospermi), with scale (left, in cm); a shea tree (Vitellaria paradoxa) following defoliation by shea caterpillars (right)
Farmers in this region—and by extension, agricultural policymakers—are interested in the interaction between the edible caterpillars and their crops. Working in a rural landscape in the SW of the shea belt, where shea trees are retained in fields of maize (Zea mays) and other crops, this study addresses this interaction in two different ways. Firstly, we ask whether defoliation by caterpillars has any discernible impact on the abundance of shea fruits in the following year. Secondly, we ask whether defoliation by caterpillars shows any association with the heights of maize crops under shea trees.
Shea agroforestry and shea caterpillars
Shea parklands are an agroforestry system estimated to dominate 3–4,500,000 km2 of the landscape across 21 African countries (Naughton et al. 2015); shea trees have been selectively retained for many years (Lovett and Haq 2000). The trees are a major source of income and cultural significance, and particularly benefit women through their use of the trees to collect edible and tradable goods (Boffa 2000).
Shea caterpillars are found in many parts of the shea belt (Anankware et al. 2016; Boffa 2015). Their range has not been mapped and while their life cycle has been documented (Rémy et al. 2017), little is known of their ecology. They are harvested at the end of their larval life cycle, which usually falls in early to late August, after they have caused considerable damage to shea trees (Fig. 1). Harvested caterpillars are an important source of nutrition and income for many subsistence farming households in the region (Anvo et al. 2016). In some parts of the shea belt where the caterpillar is not traditionally eaten as food, the caterpillar is considered a pest with insecticides sometimes used to combat it (Odebiyi et al. 2004). Yet even in such regions farmers are increasingly recognising the economic benefits of collecting caterpillars, and are learning to harvest them (K. Hien, pers.comm.). In most areas there remains a taboo on collecting caterpillars before they have reached their final instar, limiting any scope for flexibility over when to harvest caterpillars. However, some farmers are concerned about the impacts of caterpillar defoliation and caterpillar harvesting on their yields of shea and maize (Payne, in prep.).
In many parts of West Africa, women and men have different roles within the same landscape, and prioritise different crops (Rocheleau and Edmunds 1997). This is true of the study region, and therefore this study focuses on two crops: shea and maize. Shea is a commercially important crop for women across the shea belt (in the form of shea nuts, which are sold at market) (Elias 2015; Schreckenberg 2004). Maize is the staple food of the region; maize fields are usually owned and managed by men but women and children contribute substantial agricultural labour (Kevane and Gray 1999).
The impact of defoliation by shea caterpillars on shea and plant crop yields has not been quantified. Opinion is divided as to whether defoliation increases (Boffa 2015) or decreases (Dwomoh et al. 2004) subsequent harvests of shea nuts. Defoliation might increase light levels reaching maize plants growing underneath shea trees. In addition, shea caterpillars produce frass, which has been shown to have a positive effect on soil pH (increased alkalinity), calcium (C) and nitrogen (N) content, but not on phosphorus (P) or potassium (K) (Coulibaly et al. 2017); however, the impact of this soil enrichment on crops has not been quantified.
Materials and methods
Study system
Data were collected in Soumosso (Hauts-Bassins, 11°00′44″, − 004°02′45″) and Sitiena (Comoe, 10°36′19″, − 004°49′03″), two administrative districts in southwestern Burkina Faso (Fig. 2). Both are located in the Sudano-Sahelian climatic belt, and experience a long dry season punctuated by a short and unreliable rainy season in May–June (Maranz 2009). The majority of the population are smallholder farmers (Callo-Concha et al. 2012). The dominant crop—and dietary staple—is maize, although cotton (Gossypium arboretum) has become increasingly popular as a cash crop to supplement families’ livelihoods (Gray and Kevane 2001). Millet (Pennisetum glaucum, referred to locally as ‘petit mil’, Eleusine coracana, referred to as ‘mil africaine’, and a red variant of Eleusine coracana referred to as ‘mil rouge’), groundnut (Arachis hypogea) and sorrel (Hibiscus sabdariffa) are also widely grown. All agricultural fields measured (0.2–3 ha, mean = 1.1 ha) had trees in them (4.2–69 trees per ha, mean = 20 trees per ha)—predominantly shea (1.6–36 trees per ha, mean = 15 trees per ha), although the African locust bean tree (Parkia biglobosa) is also common. Both of these trees are economically important (Gausset et al. 2005), and their primary products (shea nuts and locust beans) are mainly harvested, processed (into shea butter and soumbala respectively) and sold by women. The most prevalent ethnic groups are Dioula and Mossi in Soumosso, and Goin and Karaboro in Sitiena, although due to exogamy and economic migration many other ethnic groups are also present. Islam, Christianity and forms of animism are all practised at both sites.

Map of Burkina Faso showing the location of the study sites, Soumosso and Sitiena
Sampling strategy
We initiated our field study with 69 initial interviews in 2016, with male heads (N = 54) and first wives (N = 15) of households that owned > 1 ha of land and cultivated some maize, which is the staple food across the region. We did not record the exact variety of maize cultivated by each household; all maize crops were grown from unlabelled kernels purchased at local markets. Households likely to fit these criteria were identified by an employee of Le Centre Muraz (a malaria field research centre) in Soumosso (N = 69), and by family members of BS in Sitiena (N = 25), following a snowball sampling strategy in which key informants—chosen for their understanding of research design and sampling—helped us to find further respondents (Young et al. 2018). Interviews followed a set structure to ensure quantifiable responses concerning land ownership, household size, and estimates of shea nut and shea caterpillar harvests. We recorded responses by hand. We found that men were able to answer questions about land ownership and crop cultivation, and women were able to answer questions about harvests of shea nuts and shea caterpillars.
In Soumosso we then used stratification by area of landholding and harvest level to select a representative subsample of 30 households whose field systems we then investigated further (Young et al. 2018). This subset has similar land area, caterpillar harvest and household size to those households we discarded from our initial sample in terms of mean land area (t test, t = 1.1, p = NS), quantity of caterpillars collected (t test, t = − 0.9, p = NS) and household size (t test, t = 0.54, p = NS). In Sitiena, we interviewed 25 male heads of household and selected for our sample the N = 23 households that owned > 1 ha of land and grew maize. Our total sample comprised 53 fields owned by different households, 23 in Sitiena and 30 in Soumosso.
For each household, we measured the area of the field that the farmers told us would be used for maize in 2016. In two cases the farmer intended to use two separate ~ 1 ha fields for maize; in both cases we selected one field, based on geographical convenience. We then measured the height and circumference of all trees in each selected field. To identify three shea trees in each field that represented size variation within that field, we ranked all shea trees in each field by size, divided these into three equal sized classes, and selected one tree at random from each size class. This gave us a total sample of 157 trees (as two fields had only two shea trees in them).
A subsample of these trees was then surveyed on four separate occasions: (1) for caterpillar defoliation immediately following caterpillar season, in late August (in 2016, N = 157 trees; in 2017, N = 83 trees); (2) for shea abundance prior to caterpillar season, in July (in 2017, N = 95 trees); (3) for crop height beneath trees during the growing season, in September-late October (in 2016, N = 66 trees; in 2017, N = 42 trees); (4) to examine how maize height related to cob productivity, immediately preceding harvest, in late October-early November (in 2017, N = 36 trees). Each survey had to be completed within a certain time period, and we were unable to sample every tree for any given method; for this reason, none use the full sample of trees. When selecting sites to survey, we prioritised geographical spread to ensure sampling was not focused within a given area. We used the following methods for each survey:
- 1.
Defoliation by caterpillars
As soon after caterpillar season as possible (within a 2wk window, necessary due to rapid regrowth) we noted levels of natural defoliation by shea caterpillars for each tree as follows: the observer stood under the tree in each cardinal compass direction, selected five leaf clusters at random and scored each on a scale of 0–100 for the extent to which defoliation had occurred. The observer also noted their overall impression of total tree defoliation, on a scale of 0–100. Three separate observers collected these data; to ensure concordance the first observer spent a day with each of the second and third observers, noting and then comparing the independently-made observations of each individual until all observations fell within 10% of one another. Scores for total tree defoliation showed substantial concordance (following McBride 2005) with the cluster-derived defoliation scores, as calculated by an overall mean of 20 observations (5 leaf clusters in each compass direction), in both years of data collection, 2016 (2016: Lin’s Concordance Correlation Coefficient, N = 157 trees, rho = 0.82 (0.75–0.87), bias correlation factor = 0.99; 2017: N = 83 trees, rho = 0.82 (0.75–0.88), bias correlation factor = 0.97).
- 2.
Shea abundance
We measured shea abundance (that is, the number of fruits, which corresponds to the number of nuts since the nut is found inside the fruit) in 2017 on a scale of 0–3 (0 = None visible, 3 = Abundant) for N = 95 trees in Soumosso. We took five measures per tree: a branch was selected at random in each compass direction and scored from 0 to 3, and after observing the entire tree, we assigned one overall score from 0 to 3 to the tree. We checked inter-observer concordance as described above, and compared independently-made observations until all observations fell within the same category on the scale of 0–3. The measure of overall shea abundance showed poor concordance with the mean of the four observations in each compass direction (Lin’s Concordance Correlation Coefficient, N = 95, rho = 0.62 (0.51–0.71), bias correlation factor = 0.88). There was no significant difference in shea abundance across the four compass directions (repeated measures ANOVA across 95 N/S/E/W scores, F3,270 = 1.4, p = NS). We therefore focus for the rest of the paper on the mean of four measures per tree.
- 3.
Crop height
For each tree, we measured the height of 16 maize plants from base to tip in September 2016 and in September 2017. We measured 4 plants in each of the four compass directions. We selected these 4 plants based on their position at distances d/3, 2d/3, 4d/3, 5d/3 away from the trunk of the tree, where d = distance from the trunk to the canopy edge in the given compass direction. Maize plants were typically taller beyond the canopy. To gain a measure of the difference in height of plants growing outside and under the canopy for each tree, we first subtracted the mean height of the two plants under the canopy (at d/3 and 2d/3) from the mean height of those outside the canopy (at 4d/3 and 5d/3) (Fig. 3), for each compass direction. We then calculated the mean of these difference values across our four directions to give a single measure per tree.
Fig. 3 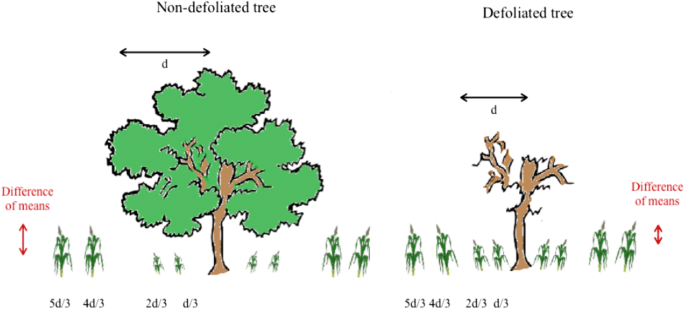
Diagram showing how measurements were taken for maize height, outside and under the shea tree canopy. Differences of means were calculated by subtracting the mean height under the canopy from the mean height outside of the canopy, in all four compass directions
- 4.
Crop productivity
The height of individual maize plants was used as a proxy for plant productivity. We checked the validity of this measure by measuring productivity directly, immediately prior to harvesting. We selected one tree at random from each of 9 fields (selected from the study sample based on geographic convenience and permission of owners), and heights of 4 maize plants near it were measured as described above but only for a single randomly chosen compass direction. We also measured the mass and abundance of their cobs.

Ethical approval
We obtained ethical approval for the study prior to both field seasons in 2016 and 2017, from the Department of Geography Ethics Review Group, University of Cambridge.
Results
We found no significant difference in defoliation across compass directions, in either year of data collection (for 2016 repeated measures ANOVA across 157 sets of N/S/E/W scores, F3,452 = 0.2, NS; for 2017 repeated measures ANOVA across 83 sets of N/S/E/W scores, F3,324 = 0.5, NS). This suggests caterpillars do not preferentially defoliate trees in any one direction; therefore all subsequent analyses use the overall mean of 20 observations per tree as the measure of defoliation.
Shea fruit abundance in 2017 did not show any association with defoliation by caterpillars in the preceding year (Spearman’s rank correlation, rs = 0.011, N = 84, p = NS) (Fig. 4).

Defoliation (0–100%, continuous scale) in 2016 and mean shea abundance (0–3, ordinal scale) in 2017. Darker circles show overlapping data points. The relationship between the two is non-significant (Spearman’s rank correlation, rs = 0.011, N = 84, p = NS)
However, we did find evidence of a link between defoliation and maize growth (Fig. 5). In 2016, the difference between the height of maize plants beyond the tree canopy and under the tree canopy decreased with increasing defoliation (fitted linear model, N = 66 trees, F1,64 = 12.5, p < 0.001; Fig. 5). There was no such association in 2017 (linear regression, N = 42, F1,40 = 1.9, p = 0.17). This may be because deofliation was significantly higher in 2017 (Wilcoxon rank sum test, W = 2660, p < 0.001), when nearly all trees were defoliated to some degree (Fig. 5).

Correlation between defoliation (0–100%, continuous scale) and difference in crop height beyond and under the tree canopy, in 2016 (left; line shows fitted linear model, shaded area shows 95% confidence interval, N = 66 trees, F1,64 = 12.5, p < 0.001), in 2017 (right; non-significant, N = 42 trees, F1,40 = 1.9, p = NS)
We found some evidence for a lagged effect of defoliation on crop height: there was a negative association between defoliation in 2016 and difference in crop height in 2017 (fitted linear model, N = 34 trees, F1,32 = 6.3, p < 0.05) (Fig. 6). However, the statistical strength of this is less than the link between 2016 defoliation and difference in crop height in 2016 (Fig. 5).

Defoliation in 2016 (0–100%, continuous scale) and difference in crop height beyond and under the tree canopy in 2017 (line shows fitted linear model, shaded area shows 95% confidence interval, N = 34 trees, F1,32 = 6.3, p < 0.05)
Defoliation in 2016 did not predict defoliation in 2017 (fitted linear model, N = 64 trees, F1,62 = 0.74, p = NS).
The associations between defoliation and maize height may reflect links with maize productivity. Our measures of cob production showed that the productivity of each plant (total mass of maize cobs) was significantly positively correlated with plant height (linear regression, N = 36 maize plants, adjusted R2 = 0.62, F3,32 = 19.9, p < 0.001). Importantly, there was no significant interaction with whether or not the plants were under or outside of the canopy (t = − 1.5, NS).
Discussion
We found that individual trees are not consistently more or less prone to defoliation, suggesting that caterpillars do not seem to prefer certain trees in consecutive years. This suggests that the lagged association between maize growth and the previous year’s defoliation is not mediated by its effect on the next year’s canopy.
Despite highly variable (and sometimes marked) levels of defoliation of shea trees by shea caterpillars, we found no evidence of that caterpillar herbivory impacts shea fruit production—variation among trees in the abundance of shea fruit was not correlated with variation in their extent of defoliation the previous year. In contrast, in 2016 (but not 2017) we found a significant negative relationship between defoliation and the difference in the height of maize growing beyond vs under tree canopies: maize plants under trees grew relatively taller the more defoliated those trees. The correlation we observed between maize height and productivity suggests that height is a valid proxy measure for plant productivity and that the relationship between height and productivity is similar for maize plants growing under shea trees and beyond. Therefore the greater relative growth (in 2016) of maize plants under more heavily defoliated trees may in turn be associated with higher crop yields.
The lack of any interaction between the extent of defoliation by shea caterpillars and the abundance of shea fruits the following year aligns with the perceptions of shea caterpillars by some members of the local community. Long-term residents of areas with a history of caterpillar use do not generally consider them to be pests. In two areas of Uganda, 50% and 58% of farmers reported increased fruit production following defoliation by caterpillars (Okullo et al. 2004), and an experimental study with seedlings suggested that defoliation did not adversely affect growth (Ugese et al. 2011). However, shea caterpillars have been referred to as destructive pests in scientific publications (e.g. Dwomoh et al. 2010), and in places where people are unfamiliar with the caterpillars (either because the people or the caterpillars have recently migrated to the area) there have been reports of pesticide use to combat caterpillar infestation (Odebiyi et al. 2004). Furthermore, there is a danger that if negative attitudes towards insects as food become more prevalent—a trend that has been observed in other parts of the world with globalisation (Van Huis et al. 2013)—people may begin to react to caterpillars with pesticide use. The data reported here, which show that caterpillars do not have any discernible effect on the shea harvest, are important for the maintenance of the caterpillars and caterpillar-harvesting within this agricultural system.
Similarly, the data here show that within a shea-dominant agroforestry system there is no negative association between defoliation by shea caterpillars and maize growth. The inconsistency between years in our result means we cannot conclude that there is a consistent positive association between these variables. It is possible that any relationship may fluctuate due to other factors that we did not account for, such as interannual climatic variation. However, to the extent that maize growth is greater under more heavily defoliated trees, one possible reason is that less radiation is intercepted by the shea canopy before reaching the maize leaves, A second potential mechanism is that caterpillar frass acts as fertilizer. There is a growing body of evidence for the efficacy of insect frass in promoting crop growth: for example, Thai farmers report that cricket frass is beneficial to their rice fields (Halloran et al. 2016); experiments using caterpillar frass to fertilise basil plants found a positive effect on leaf growth (Buenvinida and Tamban 2016); the application of cricket frass on farmers’ fields in Canada has almost doubled yields of fresh hay (D. Goldin, pers. comm.). Likewise, frass from the shea caterpillar may prove to be another source of insect-derived fertilizer.
The results reported here reflect a correlational relationship, but this cannot be assumed to infer causality, as variables such as soil quality, tree age and tree health are not consistent across trees and may have affected our results. We need experimental data to establish causality, and this is an important avenue for future work. However, acquiring such data is complicated by the mobility of the caterpillars, which move between trees and are not easily deterred by commonly used insect deterrents such as tanglefoot and fluon.
Conclusion
We can conclude from this study that shea caterpillars do not appear to be pests in relation to either shea or maize, suggesting that where caterpillars harvesting takes place (or could), farmers should be actively dissuaded from using agrochemicals to combat these insects. There may be a positive effect of defoliation by caterpillars on the growth of maize underneath shea trees, but longer-term observations and further experiments are necessary to clarify the nature and strength of this relationship.
This is the first field study of the interaction between crop yields and the presence of an edible insect that is harvested at a single point in its life cycle. Unlike edible orthopteran pests, the shea caterpillars studied here do not have a discernible negative effect on crop yields. Instead, this insect does not appear to damage production of these economically important plants. We conclude that this appears to be an example of an agricultural system in which humans, as predators of both the plants and the insects in the system, are able to benefit in terms of harvesting both plant and animal matter without an apparent trade-off between the two.
Edible insects are important for the livelihoods of smallholder farmers worldwide (Payne and Van Itterbeeck 2017; Kelemu et al. 2015, Van Huis et al. 2013; Hanboonsong et al. 2013), and these results provide an optimistic framework for their sustainable exploitation under certain circumstances. However, the sustainability of the shea nut-caterpillar-maize system may be threatened by external factors. The market for edible insects is changing rapidly, with demand increasing among wealthier populations (Global Market Insights 2018; Payne 2014; Durst and Shono 2010). The climate is also changing, with increasing aridity in our study region and consequent decreases in crop productivity (Sonwa et al. 2017; Serdeczny et al. 2017). This may lead to management decisions that explicitly prioritise either the insects or the plants, shifting away from the current system. If this does happen, understanding and accounting for the nature of the interactions between these insects and plants will become increasingly important.
References
Anankware JP, Osekre EA, Obeng-Ofori D, Khamala C (2016) Identification and classification of common edible insects in Ghana. Int J Entomol Res 1(5):33–39
Anvo MP, Toguyéni A, Otchoumou AK, Zoungrana-Kaboré CY, Kouamelan EP (2016) Nutritional qualities of edible caterpillars Cirina butyrospermi in southwestern of Burkina Faso. Int J Innov Appl Stud 18(2):639
Binnqüist CL, Shanley P (2004) Riches of the forest: for health, life and spirit in Africa. CIFOR, Bogor
Boffa JM (2000) West African agroforestry parklands: keys to conservation and sustainable management. Unasylva FAO 51:11–17
Boffa JM (2015) Opportunities and challenges in the improvement of the shea (Vitellaria paradoxa) resource and its management. Occasional paper. World Agroforestry Centre, p 24
Bonkoungou EG (2002) The shea tree (Vitellaria paradoxa) and the African shea parklands. CFC Tech Pap 4(21):51–59
Buenvinida VE, Tamban LP (2016) Effectiveness of caterpillar frass as fertileizer on the growth of basil plants (Ocimum basilicum). In: e-Proceeding of the 4th global summit on education
Callo-Concha D, Gaiser T, Ewert F (2012) Farming and cropping systems in the West African Sudanian savanna. WASCAL research area: northern Ghana, southwest Burkina Faso and northern Benin. ZEF working paper series
Cerritos R, Cano-Santana Z (2008) Harvesting grasshoppers Sphenarium purpurascens in Mexico for human consumption: a comparison with insecticidal control for managing pest outbreaks. Crop Prot 27(3–5):473–480
Coulibaly K, Gomgnimbou AP, Yameogo JT, Gnissien M, Nacro HB (2017) Short term effects of the shea tree caterpillars (Cirina butyrospermi Vuillet) manure on the chemical properties of the soil in the Soudanian area of Burkina Faso. Int J Plant Soil Sci 19(5):1–8
DeFoliart GR (1992) Insects as human food: Gene DeFoliart discusses some nutritional and economic aspects. Crop Prot 11(5):395–399
Durst PB, Shono K (2010) Edible forest insects: exploring new horizons and traditional practices. Forest insects as food: humans bite back. FAO, pp 1–4
Dwomoh EA, Akrofi AY, Ahadzi SK (2004) Natural enemies of the shea defoliator, Cirina forda. Trop Sci 44(3):124–127
Dwomoh EA, Ahadzie SK, Agene VN, Somuah GA, Ackonor JB (2010) Biology and phenology of the shea tree defoliator, Cirina forda (Westwood) (Lepidoptera: Saturniidae) in Northern Ghana. Ghana J Hortic 8:55–64
Ecobichon DJ (2001) Pesticide use in developing countries. Toxicology 160(1–3):27–33
Elias M (2015) Gender, knowledge-sharing and management of shea (Vitellaria paradoxa) parklands in central-west Burkina Faso. J Rural Stud 38:27–38
Gausset Q, Yago-Ouattara EL, Belem B (2005) Gender and trees in Péni, South-Western Burkina Faso: women’s needs, strategies and challenges. Geografisk Tidsskr Dan J Geogr 105(1):67–76
Ghazoul J, Mushongohande M, Potgeiter M, Gardiner A, Pearce JP, Stack JC, Frost PD, Kozanayi W, Gondo T, Kurebgaseka N, Dorward AR, Poole ND, Taylor F, Hope R (2006) Mopane woodlands and the mopane worm: enhancing rural livelihoods and resource sustainability. Final Technical Report, Forest Research Programme, Forest Agriculture Interface
Global Market Insights (2018) Edible insects market size by product (beetles, caterpillars, grasshoppers, bees, wasps, ants, scale insects and true bugs), by application (flour, protein bars, snacks), Industry analysis report, Regional outlook (U.S., Belgium, Netherlands, UK, France, China, Thailand, Vietnam, Brazil, Mexico), Application potential, price trends, competitive market share and forecast, 2018–2024. Summary document
Gray LC, Kevane M (2001) Evolving tenure rights and agricultural intensification in southwestern Burkina Faso. World Dev 29(4):573–587
Halloran A, Roos N, Eilenberg J, Cerutti A, Bruun S (2016) Life cycle assessment of edible insects for food protein: a review. Agron Sustain Dev 36(4):57
Hanboonsong Y, Jamjanya T, Durst PB (2013) Six-legged livestock: edible insect farming, collection and marketing in Thailand. RAP Publication
Illgner P, Nel E (2000) The geography of edible insects in sub-Saharan Africa: a study of the Mopane Caterpillar. Geogr J 166(4):336–351
Kelemu S, Niassy S, Torto B, Fiaboe K, Affognon H, Tonnang H, Maniania NK, Ekesi S (2015) African edible insects for food and feed: inventory, diversity, commonalities and contribution to food security. J Insects Food Feed 1(2):103–119
Kevane M, Gray LC (1999) A woman’s field is made at night: gendered land rights and norms in Burkina Faso. Fem Econ 5(3):1–26
Kinyuru JN, Konyole SO, Roos N, Onyango CA, Owino VO, Owuor BO, Estambale BB, Friis H, Aagaard-Hansen J, Kenji GM (2013) Nutrient composition of four species of winged termites consumed in western Kenya. J Food Consum Anal 30(2):120–124
Lovett PN (2010) Sourcing shea butter in 2010: a sustainability check. Glob Ingred Formul Guide 2010:62–68
Lovett PN, Haq N (2000) Evidence for anthropic selection of the Sheanut tree (Vitellaria paradoxa). Agrofor Syst 48(3):273–288
Maranz S (2009) Tree mortality in the African Sahel indicates an anthropogenic ecosystem displaced by climate change. J Biogeogr 36(6):1181–1193
Maranz S, Wiesman Z (2003) Evidence for indigenous selection and distribution of the shea tree, Vitellaria paradoxa, and its potential significance to prevailing parkland savanna tree patterns in sub-Saharan Africa north of the equator. J Biogeogr 30(10):1505–1516
McBride GB (2005) A proposal for strength-of-agreement criteria for Lin’s concordance correlation coefficient. National Institute of Water and Atmospheric Client Report. HAM2005–062, Hamilton, New Zealand
Naughton CC, Lovett PN, Mihelcic JR (2015) Land suitability modeling of shea (Vitellaria paradoxa) distribution across sub-Saharan Africa. Appl Geogr 58:217–227
Odebiyi JA, Bada SO, Omoloye AA, Awodoyin RO, Oni PI (2004) Vertebrate and insect pests and hemi-parasitic plants of Parkia biglobosa and Vitellaria paradoxa in Nigeria. Agrofor Syst 60(1):51–59
Okullo JB, Obua J, Okello G (2004) Use of indigenous knowledge in predicting fruit production of shea butter tree in agroforestry parklands of north-eastern Uganda. Uganda J Agric Sci 9(1):360–366
Payne CL (2014) Wild harvesting declines as pesticides and imports rise: the collection and consumption of insects in contemporary rural Japan. J Insects Food Feed 1(1):57–65
Payne CL, Van Itterbeeck J (2017) Ecosystem services from edible insects in agricultural systems: a review. Insects 8(1):24
Rémy DA, Hervé BB, Sylvain ON (2017) Study of some biological parameters of Cirina butyrospermi Vuillet (Lepidoptera, Attacidae), an edible insect and shea caterpillar (Butyrospermum paradoxum Gaertn. F.) in a context of climate change in Burkina Faso. Adv Entomol 6(1):1
Rocheleau D, Edmunds D (1997) Women, men and trees: gender, power and property in forest and agrarian landscapes. World Dev 25(8):1351–1371
Schreckenberg K (2004) The contribution of shea butter (Vitellaria paradoxa CF Gaertner) to local livelihoods in Benin. In: Forest products, livelihoods and conservation, pp 91–104
Serdeczny O, Adams S, Baarsch F, Coumou D, Robinson A, Hare W, Schaeffer M, Perrette M, Reinhardt J (2017) Climate change impacts in sub-Saharan Africa: from physical changes to their social repercussions. Reg Environ Change 17(6):1585–1600
Sonwa DJ, Dieye A, El Mzouri EH, Majule A, Mugabe FT, Omolo N, Wouapi H, Obando J, Brooks N (2017) Drivers of climate risk in African agriculture. Clim Dev 9(5):383–398
Ugese FD, Ahen A, Ishar SS (2011) Single defoliation had little influence on growth and dry matter attributes of shea (Vitellaria paradoxa CF Gaertn.) seedlings. For Trees Livelihoods 20(4):283–294
Van Huis A, Van Itterbeeck J, Klunder H, Mertens E, Halloran A, Muir G, Vantomme P (2013) Edible insects: future prospects for food and feed security. Food and Agriculture Organization of the United Nations, Rome
Van Itterbeeck J, van Huis A (2012) Environmental manipulation for edible insect procurement: a historical perspective. J Ethnobiol Ethnomed 8(1):3
Wegier A, Alavez V, Pérez-López J, Calzada L, Cerritos R (2018) Beef or grasshopper hamburgers: the ecological implications of choosing one over the other. Basic Appl Ecol 26:89–100
Young JC, Rose DC, Mumby HS, Benitez-Capistros F, Derrick CJ, Finch T, Garcia C, Home C, Marwaha E, Morgans C, Parkinson S (2018) A methodological guide to using and reporting on interviews in conservation science research. Methods Ecol Evol 9(1):10–19
Acknowledgements
We would like to thank Baly Ouattara, Kahit Hien, Poda Nambepierre and Madou Ouattara for providing field support and facilitation, making this study possible. We thank our field assistants Momoni Ouattara, Baya Ouattara and Sanou Afsietta, for their assistance with data collection. We thank all of the households in Soumosso and Sitiena whose hospitality and generosity enabled us to work in their fields. We also thank the Natural Environment Research Council of the UK (NERC), King’s College, Cambridge, and the Department of Zoology at the University of Cambridge, for financial support.
Author information
Authors and Affiliations
Corresponding author
Additional information
Publisher's Note
Springer Nature remains neutral with regard to jurisdictional claims in published maps and institutional affiliations.
Rights and permissions
Open Access This article is distributed under the terms of the Creative Commons Attribution 4.0 International License (http://creativecommons.org/licenses/by/4.0/), which permits unrestricted use, distribution, and reproduction in any medium, provided you give appropriate credit to the original author(s) and the source, provide a link to the Creative Commons license, and indicate if changes were made.
About this article

Cite this article
Payne, C., Badolo, A., Sagnon, B. et al. Effects of defoliation by the edible caterpillar “chitoumou” (Cirina butyrospermi) on harvests of shea (Vitellaria paradoxa) and growth of maize (Zea mays). Agroforest Syst 94, 231–240 (2020). https://doi.org/10.1007/s10457-019-00385-5
Received:
Accepted:
Published:
Issue Date:
DOI: https://doi.org/10.1007/s10457-019-00385-5